Author: OurNetwork
Translation: ShenChao TechFlow
DEXs
Uniswap | PancakeSwap | Raydium | Let's F***ing Joe (Trader Joe)
El Barto | Dashboard
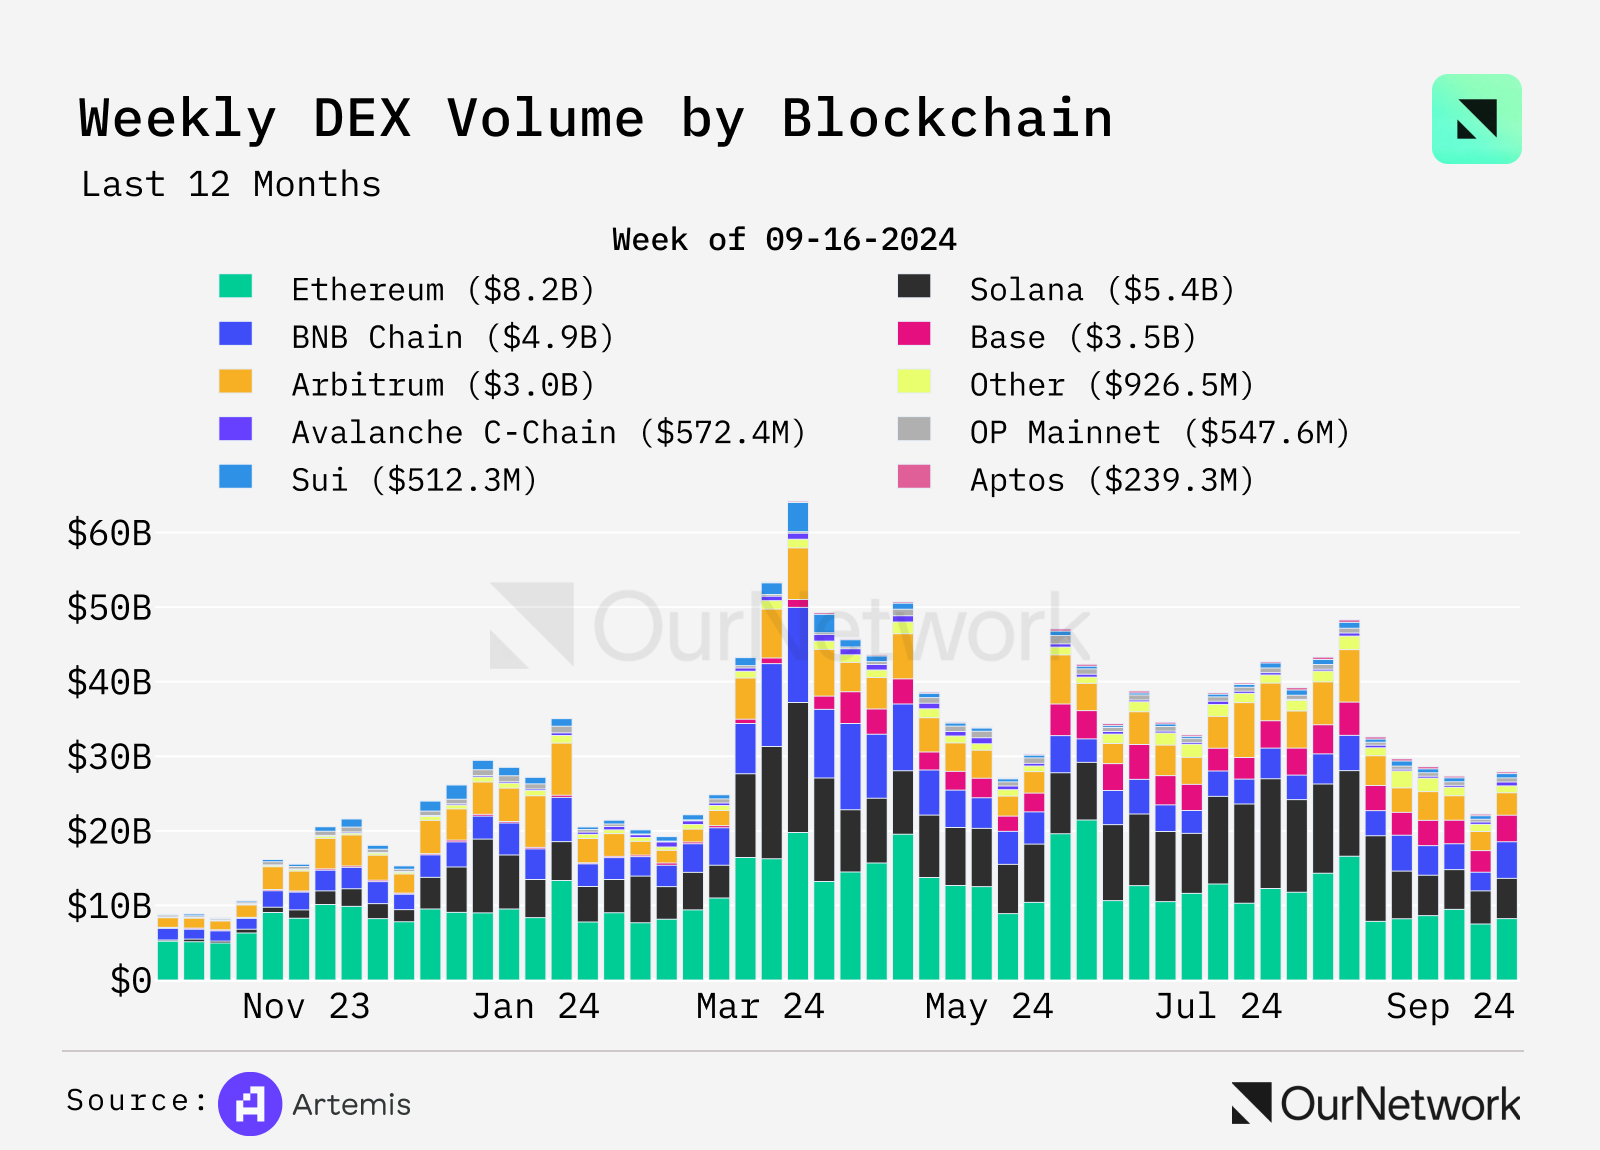
DEX trading volume increased by 100% year-on-year; weekly trading volume reached $17 billion
Although the trading volume of decentralized exchanges (DEX) has declined since its peak in 2024, it still hovers around $20 billion to $25 billion per week, representing a 100% increase compared to last year. Solana and Base have made significant contributions to the trading volume, with Solana's volume increasing more than 20 times, from $170 million to $4 billion. The only blockchain that saw a decrease is Ethereum, with weekly trading volume down about 20%.
Artemis
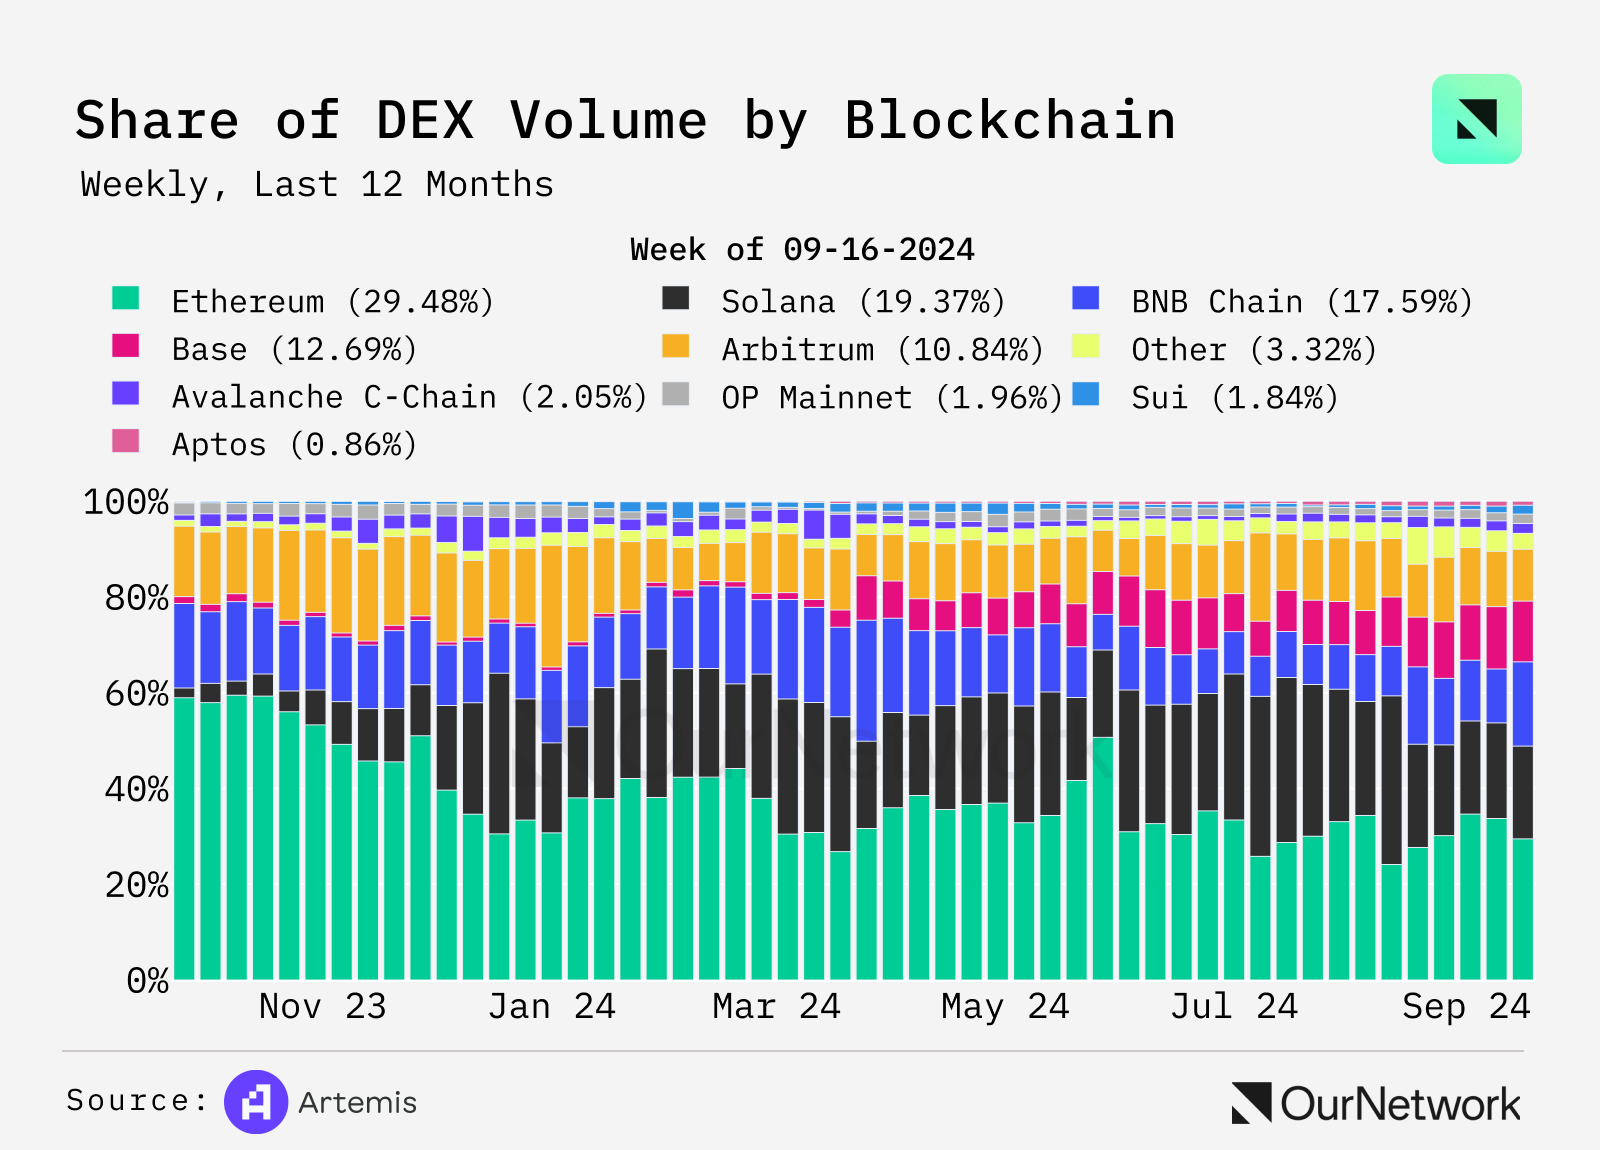
DEX trading has become more competitive than a year ago, when Ethereum accounted for nearly 60% of the market trading volume. Currently, five blockchains have a market trading share of over 10%. Ethereum remains the largest blockchain, accounting for 29%. Base has gained significant market share during 2024, now accounting for over 12% of DEX trading volume across all chains.
Artemis
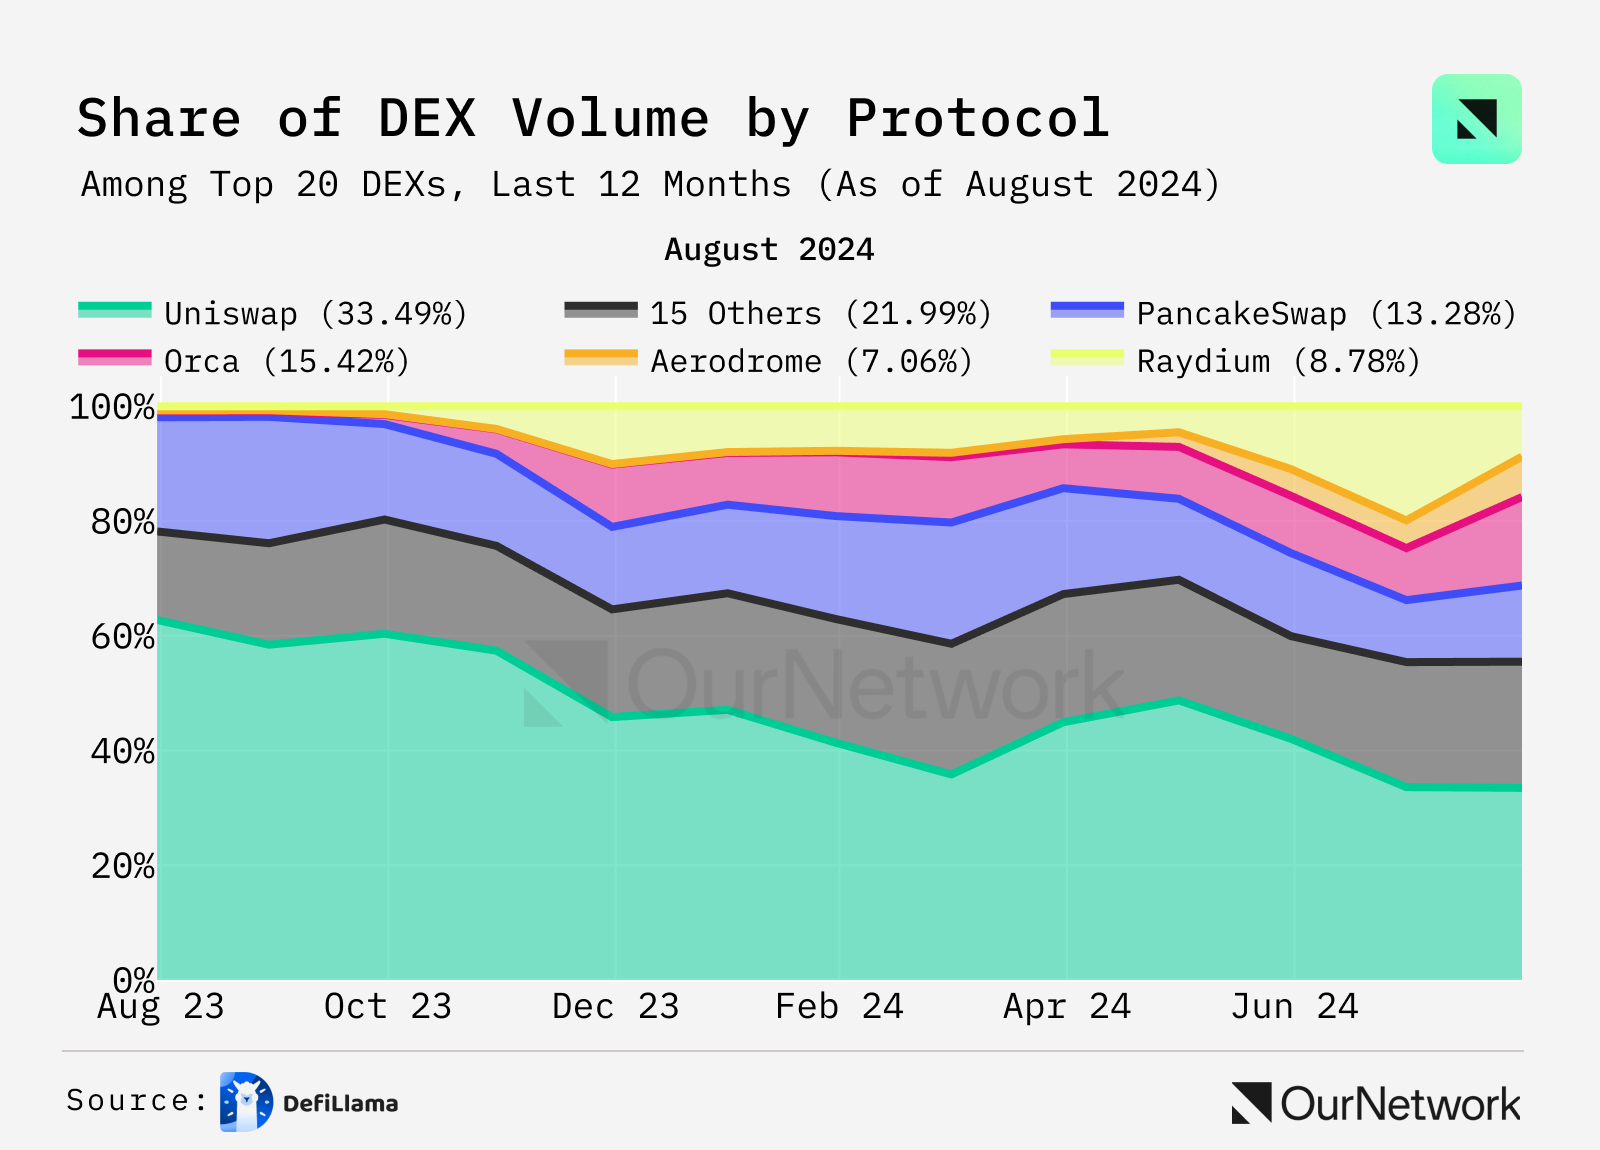
There have also been significant changes in trading venues. Uniswap's market share has dropped to 33%, down from 53%. Meanwhile, established DEXs like Orca, based on Solana, have increased their market share, and the popularity of the new exchange Aerodrome has also risen.
DeFiLlama
Uniswap
Matías Andrade Cabieses | Website | Dashboard
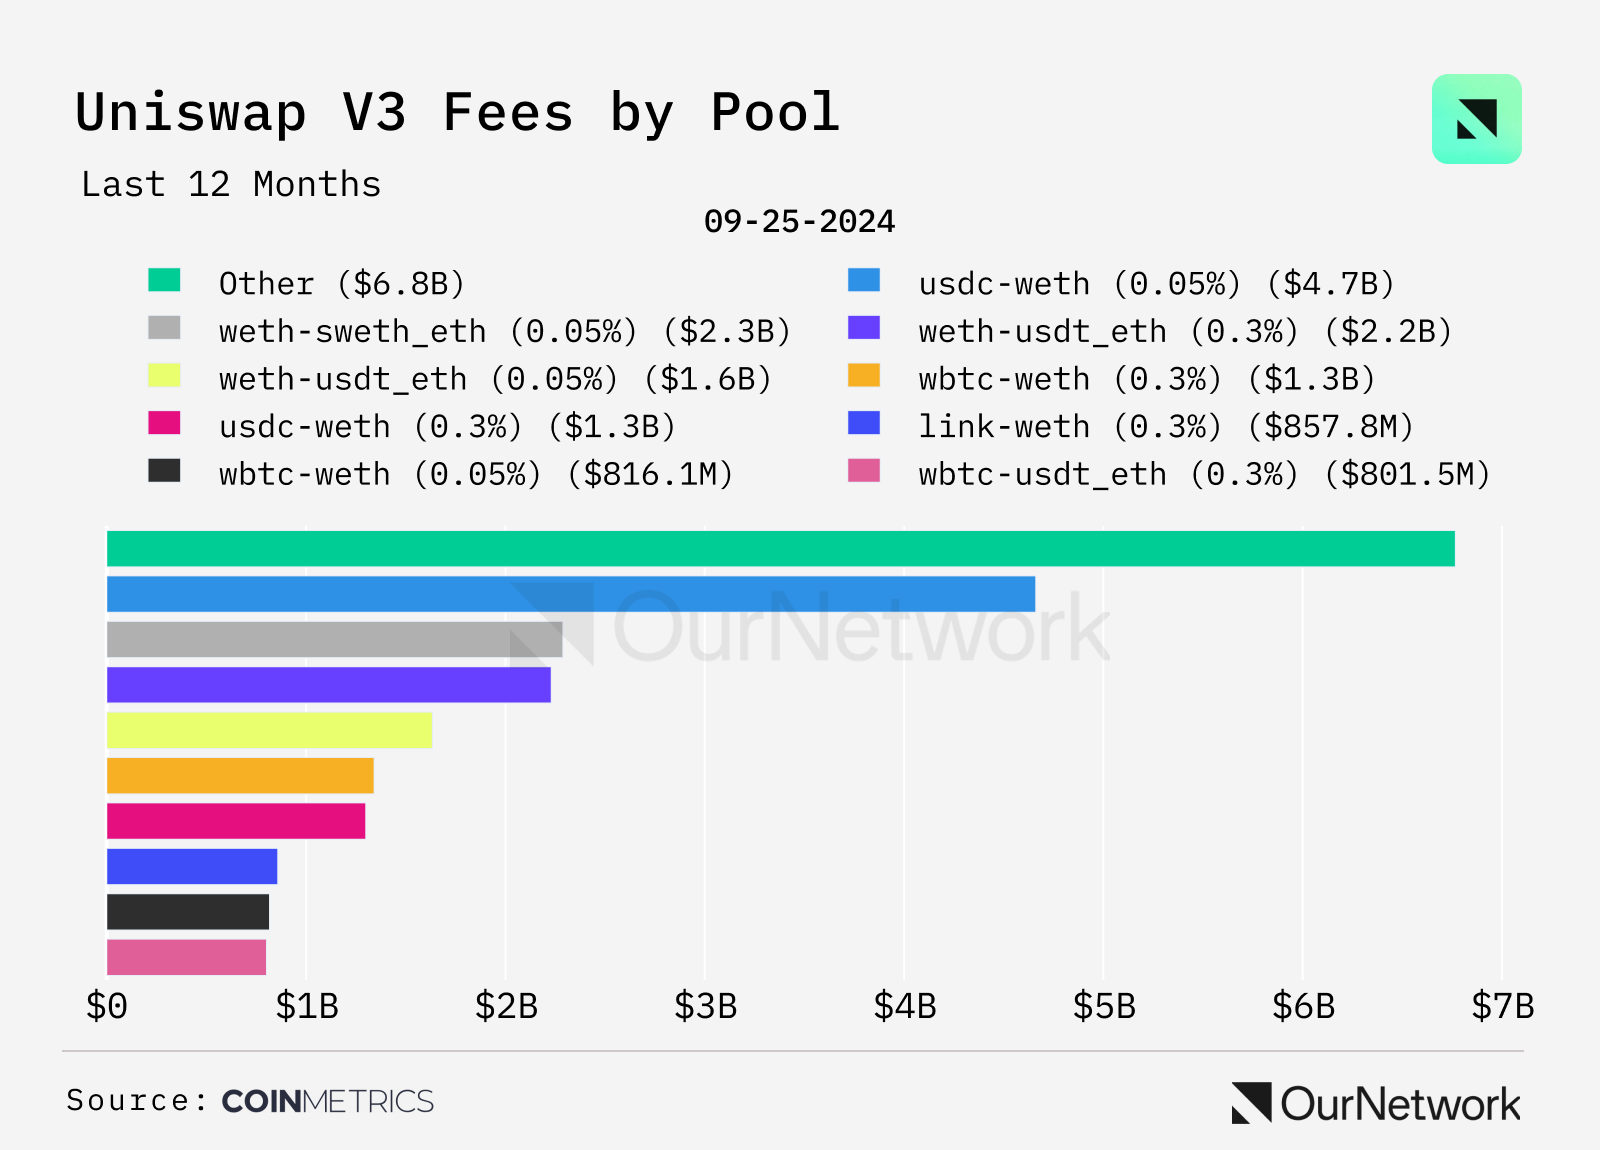
Uniswap generated $26.4 billion in fees over the past year
One of the most attractive features of Uniswap is that it allows liquidity providers—users who provide assets for traders—to earn income. The chart below shows the fees generated by V3 pools over the past 12 months. The USDC-WETH pair performed the best, generating over $4 billion in income for liquidity providers (LPs). Uniswap V3 offers multiple fee tiers to charge traders—0.01%, 0.05%, 0.3%, and 1%—providing flexibility for LPs and traders alike; similar assets, such as stablecoins, typically incur lower fees. These tiered fees allow LPs to optimize returns based on asset volatility and trading activity.
Coin Metrics
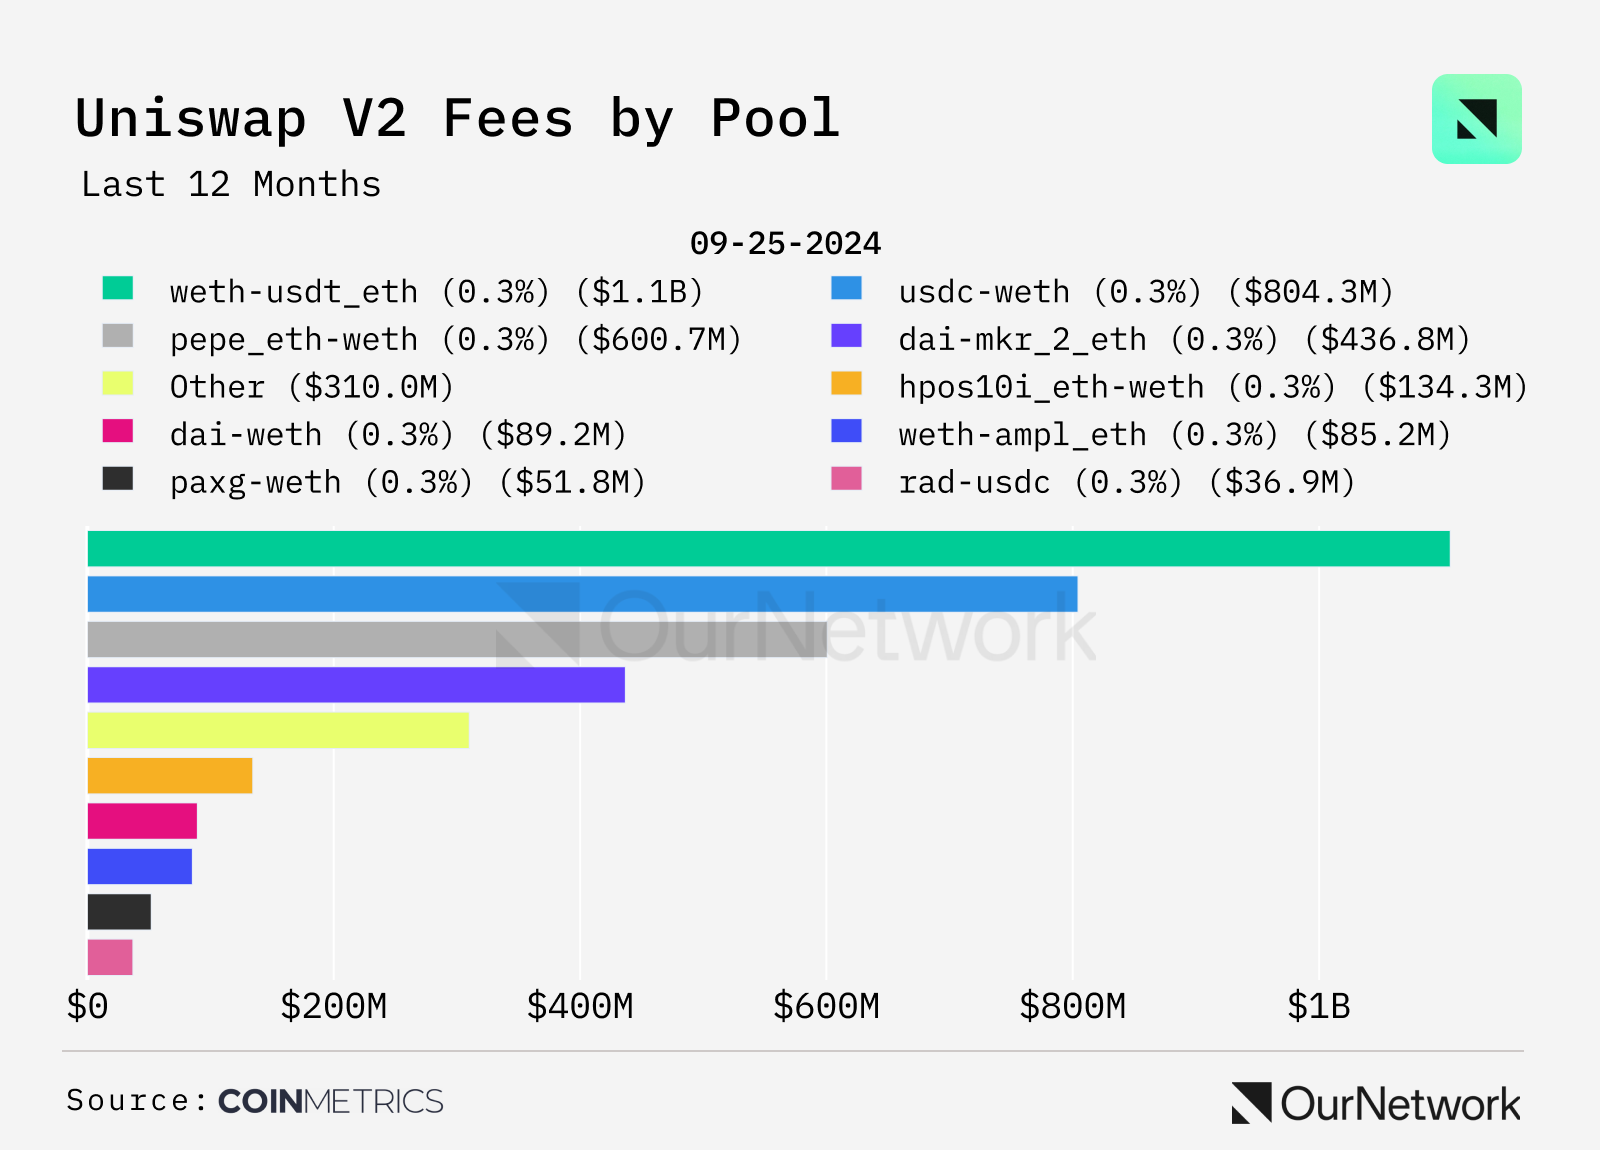
In the Uniswap V2 liquidity pools, the WETH-USDT pool performed the best in terms of fees collected, exceeding $1 billion, followed by the USDC-WETH and PEPE-WETH trading pairs. Despite the simplicity of V2, the concentrated liquidity feature of V3 has attracted larger trading volumes due to its higher capital efficiency and lower fees.
Coin Metrics
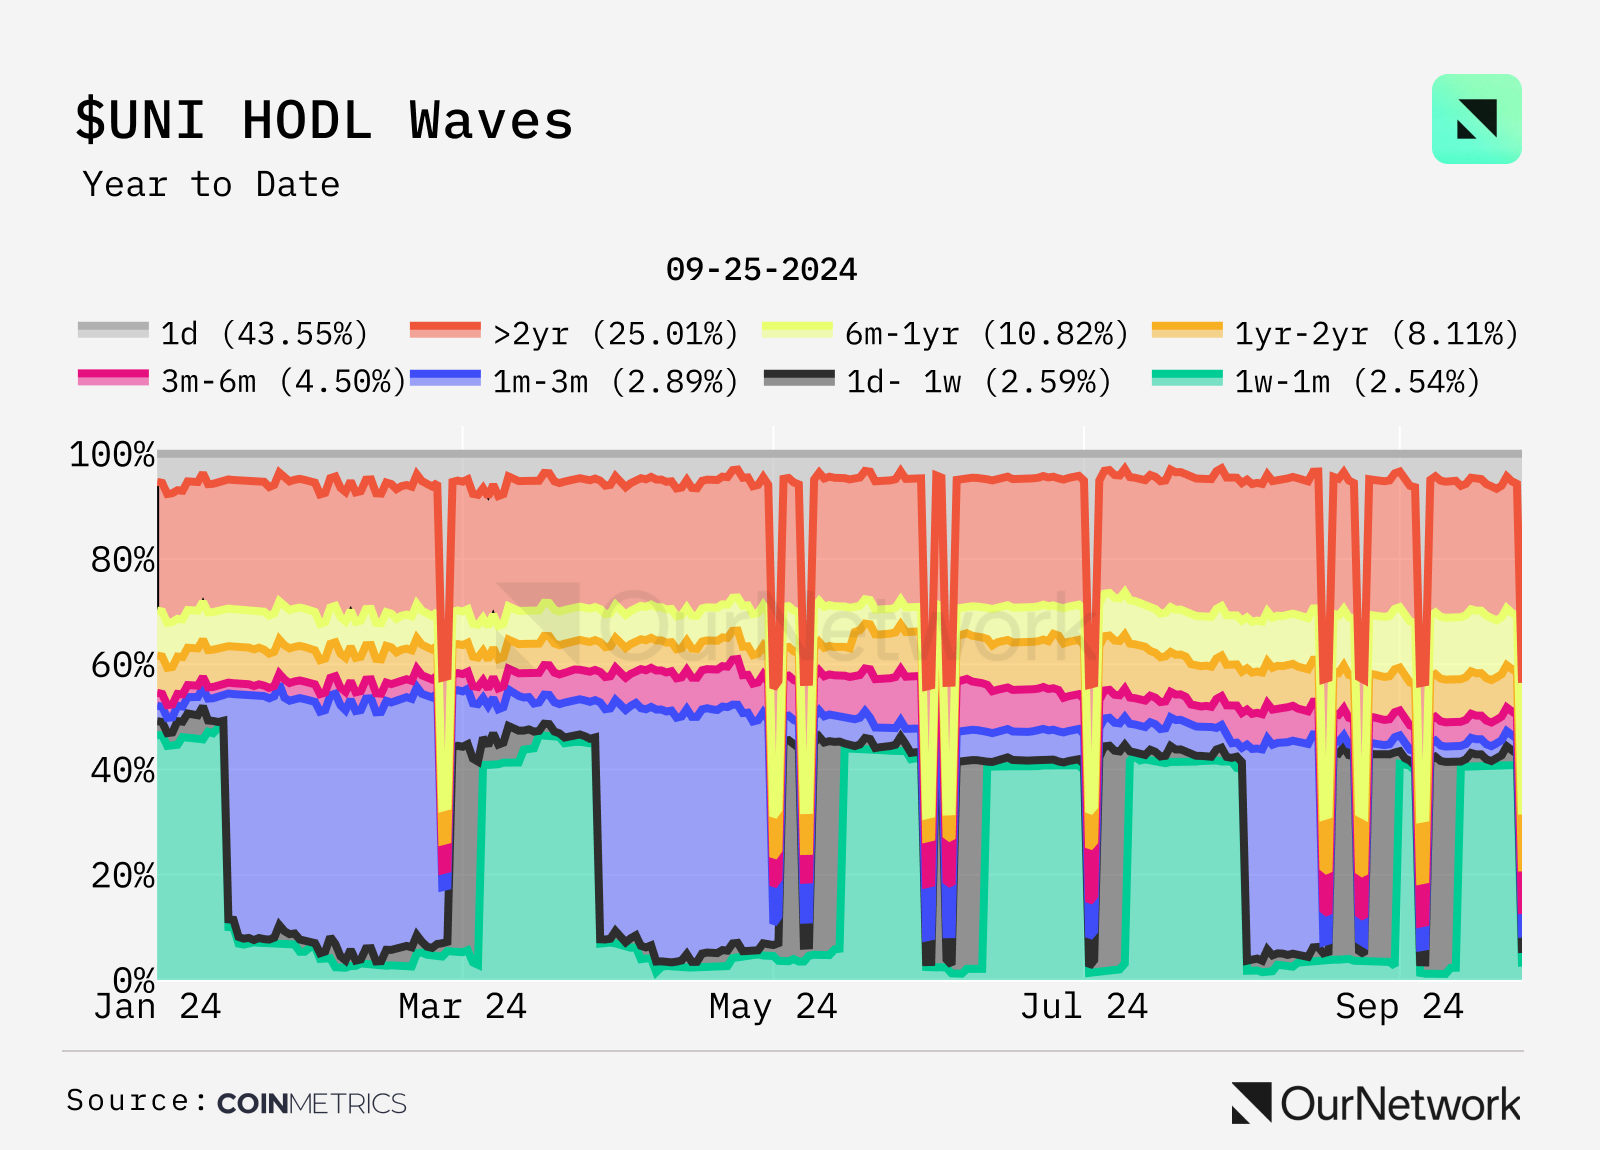
Although Uniswap has generated substantial income for liquidity providers (LPs), $UNI is merely a governance token and lacks mechanisms like token burn that could enhance its value. 60% of UNI was allocated to the community in 2021. This $UNI HOLD Wave chart shows some interesting trends.
Coin Metrics
Trading highlights: This transaction shows the transfer of 500,000 $UNI (approximately $3.5 million) from Uniswap's time-locked contract, which is part of its allocation mechanism. This system ensures that tokens are distributed gradually, aligning with long-term interests and providing transparency. Analyzing these transfers can provide insights into allocation progress, potential market impact, internal behavior, possible changes in governance power, and the health of the protocol.
Pancakeswap
Seb | Website | Dashboard
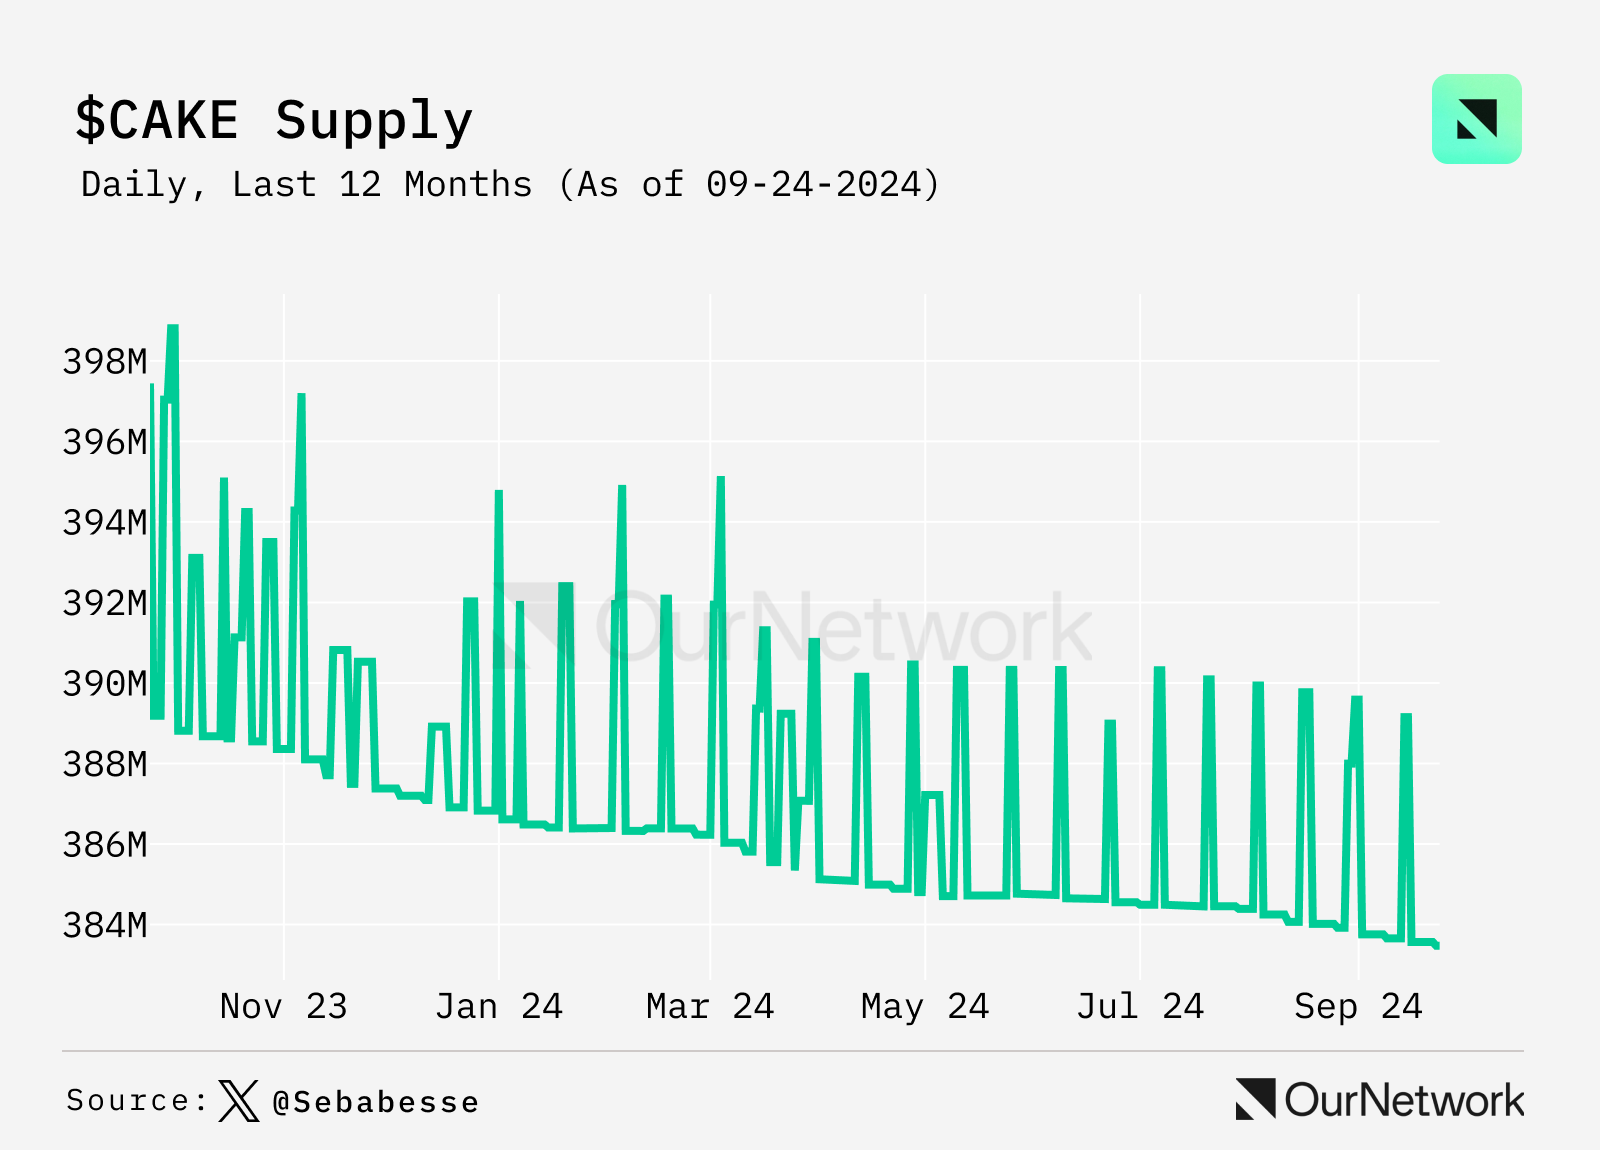
PancakeSwap's $CAKE supply decreased by 7.8 million after one year
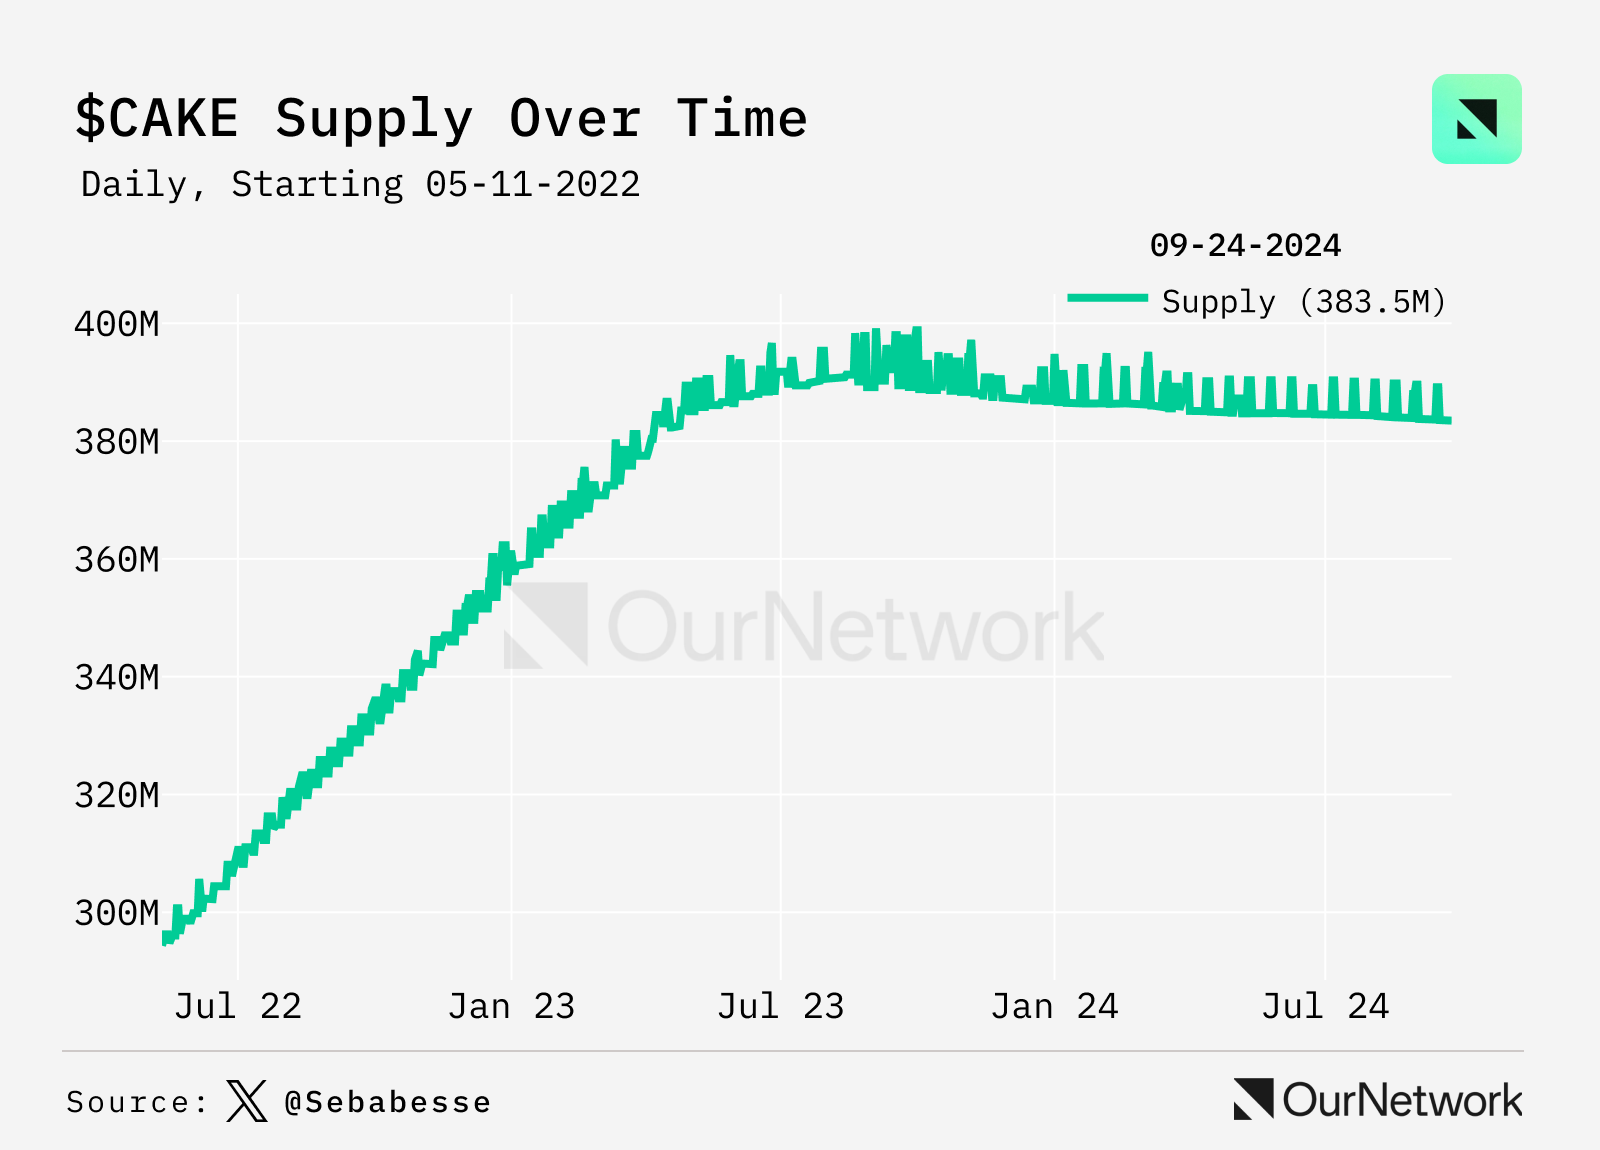
PancakeSwap is a decentralized trading platform originating from BSC, now operating on multiple blockchains—this DEX issues the $CAKE token as rewards for liquidity providers (LPs). In 2023, PancakeSwap adopted a deflationary model to optimize its token economics. This was achieved by reducing the issuance and implementing mechanisms to buy back $CAKE from the market. Their efforts quickly paid off, as the CAKE supply peaked at 391.3 million in August 2023. Since then, the supply has steadily decreased, with a reduction of 7.8 million tokens over the past year.
X - Sebabesse
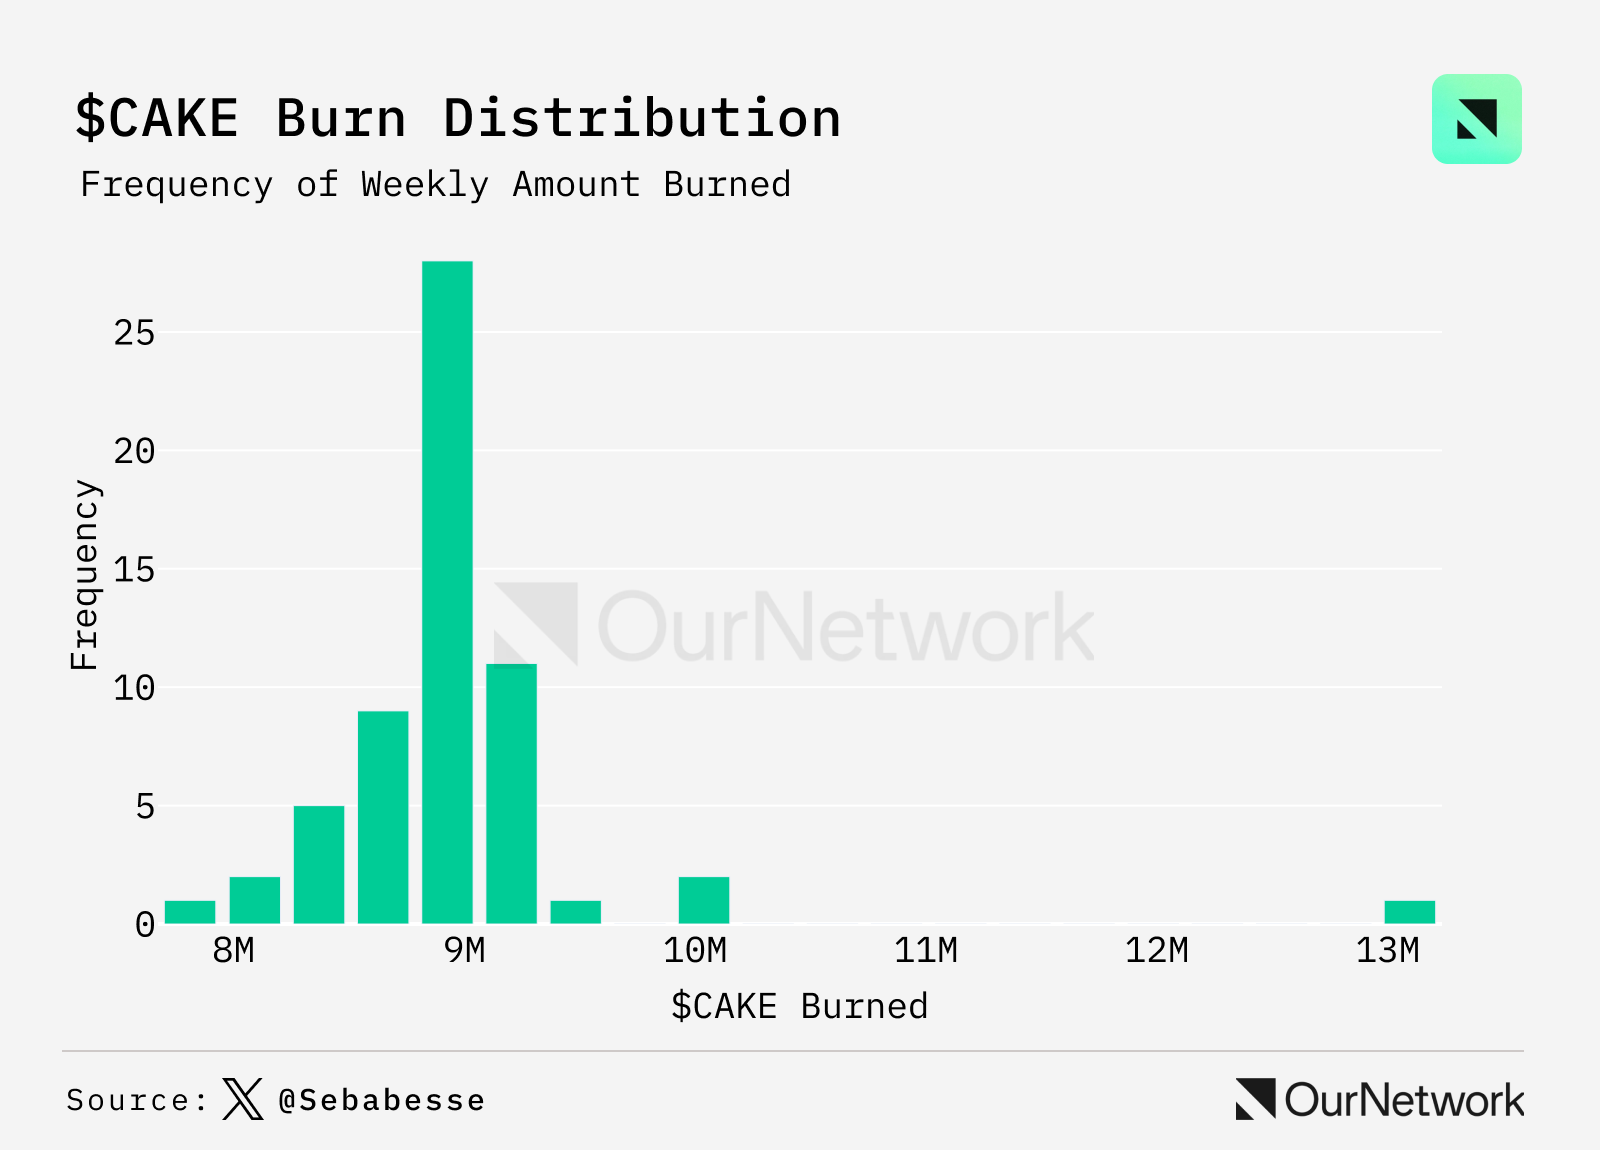
To achieve this deflationary goal, PancakeSwap destroys tokens weekly by sending CAKE to a burn wallet on the BNB chain. According to their token economic model, an average of 9 million CAKE is destroyed weekly. The reduction in issuance and market buybacks offsets the minting volume.
X - @Sebabesse
Deflation is influenced by market factors such as trading volume and CAKE price. Over time, the deflation rate has varied between 1.4 CAKE and 0.2 CAKE per block. According to the current token economics, a weekly supply reduction requires the buyback of 275K CAKE from the market. This target is nearly achieved every week.
X - @Sebabesse
Trading highlights: The team wallet performs token burns every Monday. Monitoring these transactions provides all the information needed to track CAKE supply.
Raydium
0xINFRA | Website | Dashboard
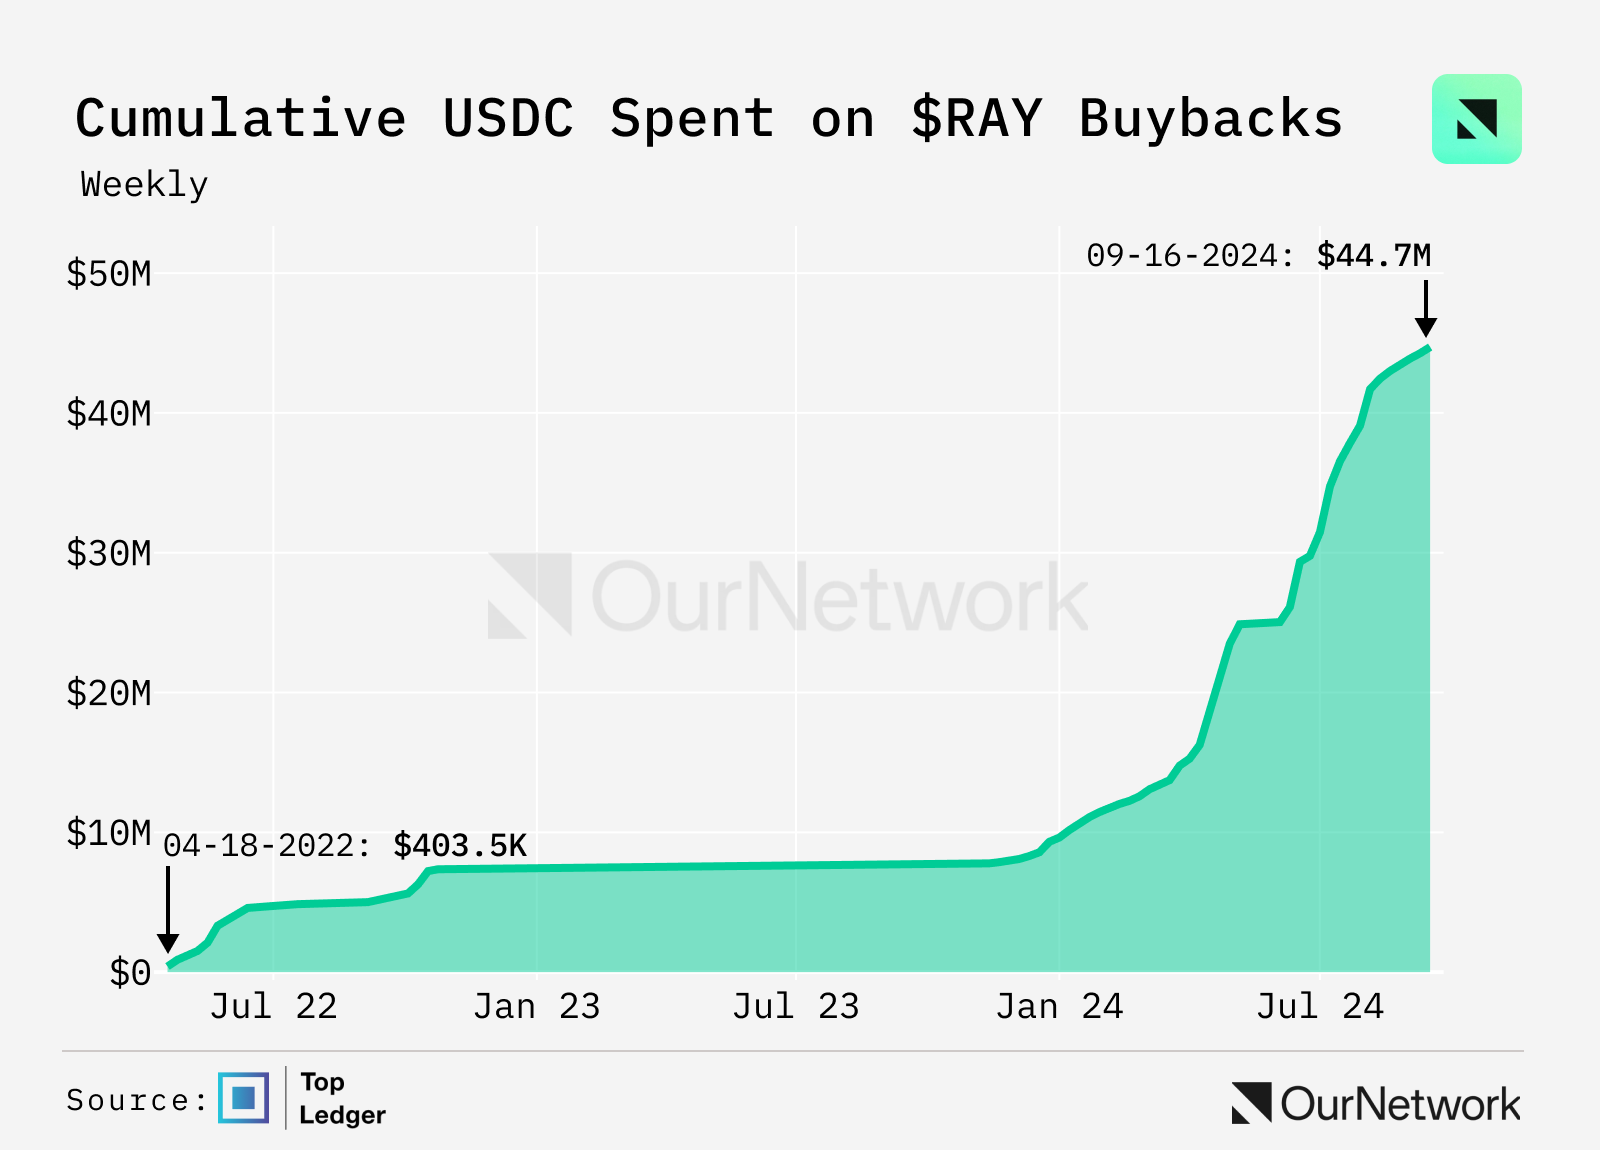
Raydium's total buybacks have exceeded $35 million since January 1
Raydium is the leading decentralized exchange (DEX) on Solana by market share and liquidity pool creation volume. Since January 1, 2024, over $35 million in protocol fees have been allocated for the automatic buyback of $RAY tokens. Throughout the year, Raydium has averaged a share of 30% to 50% of the cumulative spot market trading volume on Solana. Since its inception, Raydium has achieved nearly $270 billion in trading volume, with liquidity providers (LPs) earning over $630 million in trading fees.
Top Ledger
Excluding trading bots and considering real trading volume, Raydium's exchange routing program performs excellently, currently accounting for over 30% of all real trading flows, second only to Jupiter.
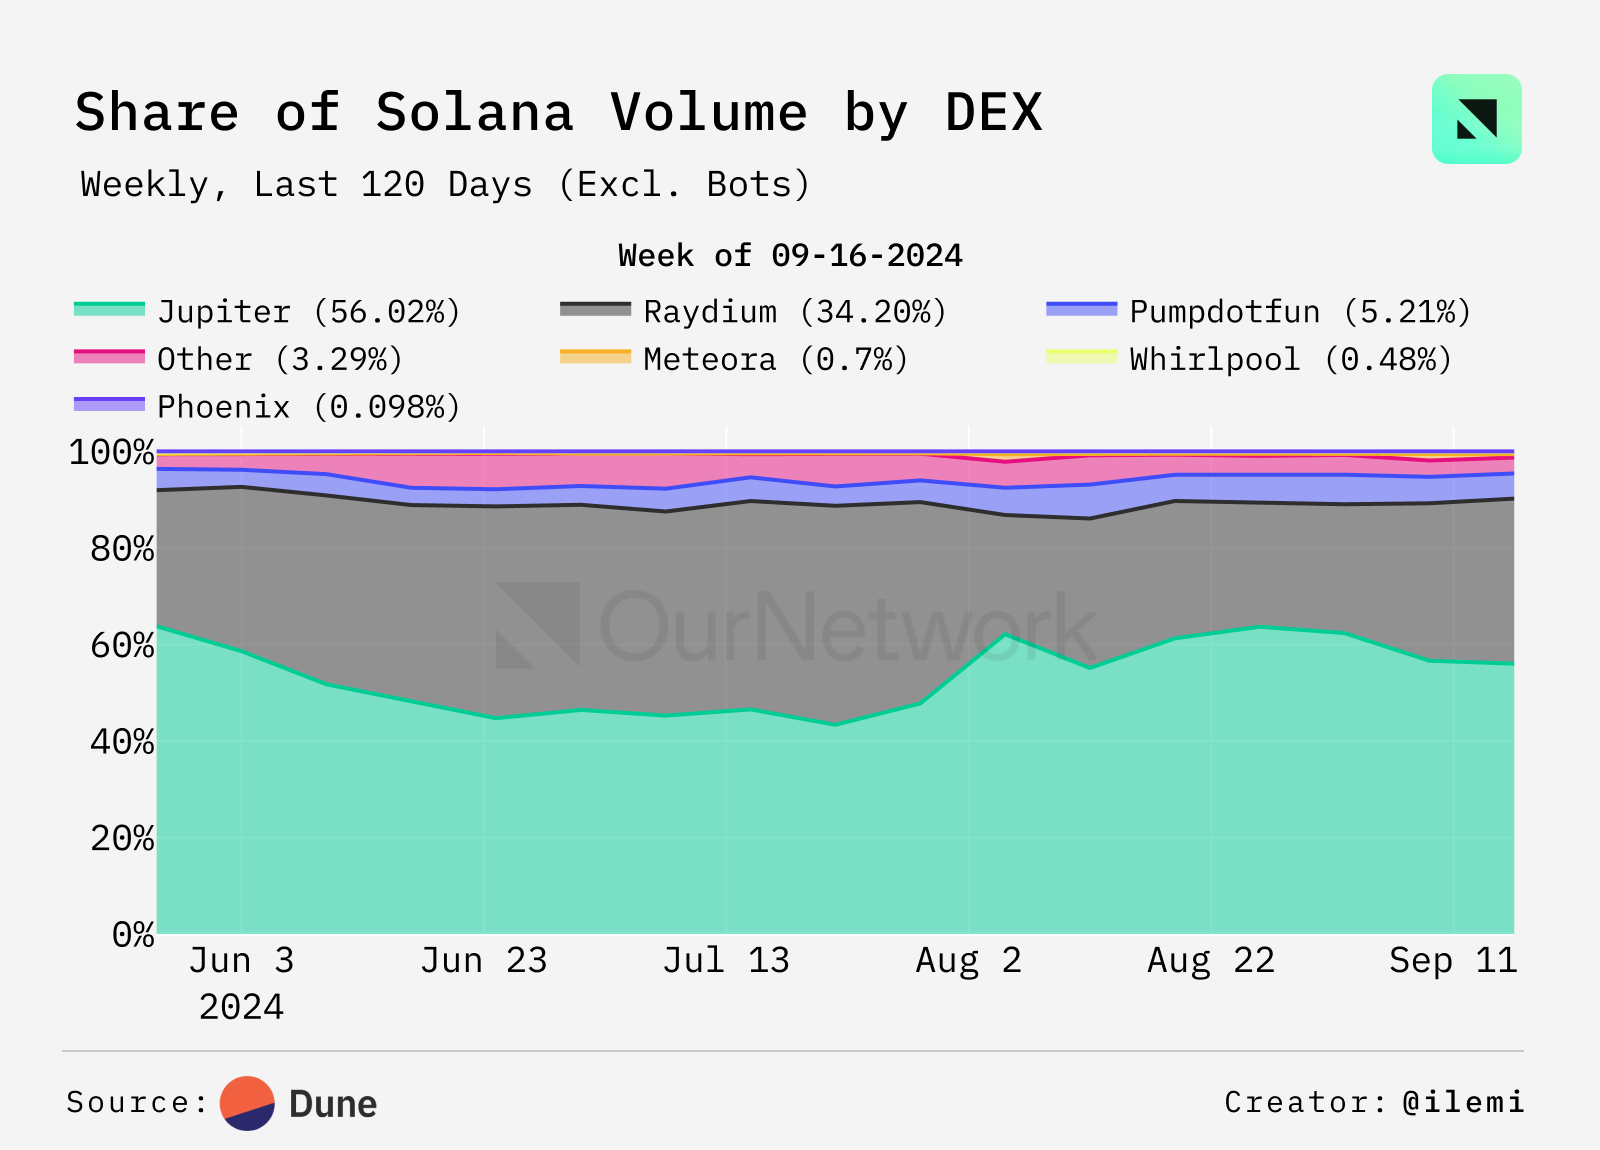
Dune - @ilemi
Despite being one of the main beneficiaries of the booming meme token trading volume on Solana, currently only 11.4% of Raydium's total trading volume comes from meme tokens.
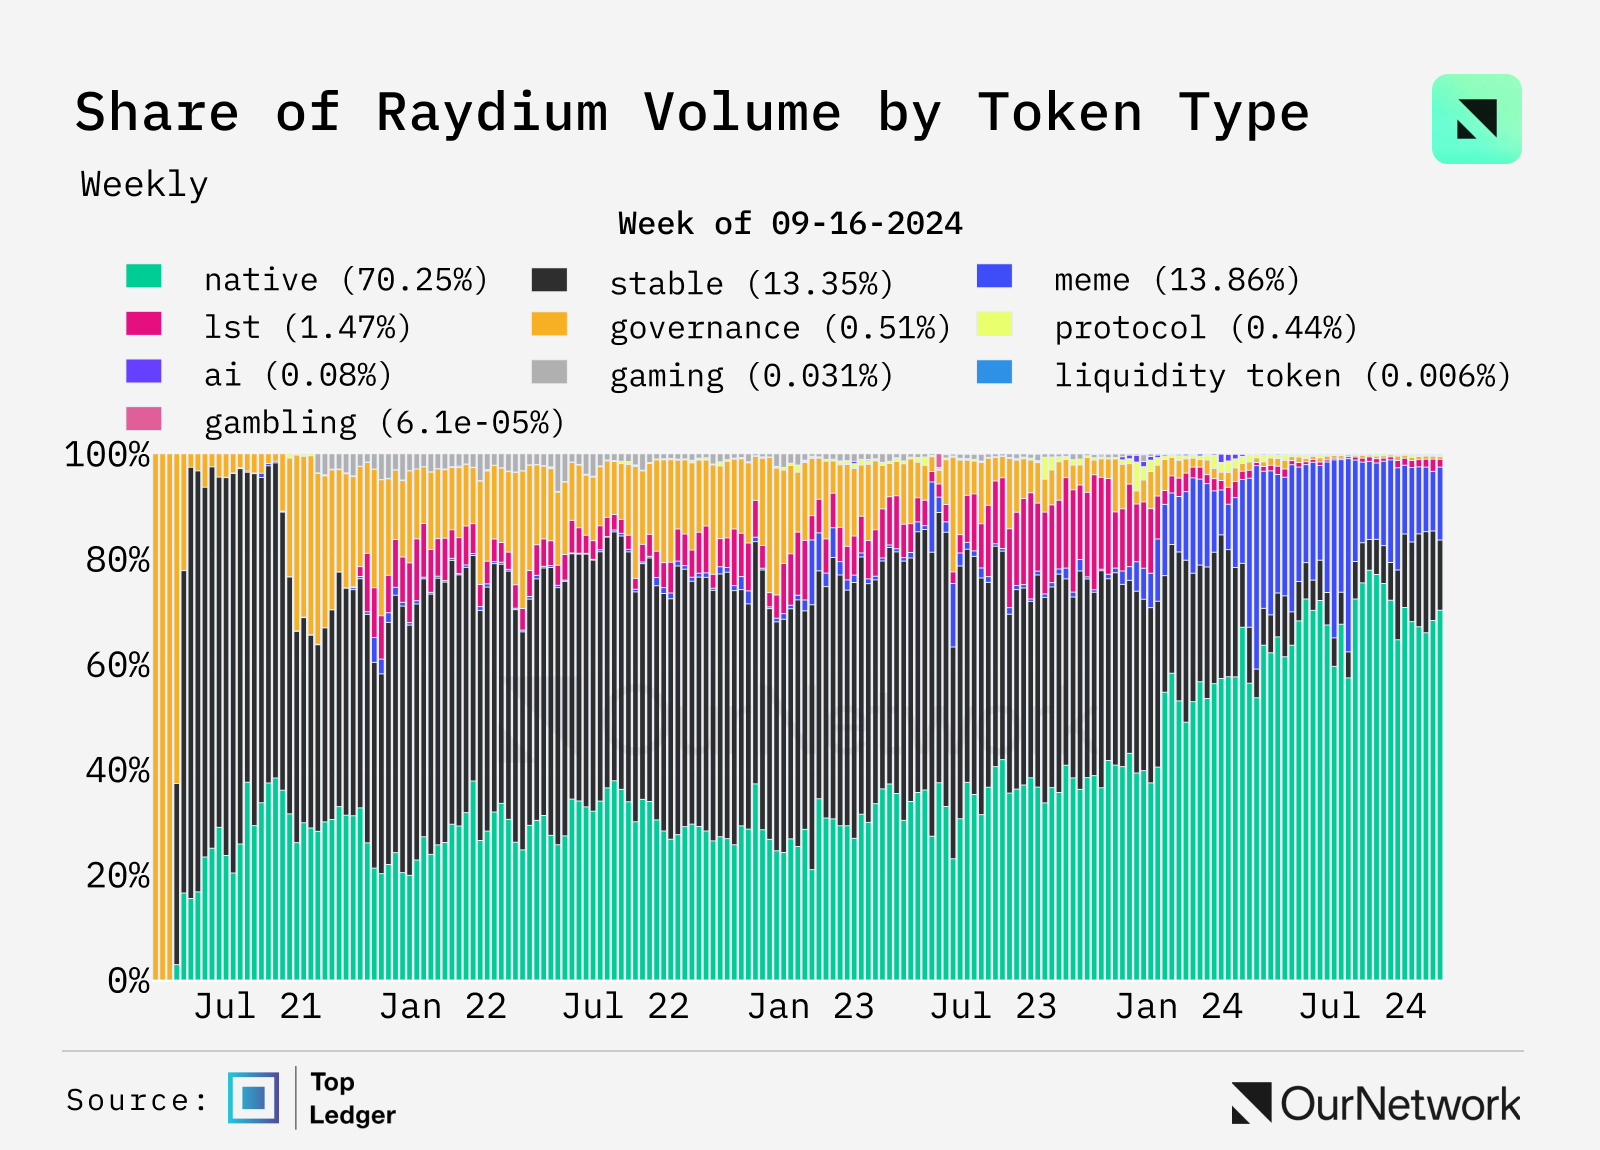
Top Ledger
Trading highlights: Raydium benefits from a rich ecosystem of third-party applications and protocols that utilize its core liquidity pools and trading infrastructure. The most notable is Pump.Fun, which migrated its liquidity pool to Raydium after completing its initial bonding curve. Other teams leveraging Raydium's infrastructure include, but are not limited to, MoonShot from Dexscreen, Trojan, BananaGun, FluxBot, BonkBot, Photon, and BullX.
LFJ
Blue | Website
LFJ reaches $130 billion in cumulative trading volume and surpasses $5 million in 2024 revenue
LFJ (formerly Trader Joe) is a blockchain token trading marketplace that launched in July 2021 and has since facilitated over $130 billion in cumulative trading volume. In 2024, LFJ added over $30 billion in trading volume, doubling last year's figures. This growth is primarily attributed to increased trading activity on the Avalanche network, where LFJ holds a dominant position.
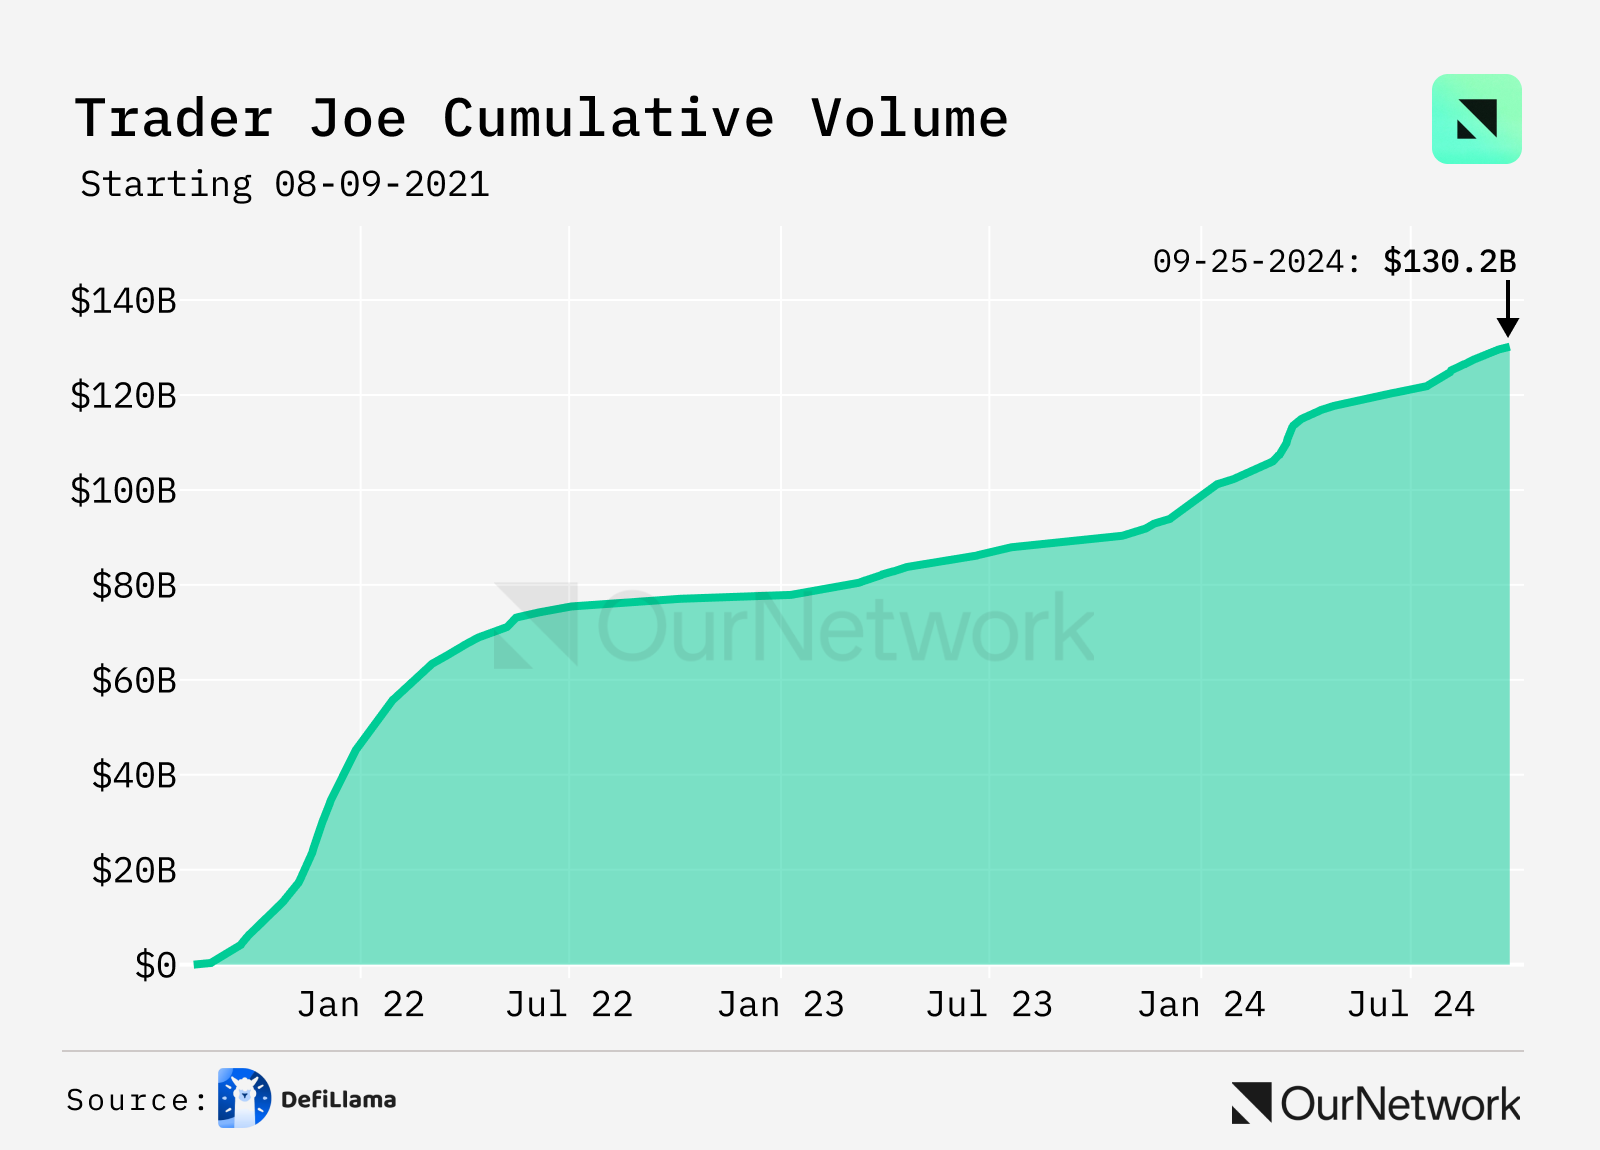
DeFiLlama
LFJ allocates 5%-25% of trading fees to $JOE token stakers, distributing an average of $550,000 in stablecoins per month in 2024, a 109% increase from last year. Since 80% of revenue comes from Avalanche, the increase in on-chain activity has brought significant value to JOE stakers.
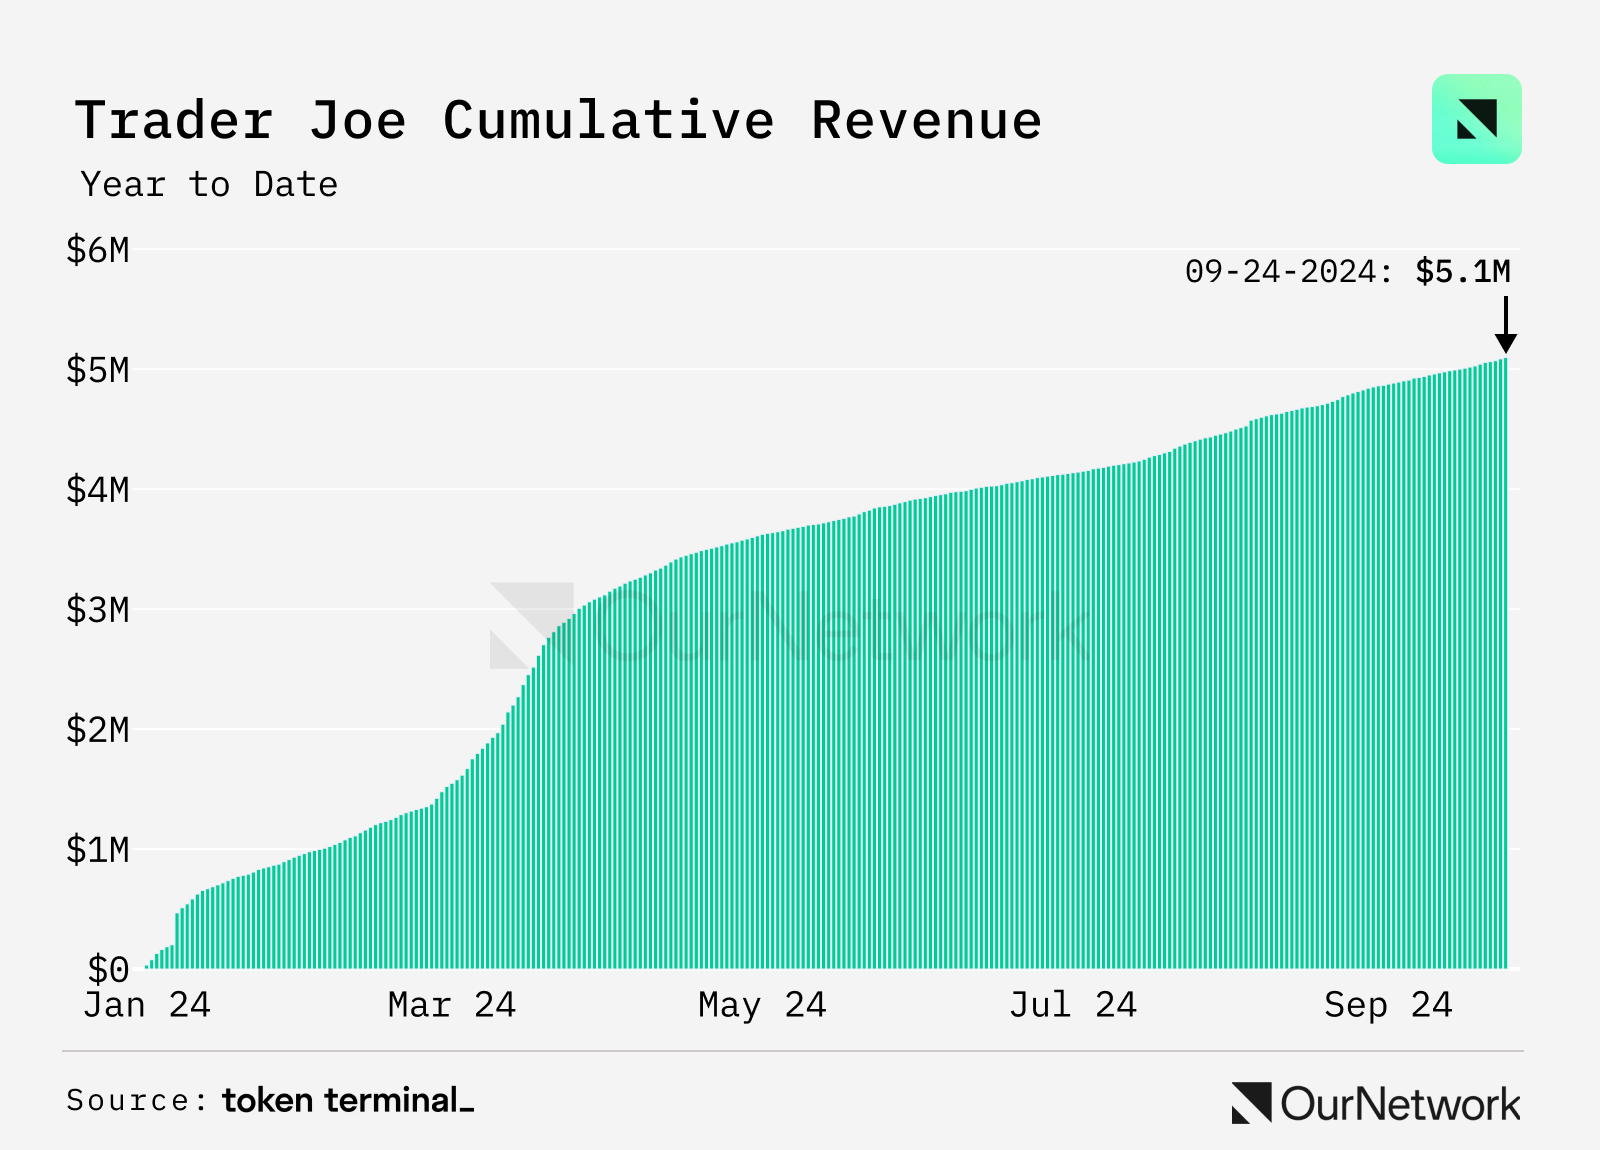
Token Terminal
The $JOE token has reached its issuance cap of 500 million, with a current circulating supply of approximately 380 million. Due to the absence of a fixed reward program, JOE is rarely used as a liquidity reward. To date, less than $100,000 has been distributed to yield farmers while maintaining over $5 million in positive revenue.
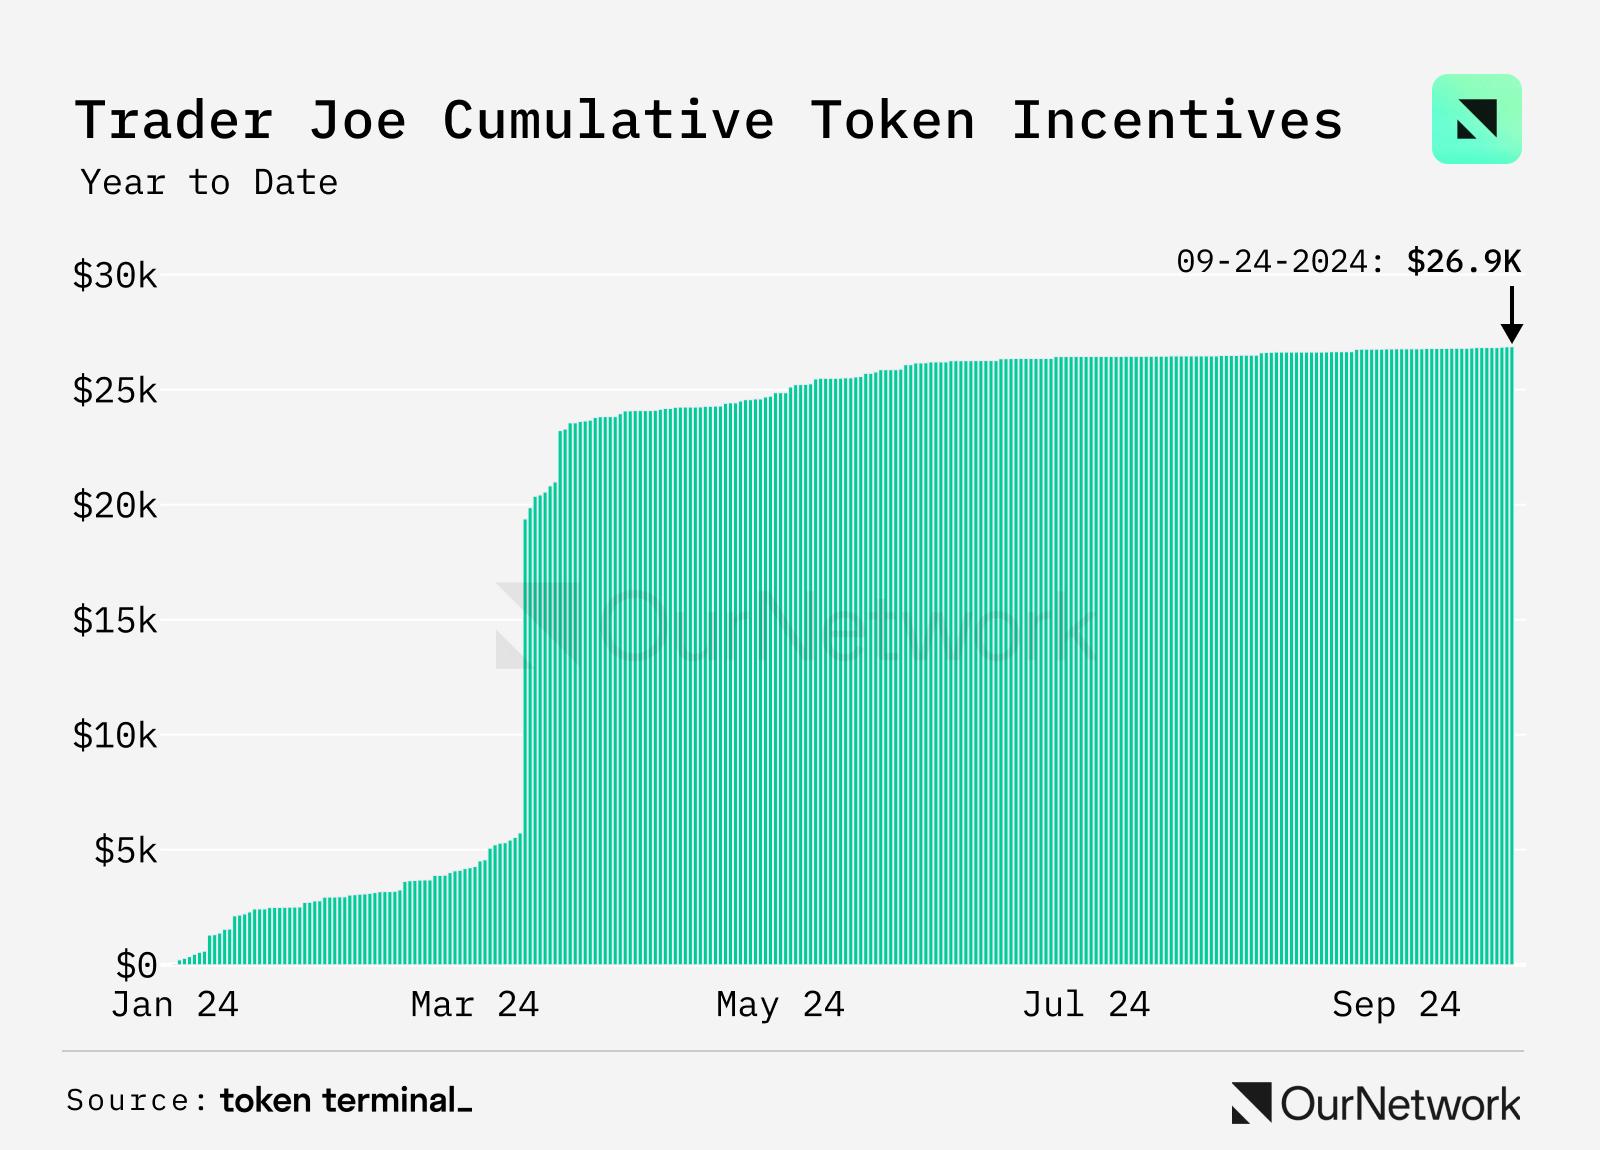
Token Terminal
免责声明:本文章仅代表作者个人观点,不代表本平台的立场和观点。本文章仅供信息分享,不构成对任何人的任何投资建议。用户与作者之间的任何争议,与本平台无关。如网页中刊载的文章或图片涉及侵权,请提供相关的权利证明和身份证明发送邮件到support@aicoin.com,本平台相关工作人员将会进行核查。


