On September 28, the Japanese yen staged a "big reversal," with a significant surge in the exchange rate against the US dollar, while the Nikkei 225 index futures plummeted over 2000 points at one point, triggering a circuit breaker. The probability of interest rate hikes has increased, and yen arbitrage trading has not yet ended. The US money market fund recorded a net outflow of funds for the first time in nine weeks. It is a reminder to remain highly vigilant; where there is one, there may be two or even three. This is the way of heaven, which does not change according to human will. I hope there will be no opportunistic actions!!!
Since the sharp drop of the Nikkei index on August 5, although there has been a decent rebound, after reaching a historical high, it has been in high-level fluctuations for seven months. A second or even third drop similar to the one on August 5 cannot be ruled out (this is a direct quote from the analysis in the article on the 24th). As of the morning of September 30, the Tokyo Nikkei index had plummeted 1947 points, a decrease of 4.89%.
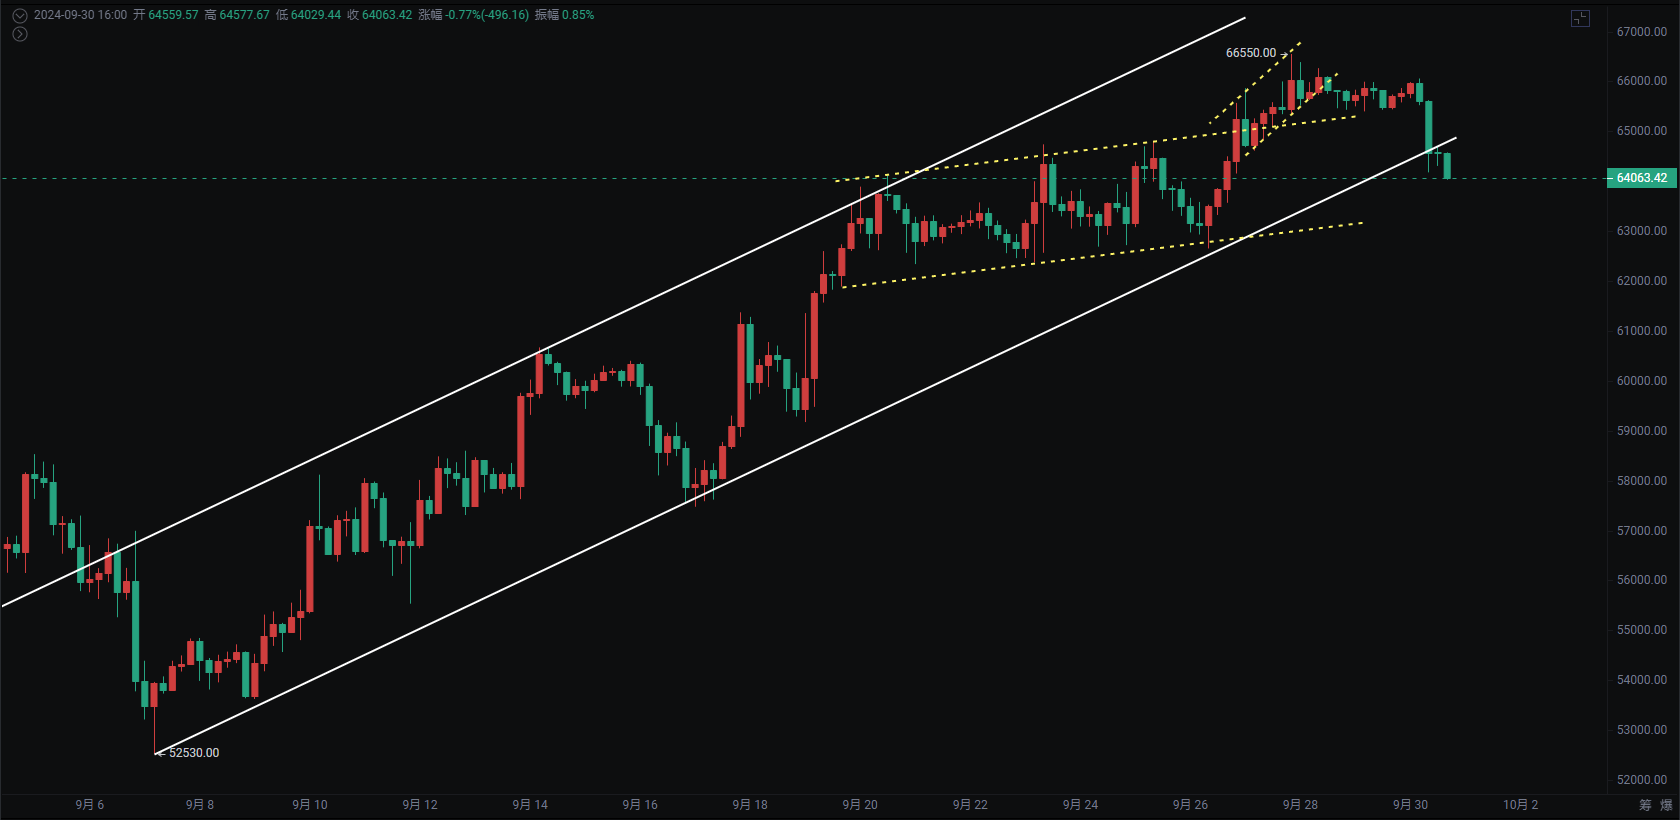
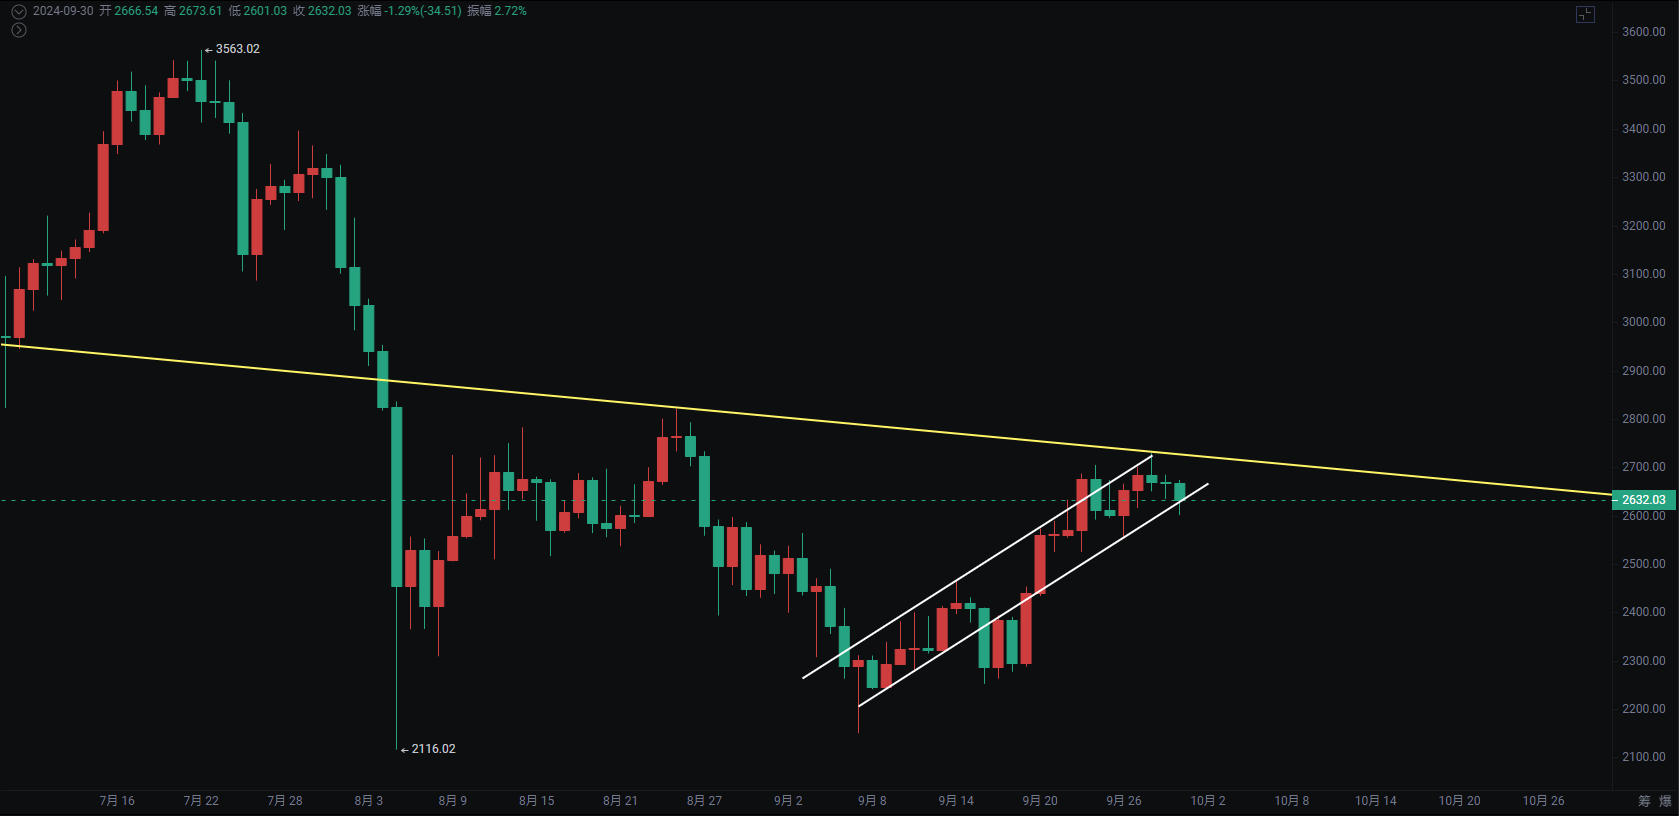
Bitcoin dropped 1800 points in the morning, a decrease of 3.14%, falling back below 65000. It is now just testing the W neckline. If it continues to break down from here, there is a possibility of a false breakout. Ethereum was reminded yesterday that the 4-hour short-term also showed a top divergence. If it still cannot break through 2800, the probability of a pullback is high, and at that time, the altcoins may experience a larger retracement.
Bitcoin
Bitcoin has dropped to 64000, with the daily MACD showing a top divergence, RSI falling back into the overbought zone, and KDJ crossing down from a high position. This has been a continuous reminder of the 4-hour sustained top divergence. It is necessary to pay attention to whether this will transmit to the daily chart. Currently, it is testing the neckline support at 64000, and there are signs of an M-top on the daily chart that need to be guarded against.
The 4-hour chart has broken the upward channel, and the first support to look for is a pullback to 60600—62000. If US stocks open with a significant drop tonight or break below the previously broken historical high platform, a global black swan event cannot be ruled out 🦢 (just need to pay attention to whether US stocks will show a false breakout).
Support:
Resistance:
Ethereum
Ethereum's morning drop and rebound were stronger than Bitcoin's, with the ETH/BTC exchange rate testing 0.040 for a rebound. The 4-hour chart is still near the upward channel, and attention should be paid to whether the 1-hour downtrend can break through for a rebound and how high it can go.
There is a continuous divergence at a smaller scale, and it is also necessary to pay attention to whether Bitcoin will continue to decline and affect Ethereum. Support levels are at 2556 and 2500.
Support:
Resistance:
If you like my views, please like, comment, and share. Let's navigate through the bull and bear markets together!!!
This article is time-sensitive and for reference only, updated in real-time.
Focusing on K-line technical research, sharing global investment opportunities. Public account: Trading Prince Fusu

免责声明:本文章仅代表作者个人观点,不代表本平台的立场和观点。本文章仅供信息分享,不构成对任何人的任何投资建议。用户与作者之间的任何争议,与本平台无关。如网页中刊载的文章或图片涉及侵权,请提供相关的权利证明和身份证明发送邮件到support@aicoin.com,本平台相关工作人员将会进行核查。