Do not worry about having no friends on the road ahead; there are like-minded individuals on the investment journey. Good afternoon, everyone! I am the King of Coins from the Coin Victory Group. Thank you all for coming here to watch the King’s articles and videos, and I hope the brothers who have been following the King will return.
Click the link to watch the video: https://www.bilibili.com/video/BV16wxxeZE7g/

Before discussing the market, let’s first talk about the most concerning U.S.-China policies from a macro perspective. The large-scale monetary easing has already begun, but the first round will definitely be a rotation between the stock market and real estate, and we are not yet in the crypto space. The market's peak last Friday was also influenced by market sentiment, but ultimately, the money did not come in, leading to a pullback after the market surged. There is still a possibility of further bottom testing. In summary, the future is bright, but there are still issues that need to be resolved. All we can say is that crypto friends need to prepare their ammunition for the new round of profit-taking.
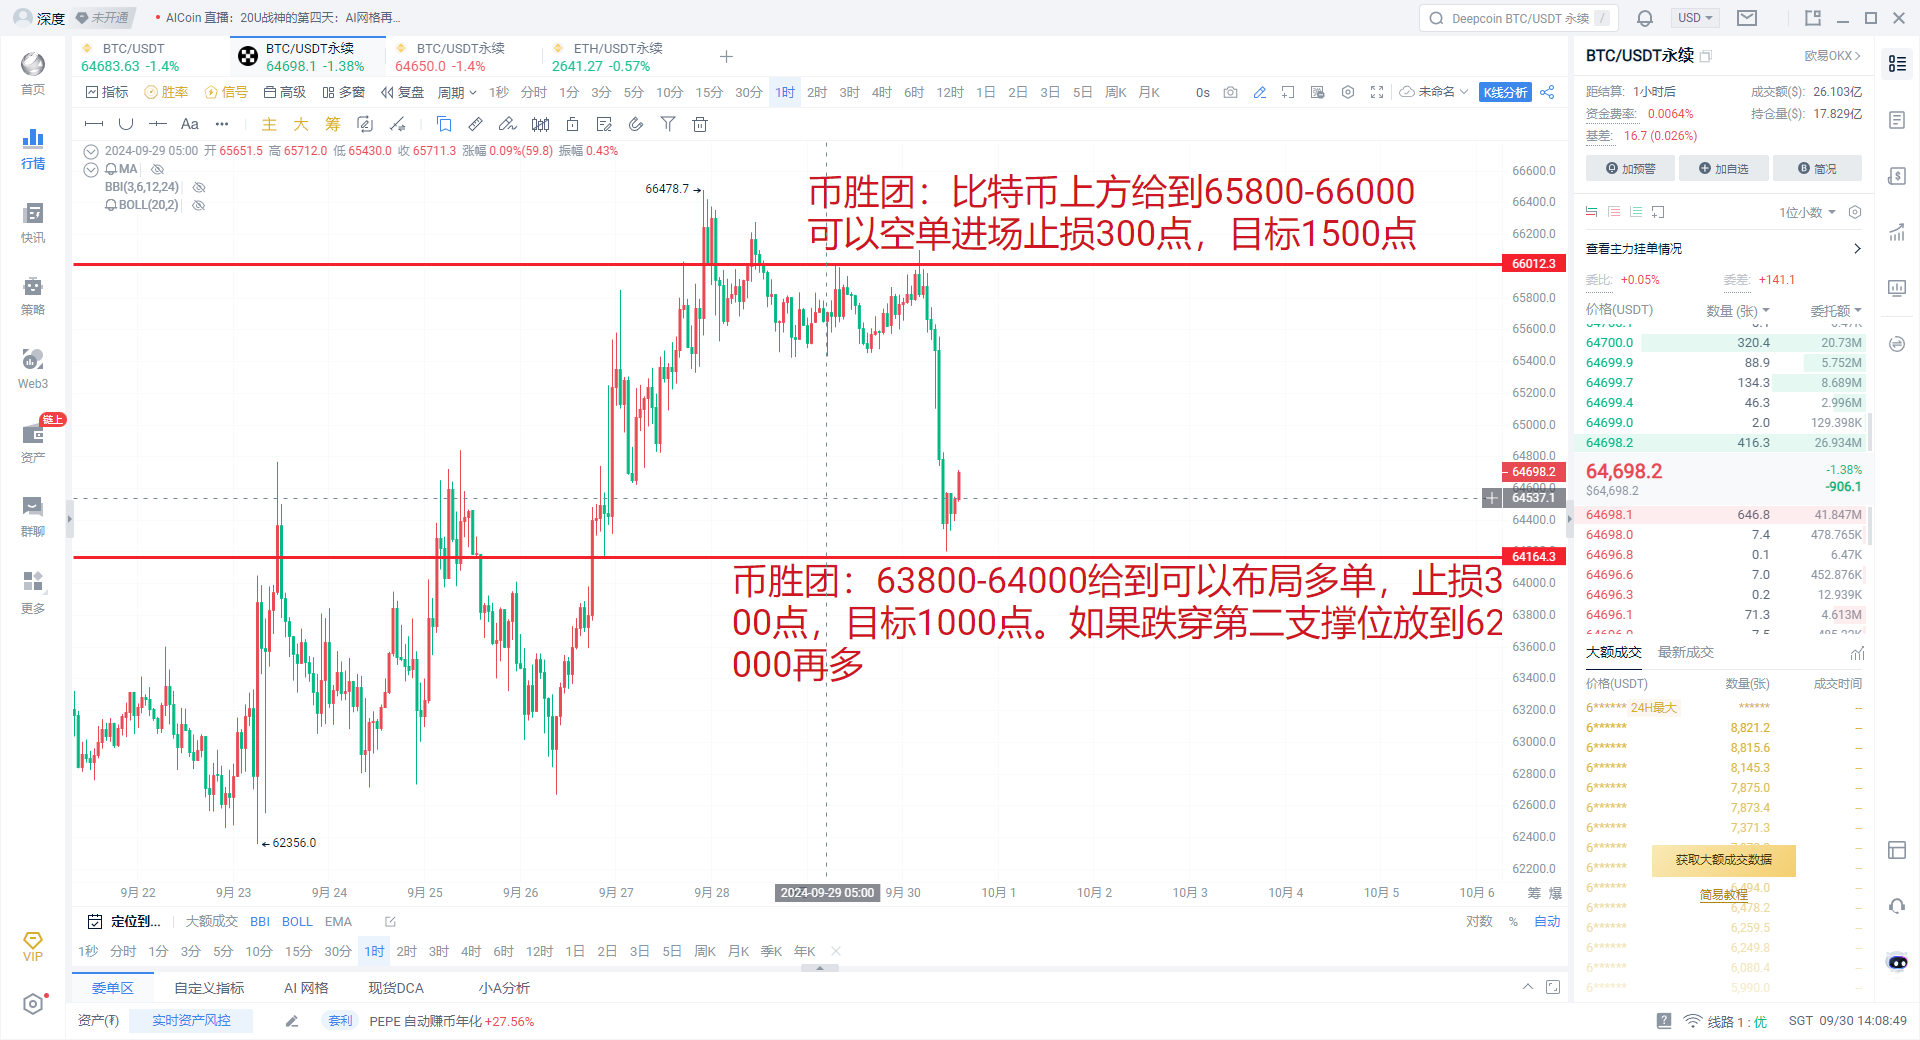
As of today, the price of Bitcoin is $64,500, down about 1.92% in the past 24 hours. Although there has been a short-term pullback, from a technical and market sentiment perspective, Bitcoin's trend may still have upward potential in the coming weeks. Bitcoin is fluctuating between $64,196 and $66,000, with recent prices testing the support level around $64,190. Technical analysis indicates that if this support level can hold, Bitcoin may rebound in the short term, with a target price potentially rising above $66,000. Recent market trends show that since the beginning of the year, Bitcoin has been on an overall upward trend, with higher highs and gradually rising lows, indicating that the market is generally in an uptrend. However, the current volatility can be seen as a correction in the upward process. Technical charts suggest that Bitcoin may still have further pullbacks in the short term, reaching the range of $51,000 to $54,000.
Macroeconomic environment: Global macroeconomic factors, especially the Federal Reserve's interest rate cut policy, have a certain driving effect on Bitcoin's price. The interest rate cut announced by the Federal Reserve in early September helped Bitcoin's price briefly rise above $60,000, and this policy may continue to inject optimism into the market in the coming months.
Technical indicators: Bitcoin's technical analysis indicators, such as the Moving Average (MA), show that Bitcoin is currently facing some resistance in the short term. The 7-day and 25-day moving averages are close together, indicating that the market is consolidating. If the price breaks through these two moving averages, it may trigger a new round of upward momentum.
Historical data: According to Bitcoin's past monthly performance data, October is usually one of the best-performing months for Bitcoin. Historical data shows that the average increase for Bitcoin in October is 22.9%, which is expected to form a breakthrough in the mid-term market trend. Resistance level: $66,000 is the current first resistance level. If it reaches this position, a short position can be considered, with a stop loss of 300 points. If it breaks this level, a long position can be pursued, and breaking this price level is expected to push the price further up to $67,500 or higher. Support level: If it breaks down, pay attention to the range of $63,800 to $64,000. If it reaches this range, a long position can be set up, with a stop loss of 300 points and a target of 1,000 points. The second support level is $62,000, which is the short-term extreme support. If it reaches this level, a long position can also be entered.
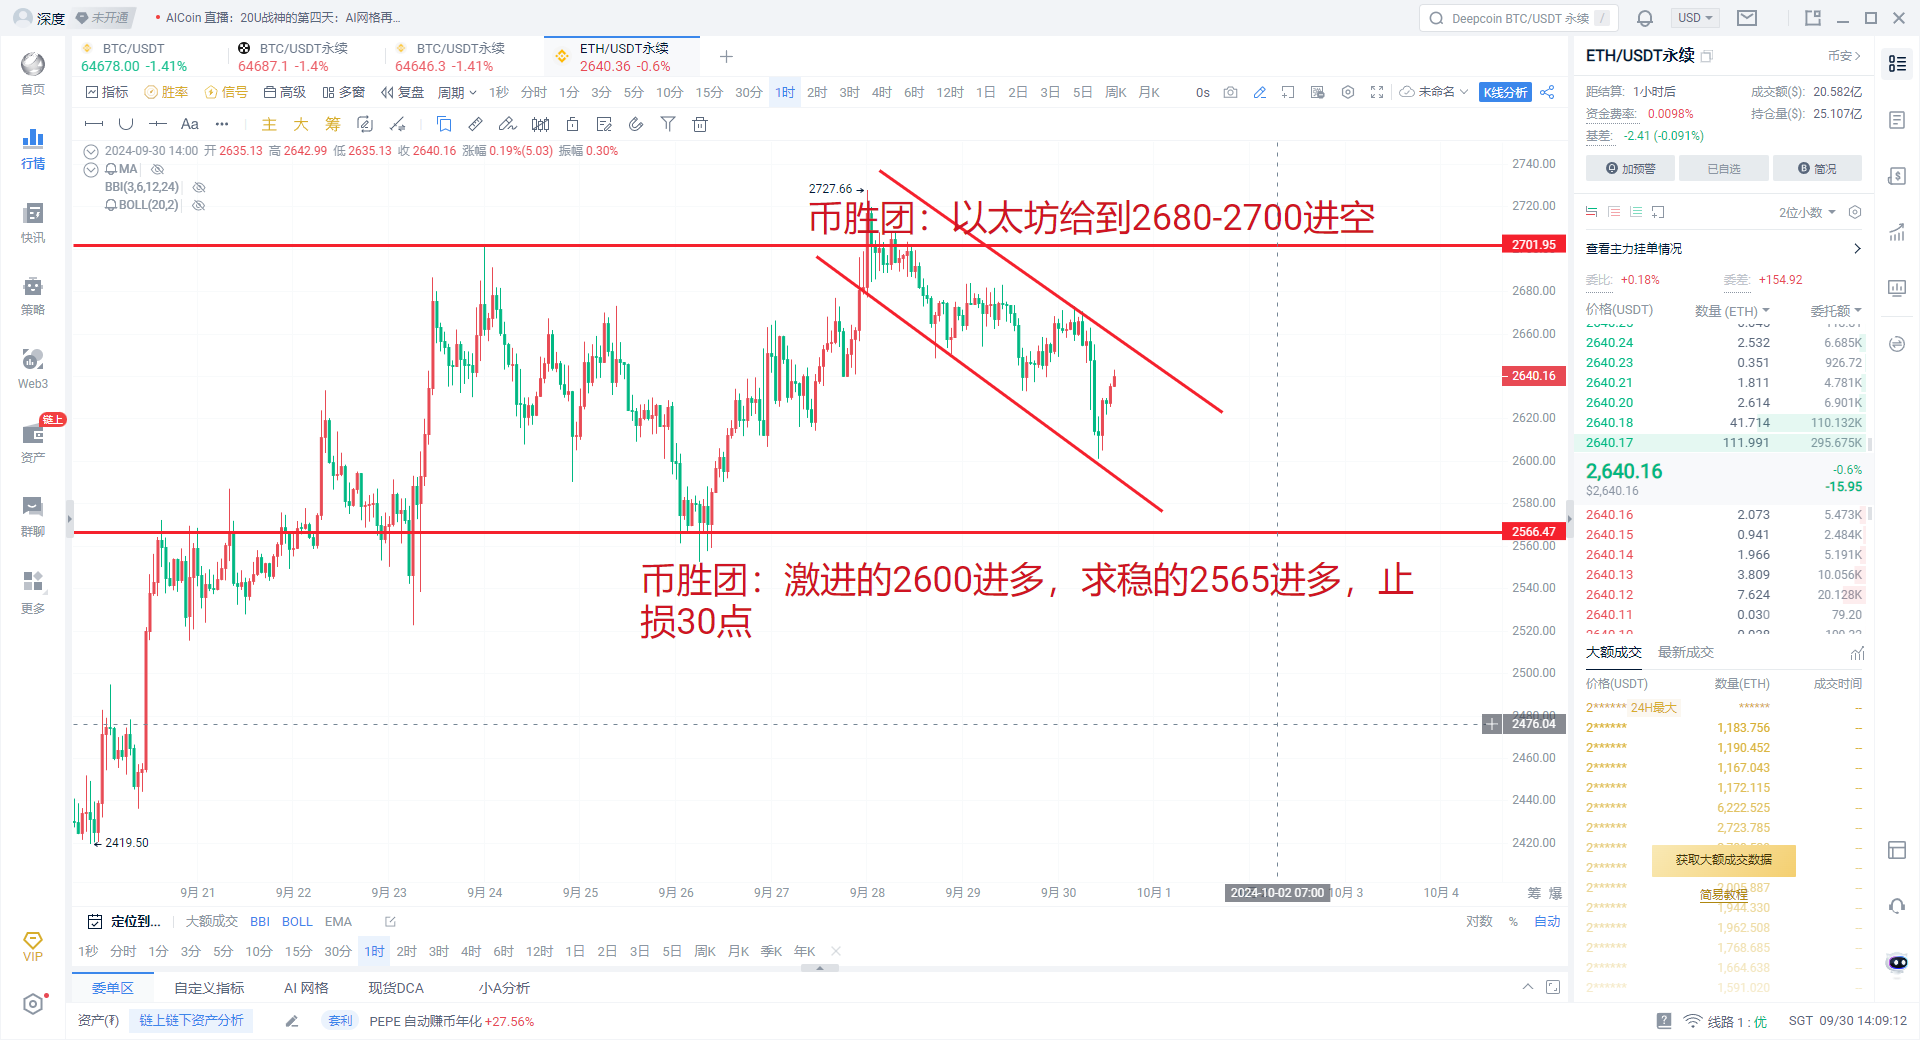
Today's price of Ethereum (ETH) is $2,628, down about 1.10% in the past 24 hours. Despite a slight pullback, Ethereum is still in an overall upward trend. In the past week, Ethereum's price has increased by 1.83%, and in the past month, it has risen by 4.05%. Market performance and technical analysis: Current price range: Ethereum's current price fluctuates between $2,623 and $2,650, and is testing the key support level of $2,623. If the price cannot stabilize above this support level, it may further decline in the short term, testing the support level around $2,550. Resistance level: $2,680 to $2,700 is the current upward resistance level. Breaking this resistance may push the price further up. Technical indicators: According to technical analysis, the current technical signals are neutral. Multiple indicators show that the market may be consolidating, waiting for further confirmation of a breakout or pullback. In the short term, Ethereum's price performance depends on whether it can break through the resistance level and continue to rise. The support and resistance levels above and below are dense. Compared to Bitcoin, Ethereum's trend is much more stable, so when operating, the range we choose for trading should not be too large. If it breaks down, pay attention to $2,680 to $2,700 for a short position, with a stop loss of 30 points and a target of 60 points to start reducing positions. For the lower level, pay attention to $2,565 for a long position, with a target of $2,650 and a stop loss of 20 points.

This article is independently written by the Coin Victory Group. Friends who need current price strategies and solutions can find the Coin Victory Group online. Recently, the market has been mainly characterized by fluctuations, accompanied by intermittent spikes. Therefore, when making trades, remember to control your take profit and stop loss well. In the future, when facing major market data, the Coin Victory Group will also organize live broadcasts across the internet. Friends who need to watch can find the Coin Victory Group online and contact me for the link later.

Mainly focused on spot and contract trading for BTC/ETH/ETC/LTC/EOS/BSV/ATOM/XRP/BCH/LINK/TRX/DOT, specializing in strategies such as mobile locking and trading around high and low support and resistance levels, short-term swing trading, medium to long-term trend trading, daily extreme pullbacks, weekly K-top predictions, and monthly head predictions.
免责声明:本文章仅代表作者个人观点,不代表本平台的立场和观点。本文章仅供信息分享,不构成对任何人的任何投资建议。用户与作者之间的任何争议,与本平台无关。如网页中刊载的文章或图片涉及侵权,请提供相关的权利证明和身份证明发送邮件到support@aicoin.com,本平台相关工作人员将会进行核查。


