
The Fed's sudden heavy news! Traders bet that the Fed will cut interest rates by 50 basis points again in November. The current US inflation rate continues to cool, approaching the Fed's 2% target level. As a result, traders are betting that the Fed is likely to make a second significant 50 basis point rate cut in November. Currently, the probability of a 50 basis point rate cut in November reflected in interest rate futures contracts is 54%.

It is worth noting that while the expectation of the Fed's "further 50 basis point rate cut" is heating up, the European Central Bank may also embark on aggressive rate cuts. Phil Odonagho, an economist at Deutsche Bank, stated in a recent report that the European Central Bank may accelerate rate cuts, with a possible 50 basis point cut in December.
I also reminded yesterday that the yen staged a "big reversal", with the exchange rate against the US dollar soaring significantly, and the Nikkei 225 index futures once falling by over 2000 points, triggering a circuit breaker. The yen arbitrage trade is not over yet, and US money market funds recorded net outflows for the first time in 9 weeks. So, while there are opportunities, it is also necessary to guard against risks.
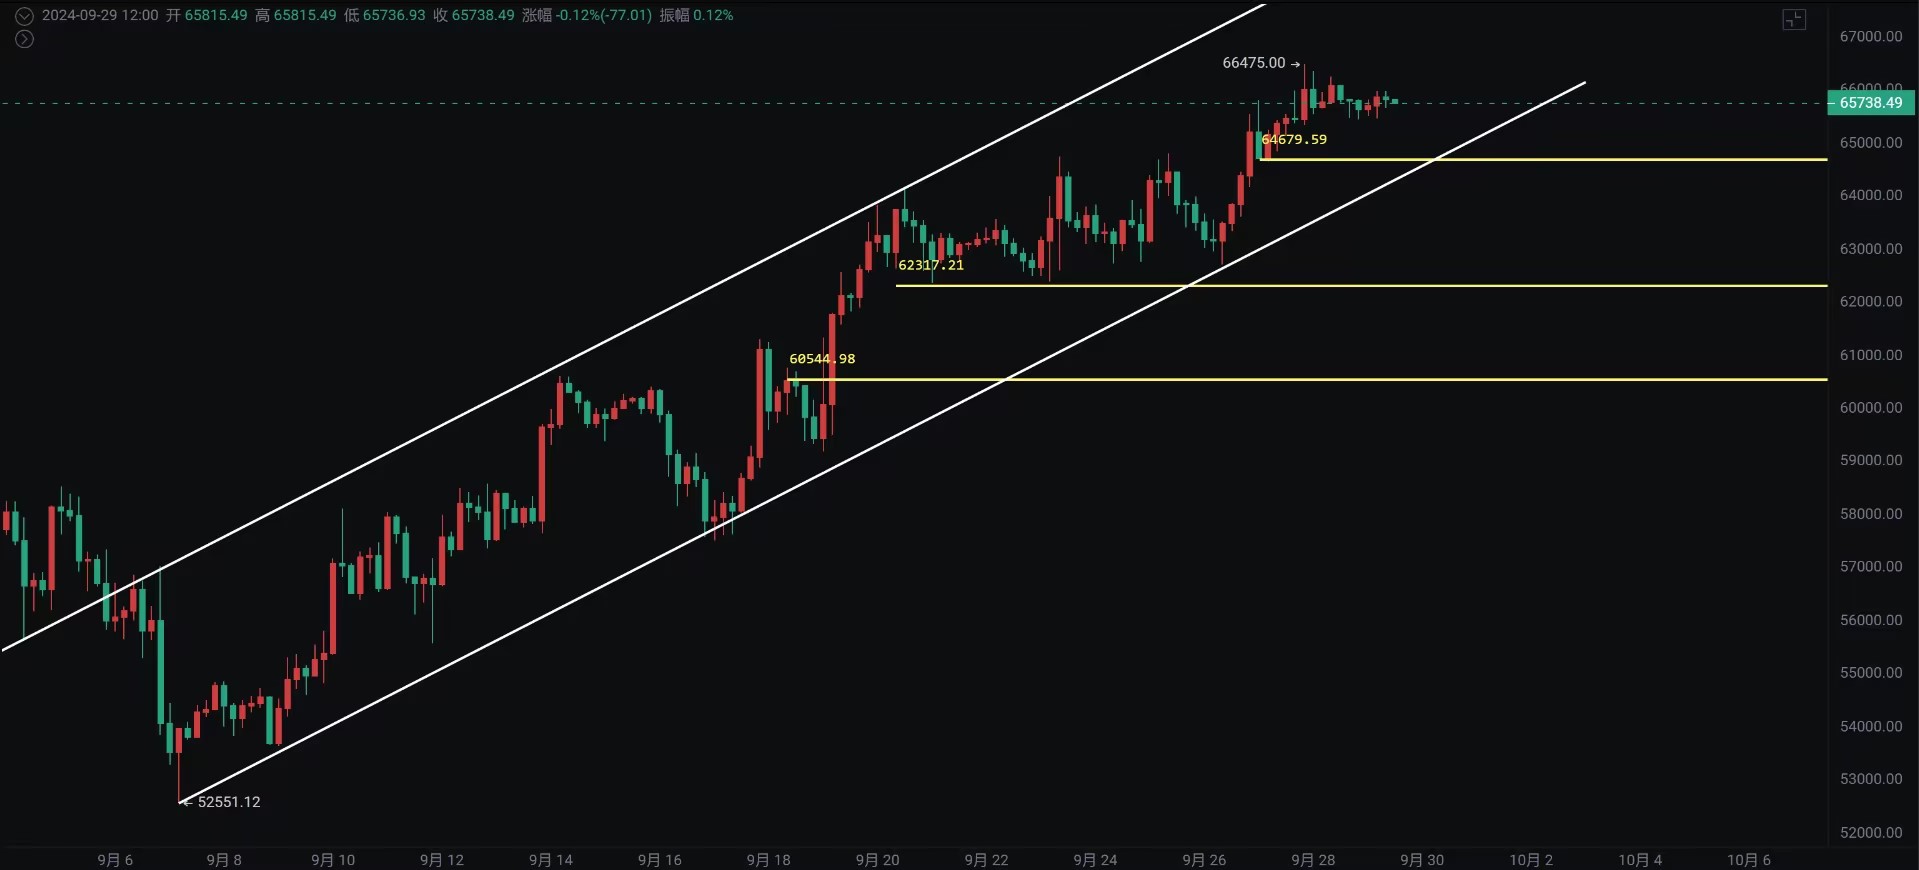
Bitcoin
Bitcoin formed a doji yesterday, and it is highly likely to do so today as well. The trend here is somewhat similar to the US stock indexes, with the Dow Jones hitting a new high last Friday and then pulling back, and the daily charts of the S&P 500 and Nasdaq showing a correction. If Bitcoin breaks through the weekly candlestick at 64200, and the Dow and S&P 500 break through the new highs without falling back, the risk is relatively small.
The weekly chart is about to take shape, and maintaining a price above 64200 to 65000 would be an effective breakthrough. After the daily chart breaks through 65000, despite the obvious bullish divergence in the smaller timeframes of 4 hours and 12 hours, the current price pullback is relatively small. Pay attention to whether it will transmit to a bearish divergence on the daily chart, so it is advisable to gradually reduce positions on the way up and buy back on the pullback.
The 4-hour chart is still oscillating and rebounding within the upward channel, but it is entering the heavy pressure zone of 66600 to 68500. The trend is relatively grinding. Those with low holding prices can continue to hold, and the precaution is to reduce positions if the 4-hour channel breaks down.
Support:
Resistance:
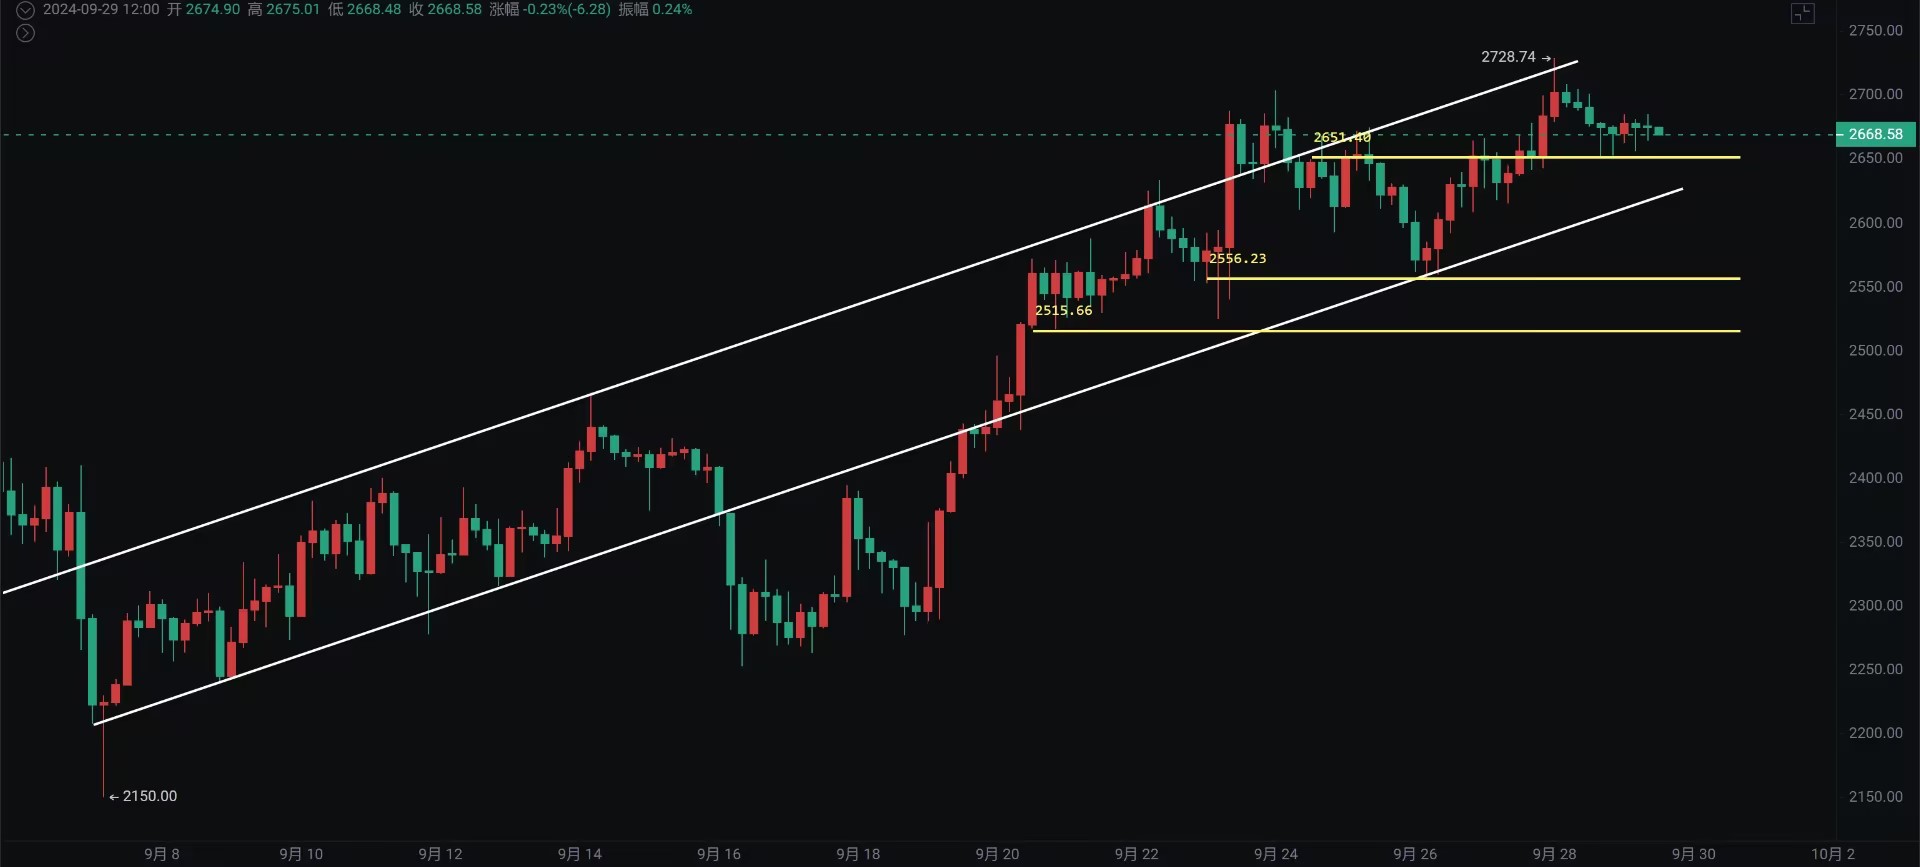
Ethereum
Still looking at the weekly rebound level, paying attention to the 2800 resistance. Although the daily chart pulled back after hitting 2728 and fell back to the previous 2704, the short-term 4-hour chart also shows a bearish divergence. If it still cannot break through 2800, the probability of a pullback is high, and the retracement of altcoins will be even greater at that time.
Support:
Resistance:
If you like my views, please like, comment, and share. Let's navigate the bull and bear markets together!!!
The article is time-sensitive and is for reference only, with real-time updates.
Focusing on candlestick technical research, win-win global investment opportunities. WeChat public account: 交易公子扶苏

免责声明:本文章仅代表作者个人观点,不代表本平台的立场和观点。本文章仅供信息分享,不构成对任何人的任何投资建议。用户与作者之间的任何争议,与本平台无关。如网页中刊载的文章或图片涉及侵权,请提供相关的权利证明和身份证明发送邮件到support@aicoin.com,本平台相关工作人员将会进行核查。


