Spreading the Way of Trading, Enjoying a Wise Life.
Many currencies have formed an N-shaped structure in this round. After a wave of market downturn, they began to rebound at important support levels. After rebounding to the previous resistance level, they fell again without reaching the previous low. At this point, the price once again rose, encountering an important resistance level and breaking through. In theory, we can consider entering the market during the pullback, but some currencies may choose to provide entry opportunities during the pullback, while others may not pull back and instead continue to rise. Therefore, the decision to wait for a pullback or enter directly depends on individual choices.

Analyzing this token, PEPE, it also follows a similar N-shaped structure. After reaching the 657 level, it experienced an upward rebound, reaching the neckline at 800, then falling back down, and rebounding multiple times to the neckline during the subsequent upward movement.
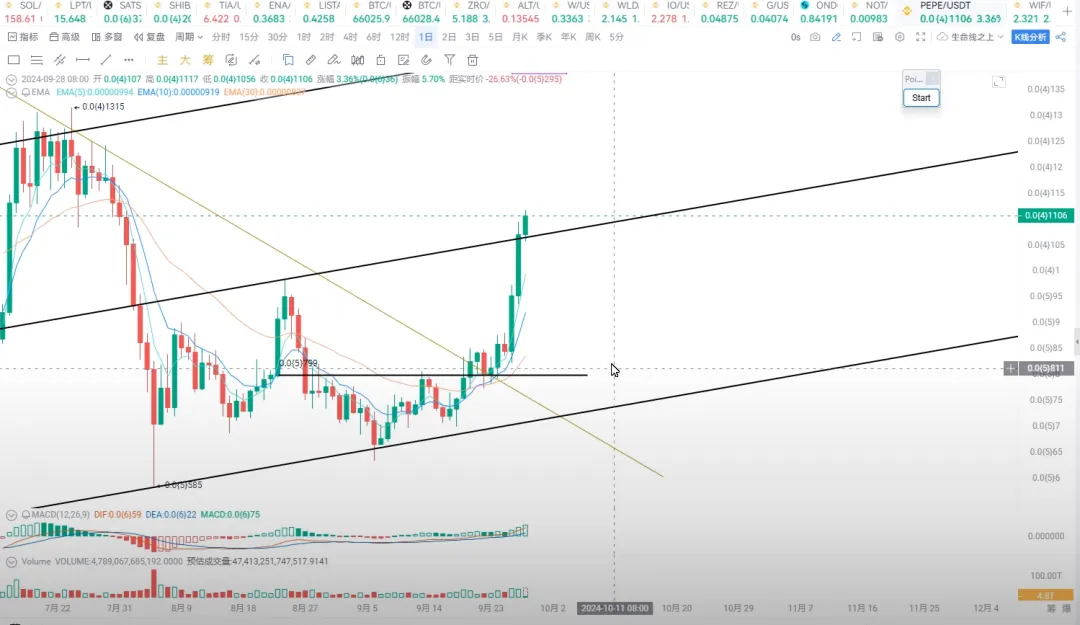
So, PEPE is relatively friendly in the sense that after breaking through the neckline of the N-shaped structure, it retraced to the neckline three to four times, making it fortunate for those who entered the market at this point. Subsequently, the price rose from 800 to 1110 in nearly three days, achieving a 30% increase.
Therefore, this situation can be considered a relatively fortunate method of capturing market trends during the trading process. Looking at PEPE as a whole, after breaking through the neckline, it also simultaneously broke through the downtrend line. This downtrend line started from the high point on May 27 and extended all the way to the low point, with a total decline of nearly 70%, close to 70%. Afterward, it rose strongly, and today marks the third day of the upward trend. From the bottom, the price has already reached the first channel, and after a brief consolidation within this channel, it is expected to continue to rise. So, what is my opinion?
Since this token has broken into a new channel, it is highly likely to open a new upward channel. The upper boundary of this upward channel is around 1425. Overall, if the price can reach the expected target, the overall increase from the neckline to the high point will be around 70% to 80%. It all depends on whether the market provides the opportunity, and if it does, we should be grateful for it.
In our VIP spot class, we have also emphasized the trend of PEPE and the trading opportunities it presents. As for PEPE, our entry point coincides with the neckline position. If we review the previous trading plan for PEPE, our entry point was at 0.00000795, with a stop loss set at 770, based on the closing price. So, did this token retrace to that position? Let's zoom in. The lowest retracement position was 775, the second time was 783, and the third time was 791.

Therefore, PEPE has given us three entry opportunities, and even if it touched 770, as long as the closing price did not fall below it, we could continue to hold.
So, from the entry point to the current position, the overall profit rate for this token has reached 39%. Congratulations to those who followed. As for the future trend of PEPE, when it reaches the upper boundary of the expansion channel, equivalent to two channels, my opinion is to definitely take partial profits or exit at that point, as there is a high probability of a downward correction. Currently, holding is still the main strategy, and if you want to add positions, you can only do so at the lower boundary of the channel, around 1000.

Let's take a look at the price trend of BTC, which has now reached $66,000. This position is crucial, as it represents a resistance level from the previous downtrend line. Whether this position can form an effective breakthrough will determine whether BTC will start a new trend or begin a turning point for a retracement.
We have observed that the previous two times saw the formation of a top divergence and a double top structure. Will the price of BTC form a double top this time?
Currently, it is consolidating around 66,000, with a support level at $64,777. From the MACD indicator, it is gradually crossing above the zero axis, indicating a gradual depletion of momentum on the 6-hour timeframe. We can see that during the upward movement, the MACD indicator's energy column is not as high or as long as before, indicating a slowdown in momentum. Therefore, there is a possibility of an hourly-level retracement in the price of BTC. The retracements over the past two days have been very limited, remaining at high levels. At the same time, looking at the weekly chart, we should not forget that it has formed a golden cross between the 5-week and 10-week lines.
If it breaks through 66,000, or if the MACD indicator forms a golden cross at this point, it signifies the establishment of a new trend. At this time, we should seize the opportunity to add positions, rather than shorting. When a trend comes, we should remember not to limit the extent of the upward movement. Of course, if it forms a bearish candlestick pattern at this position or does not form a golden cross, it means the start of a correction.
免责声明:本文章仅代表作者个人观点,不代表本平台的立场和观点。本文章仅供信息分享,不构成对任何人的任何投资建议。用户与作者之间的任何争议,与本平台无关。如网页中刊载的文章或图片涉及侵权,请提供相关的权利证明和身份证明发送邮件到support@aicoin.com,本平台相关工作人员将会进行核查。


