The 924 new policy was officially announced, the 926 high-level meeting set the tone, and the central bank announced a reserve requirement ratio cut in advance on 927: Starting from September 27, 2024, the reserve requirement ratio for financial institutions will be reduced by 0.5 percentage points. This measure is expected to release approximately 1 trillion yuan of long-term liquidity, with 1 trillion reinforcements continuously being delivered…
The Shanghai Composite Index, Shenzhen Component Index, and ChiNext Index fell for three months and four days before rebounding to yesterday's closing price. The exchange also experienced a crash, for which the Shanghai Stock Exchange apologized. However, rumors suggest that Citic Securities had a short position of 80,000 contracts, resulting in a loss of nearly 8 billion yuan after a 325-point drop in four days. Just sit back and enjoy the show. The central bank introduced policies to support stock purchases, with an initial 500 billion and possibly two or three more phases…
Bitcoin In three days, the monthly line has basically returned to the opening and closing price line near 67,000 in the past six months. If the new moon opens lower and retraces to the range of 60,600 to 60,230, it will be the last opportunity to get on board. I predict that the trend will remain in a state of oscillation around the weekly BOLL midline before rising, either retracing to 60,600 to 62,300 and then rising directly to 80,000 to 100,000.
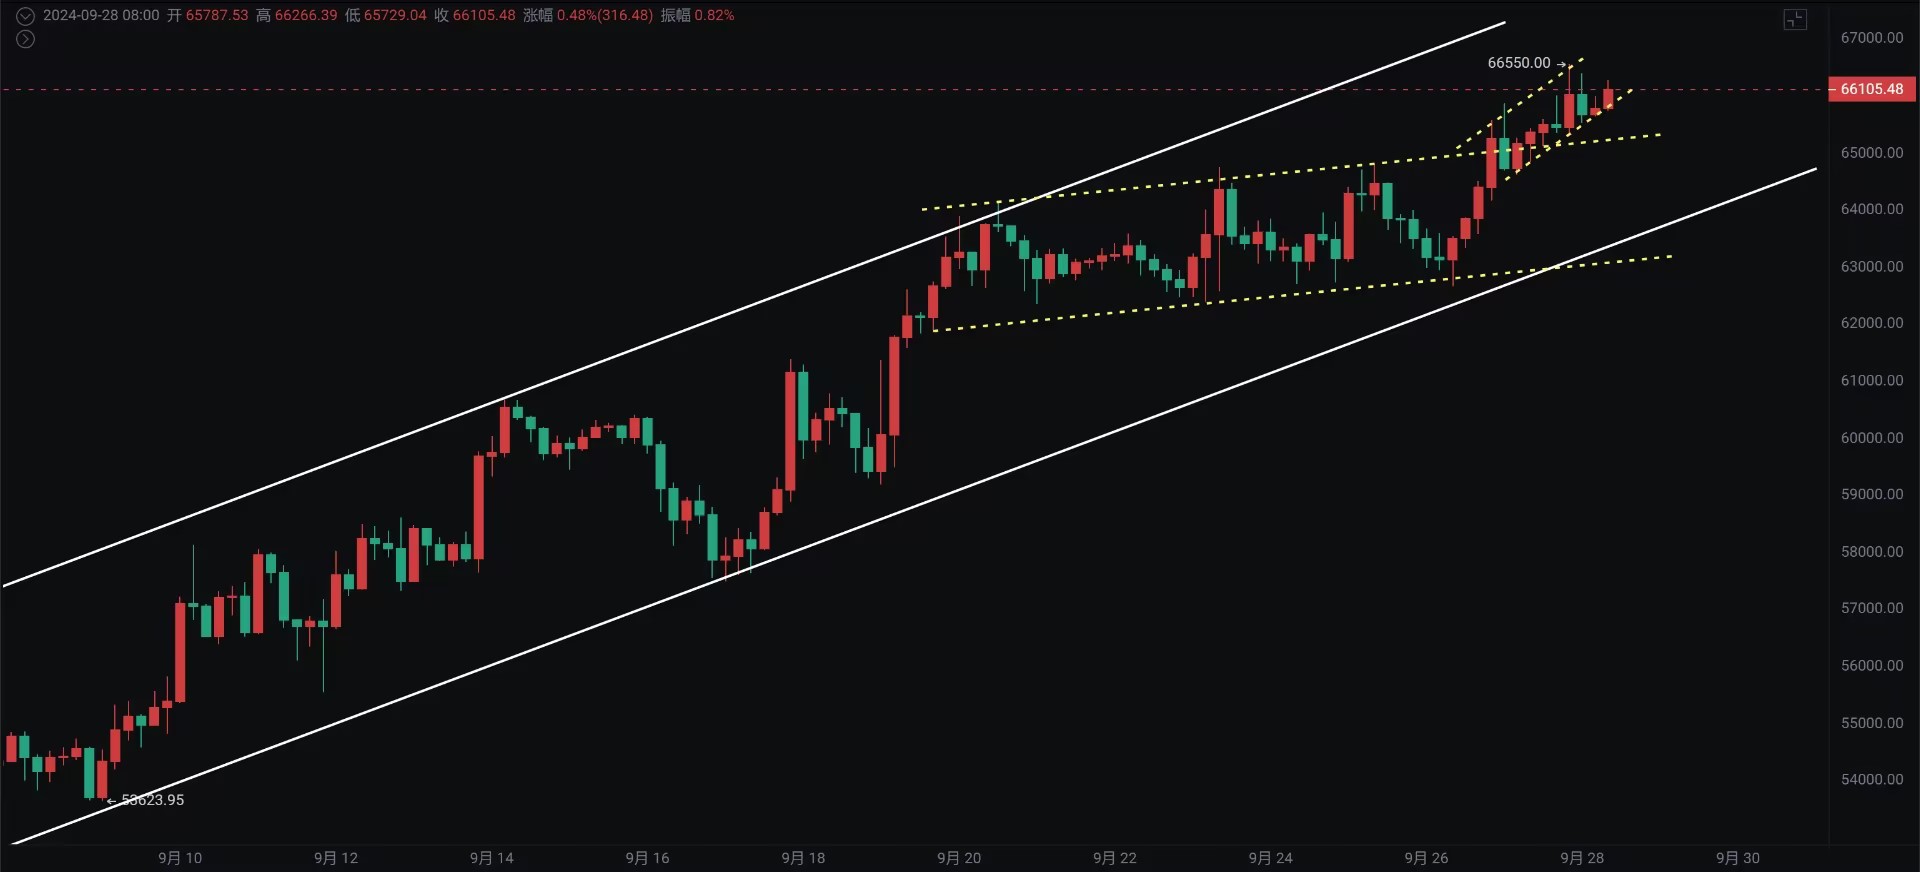
BTC rose to 66,500 in the evening and then fell back. In the morning, it continued to rebound, and the daily trend is still upward despite the short-term pressure. The current market has entered the range of 66,200 to 70,400, which is characterized by two consecutive bearish days followed by a bullish day from June 11th to 13th. The trend will become very turbulent. The next resistance is 67,000, and breaking through it will lead to 68,500, while falling below 67,000 will result in a retracement.
The four-hour chart has been consistently within the upward channel, so the trend remains bullish. After breaking through 64,800 on the hourly chart, it continues to accelerate within the upward channel. If this channel is broken, it will be necessary to reduce positions.
Support: Resistance:
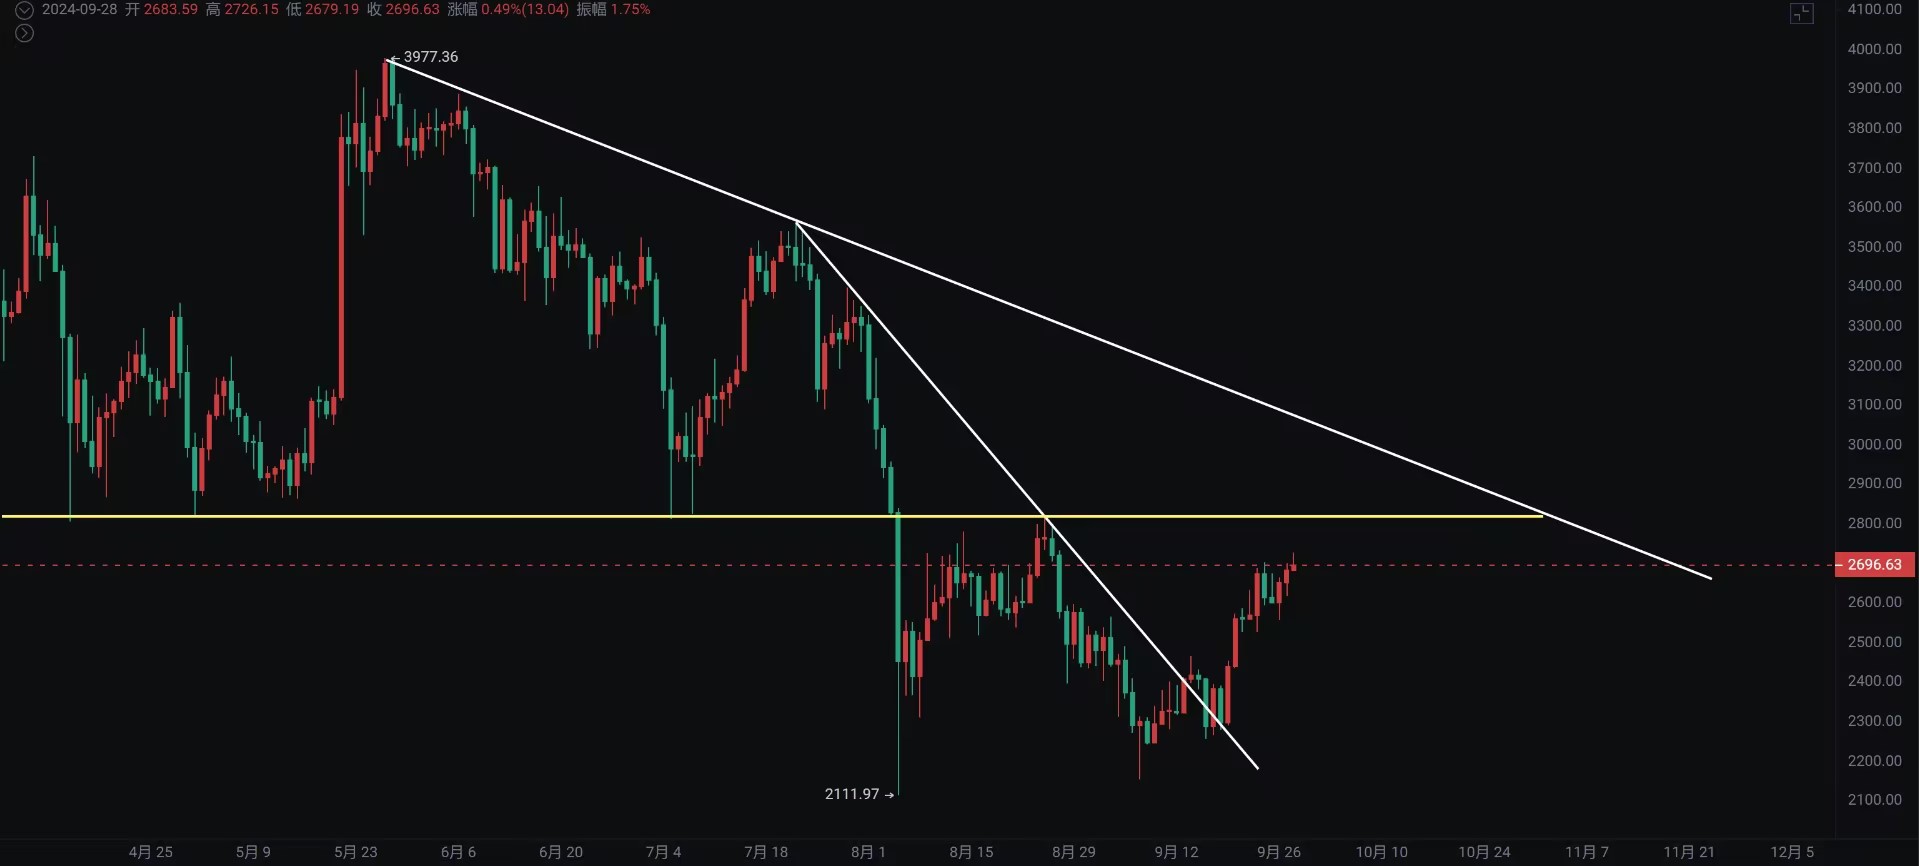
Ethereum Ethereum reached a high of 2,726, which is less than 100 points away from the weekly resistance of 2,800. The daily upward trend has not been broken, and the probability of a breakthrough has increased, but it can only be a short-term retracement entry. The four-hour support has moved up to 2,600. The ETH/BTC exchange rate retraced to around 0.04, close to the bottom support, and continued attention to the probability of a rebound at this level. At the same time, be cautious in case of further decline. If Ethereum and other altcoins continue to fall, it will be necessary to reduce positions.
Support: Resistance:
If you like my views, please like, comment, and share. Let's navigate the bull and bear markets together!!!
The article is time-sensitive and is for reference only, with real-time updates.
Focusing on candlestick technical analysis, for a win-win global investment opportunities, follow the public account: Trading Master Fusu

免责声明:本文章仅代表作者个人观点,不代表本平台的立场和观点。本文章仅供信息分享,不构成对任何人的任何投资建议。用户与作者之间的任何争议,与本平台无关。如网页中刊载的文章或图片涉及侵权,请提供相关的权利证明和身份证明发送邮件到support@aicoin.com,本平台相关工作人员将会进行核查。