Daily Sharing
In the recent month's market, the 4-hour chart of Bitcoin has experienced significant fluctuations. After reaching 65,000 on August 26, it underwent a 4-hour level pullback. At that time, the personal prediction was that if the rebound did not exceed 65,500, there would be a 4-hour level pullback to around 55,000 or below. Ultimately, the pullback stabilized near 52,550.
Subsequently, starting from 52,550 on September 7, a 4-hour level rebound began. Initially, the prediction was for a rebound to the 60,600-62,000 range. After breaking through 62,000, the target was to adjust to 65,000, and it was believed that if it broke through 65,000, it might go to around 66,500. The overall rhythm has not changed significantly, but there were challenges in judging whether the 4-hour level rebound had ended prematurely.
Sometimes the market operates in this manner. It may seem like the structure is almost complete, and there is a demand for a pullback in the indicators, but after a slight pullback, it continues to rebound, extending the original upward movement. In this process, the market is ahead of us, and many times we can only passively follow.
Currently, it is necessary to continue observing whether the 4-hour level rebound has ended, as there is a demand for a 4-hour pullback, and there is already a potential bearish divergence internally. However, whether it can successfully emerge depends on the market itself.
In yesterday's article, a small promotion was made, announcing that the community has opened a trading training course consisting of eight sessions, which will be explained in live broadcasts in the evening and can be replayed. Those interested in signing up can leave a comment below or message me privately. The benefit of signing up is to receive a one-month membership group experience.

BTC Medium and Long Term
Weekly Chart:
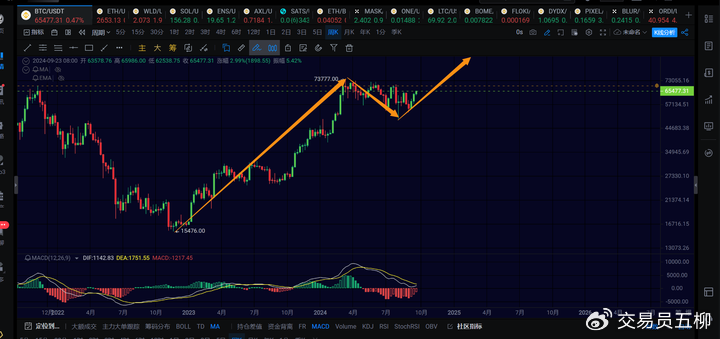
Recently, some readers asked why the direction of the weekly chart at the end of your article is still downward. In fact, this is just a simple notation. From a rigorous perspective, the direction of the weekly chart cannot be fully determined as upward at the moment, as the conditions for upward movement are not yet sufficient. However, in actual market conditions, it is highly probable that a weekly upward movement has been running from 49,000, indicating that the weekly level is unlikely to fall below 49,000, although it has not been strictly confirmed yet.
The rise from 15,476 to 73,777 is a weekly level upward movement, lasting 478 days. The decline from 73,777 to 49,000 is a weekly level pullback, lasting 144 days. If the upward movement indeed starts from 49,000, it is likely that we will see a target of 95,000 or even above 100,000. However, it is not yet fully confirmed that 49,000 is the starting point of the weekly level upward movement.
Daily Chart:
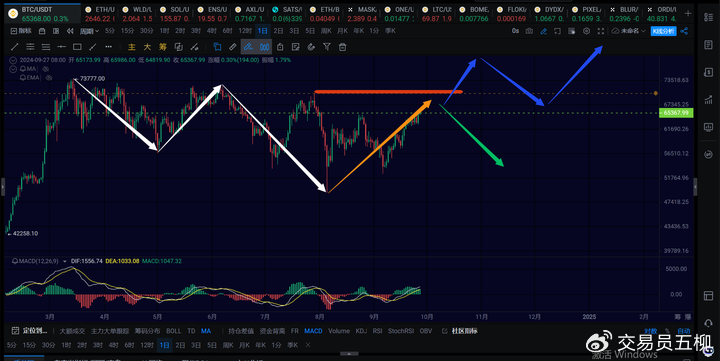
On the daily level, the white arrows on the left indicate that Bitcoin has completed three daily level structures of down, up, and down, suggesting that the weekly level decline from 73,777 may end near 49,000, but this is not yet fully confirmed.
The yellow arrow on the chart indicates the ongoing daily level rebound from 49,000 to around 66,000. If this daily level rebound continues to extend upwards and breaks through 70,079, then it can be confirmed that this is likely a weekly level rebound. It is almost certain that the third weekly level upward movement from 49,000 to around 90,000 or even above 100,000 is possible. As shown by the blue arrow on the chart.
However, if the current daily level rebound does not exceed 70,000, then we need to pay attention to the strength of the next daily level pullback, which may retest 58,000 or lower, as indicated by the green arrow on the chart.
4-Hour Chart:
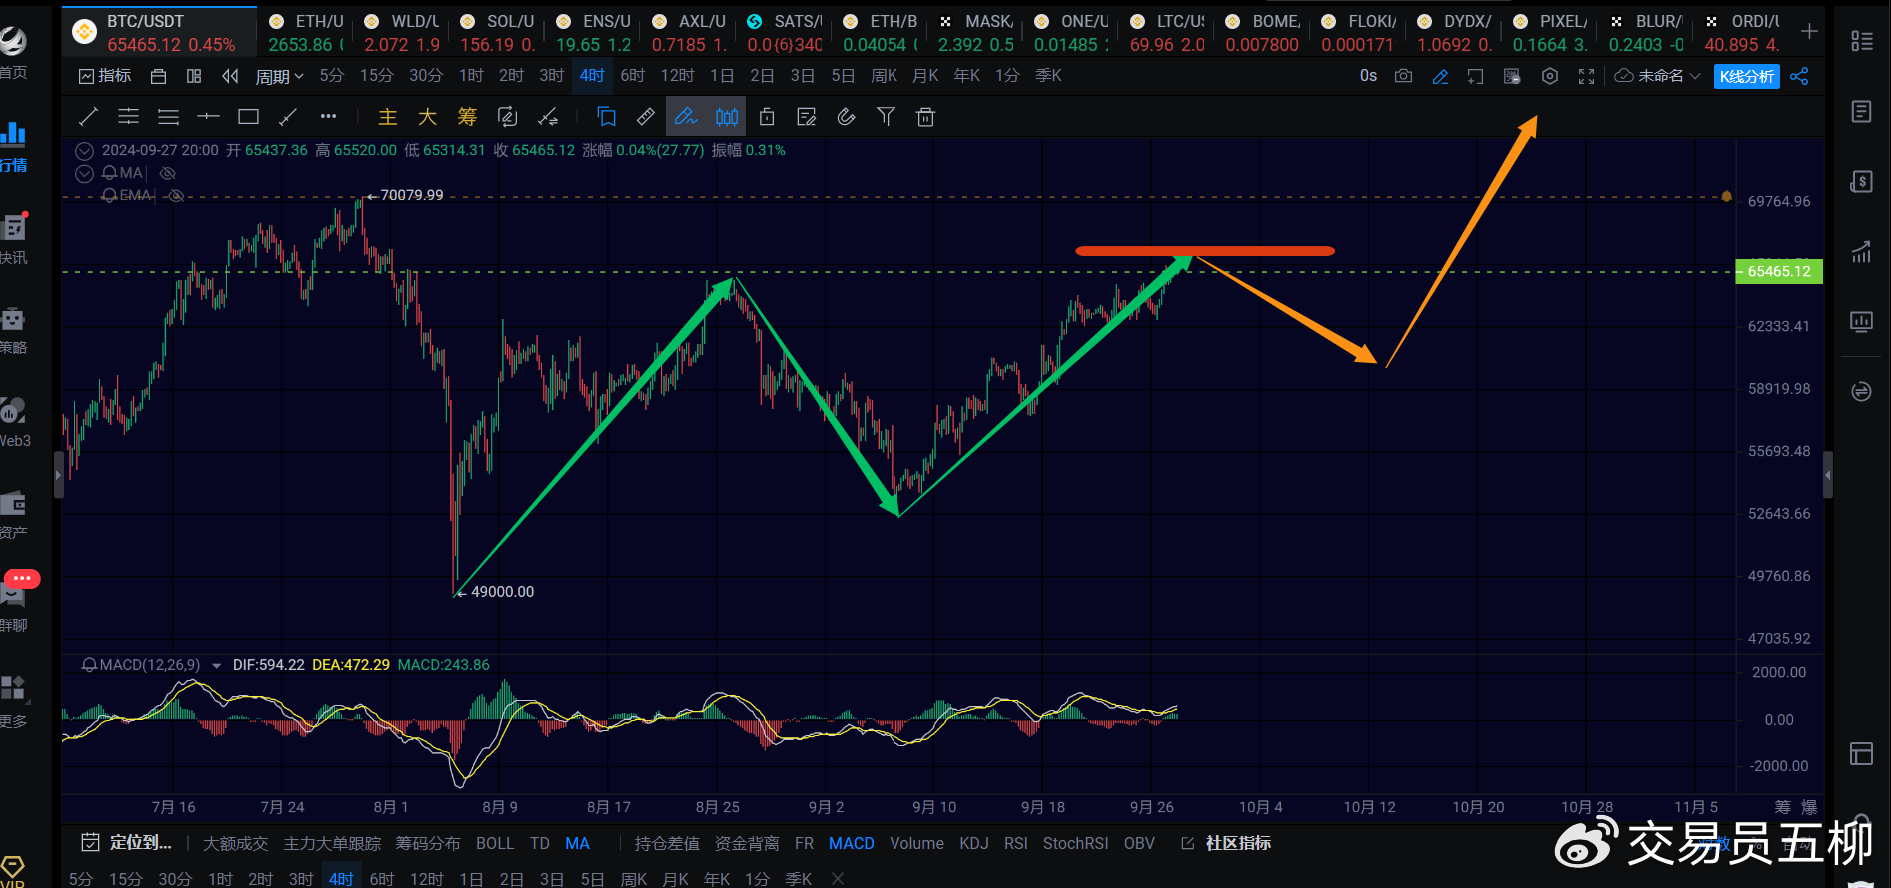
At the 4-hour level, the third 4-hour level rebound is currently in progress, and this is also the third 4-hour level rebound within the daily level rebound. The first 4-hour rebound was from 49,000 to 65,000, the second 4-hour pullback was from 65,000 to 52,550, and the third 4-hour level rebound is from 52,550 to the current 65,986.
It still needs further observation to determine whether the third 4-hour level rebound has ended. If this 4-hour rebound fails to break through 66,500, then a short-term 4-hour level pullback may be expected, with attention to 62,000 in the pullback, followed by a continued upward movement after the pullback. If the 4-hour level rebound continues to extend upwards and breaks through 66,500, there may still be room for further upward movement, and the extension of the 4-hour rebound should be continued.
BTC Short Term
Due to the rapid changes in the market, the article can only make predictions based on the market conditions at the time of publication. Short-term players should pay attention to the latest market changes and use the information as a reference only.
1-Hour Chart:
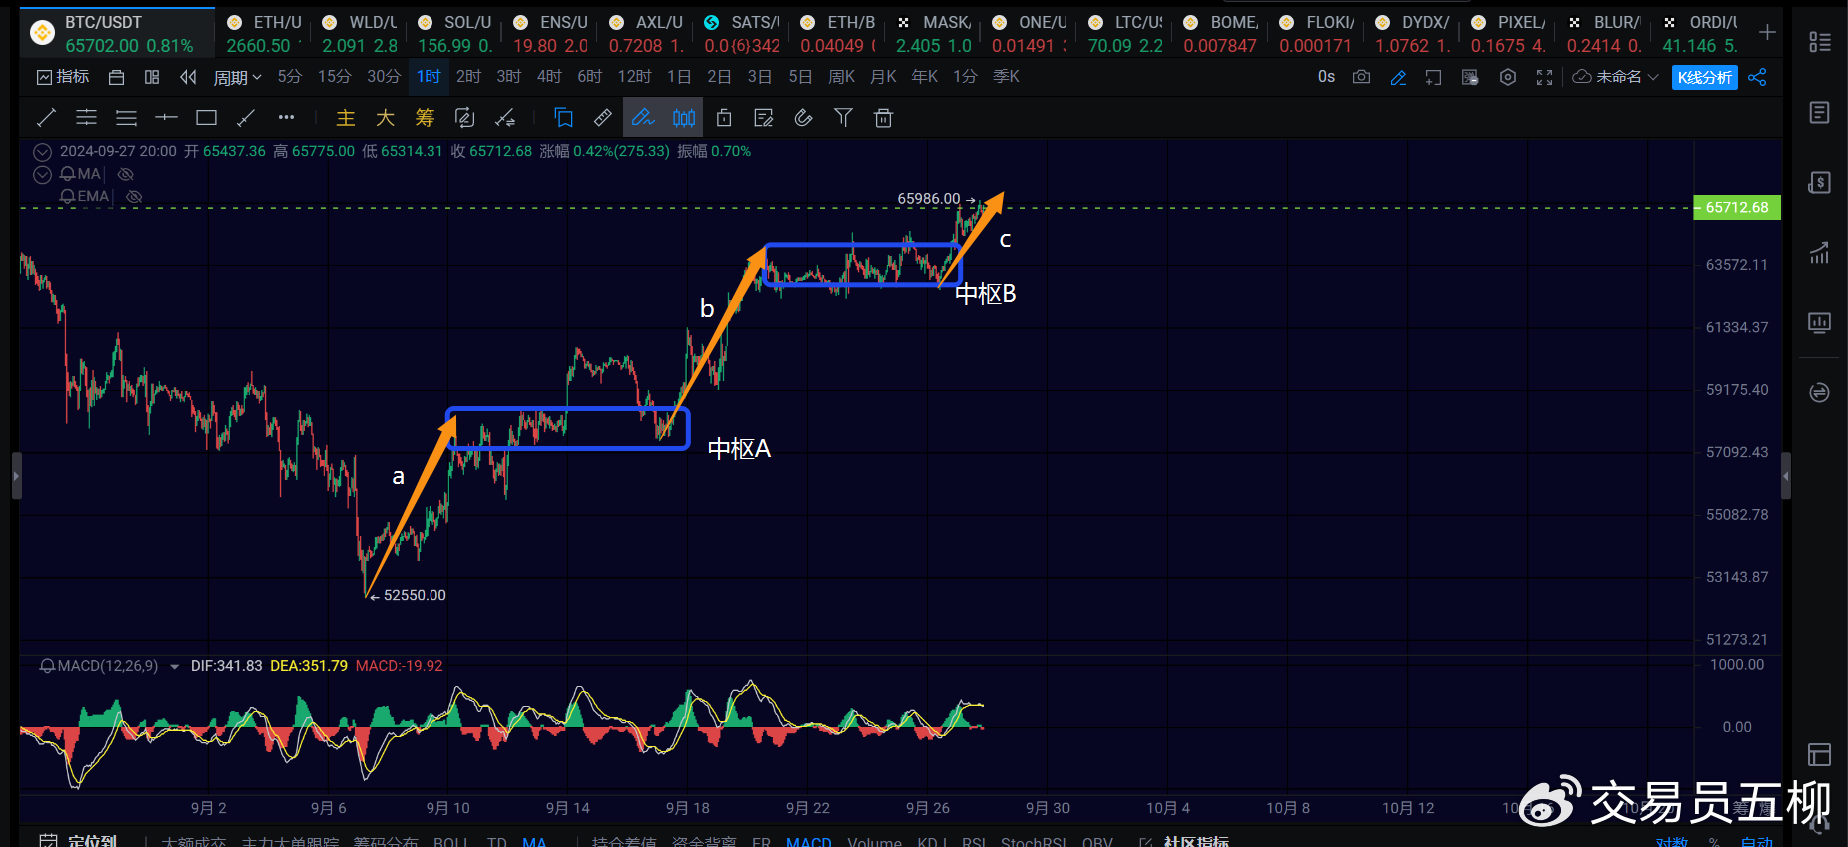
The internal structure of the 4-hour level rebound from 52,550, as shown in the chart, has formed an aAbBc structure, indicating an upward trend with two pivots. The current c segment is potentially in a bearish divergence, meaning that a 4-hour level pullback can occur at any time, as the internal structure is complete and has also diverged. Unless this 1-hour level rebound can directly surge to 70,000, it is likely that a 4-hour level pullback will occur.
To determine whether a 4-hour level pullback is likely, we can pay attention to the 64,000 position of the pivot. If it falls below this level again, it is considered that a 4-hour level pullback is likely. If it does not fall below, the pullback will be limited to the 15-minute or 1-hour level at most.
15-Minute Chart:
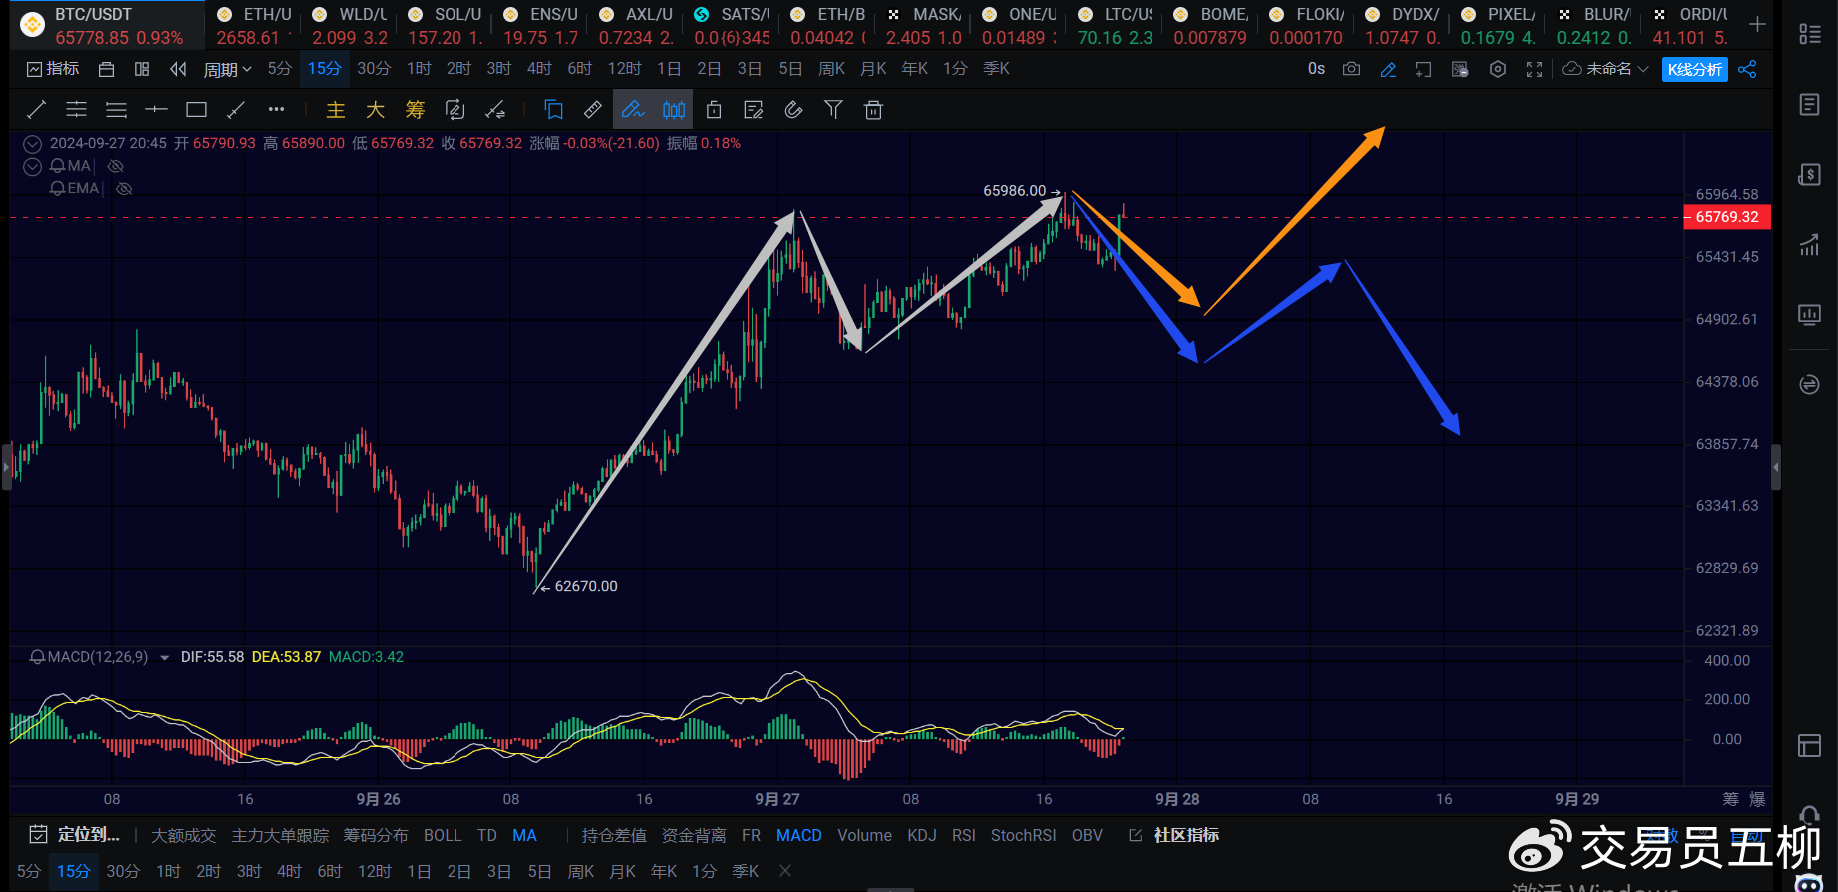
At the 15-minute level, the rebound from yesterday morning's 62,670, which is a 1-hour level rebound, has already formed three segments of up, down, and up. It was anticipated that a 15-minute level pullback would occur in the early morning. If the pullback falls below 64,600, it is highly likely that a 1-hour level pullback will occur, as indicated by the blue arrow on the chart. If the 15-minute level pullback does not fall below 64,600, there is a possibility of a consolidation of a 15-minute level pivot, followed by a continued surge to 66,500.
ETH
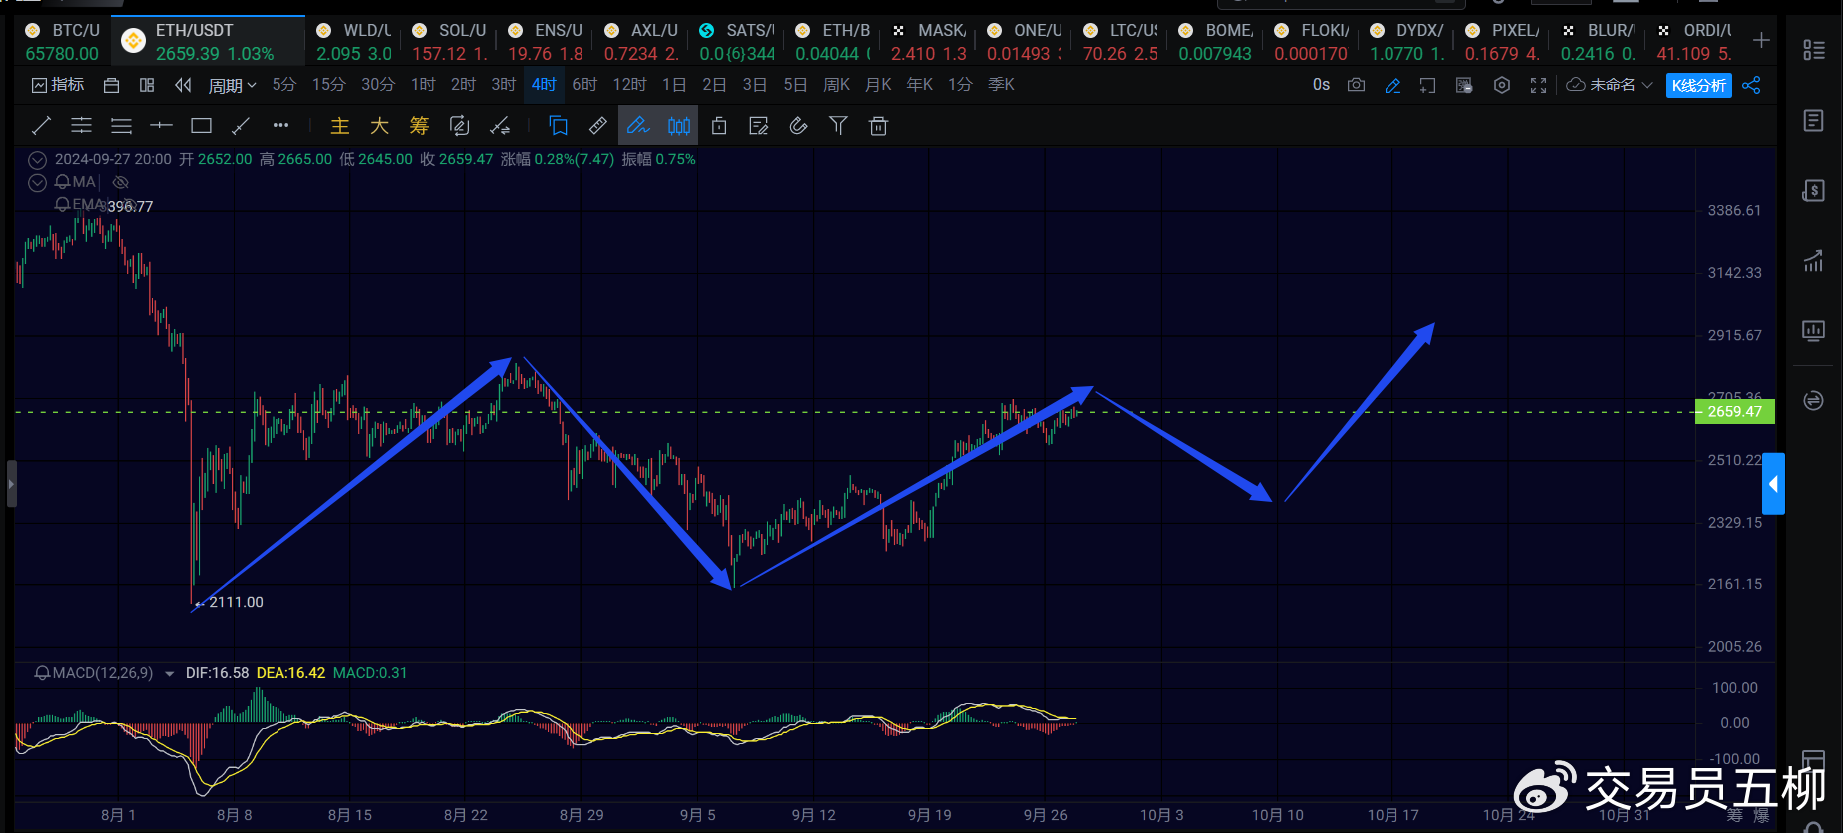
For Ethereum, the original expectation was that the third 4-hour level rebound would not exceed 2,800, followed by a 4-hour level pullback to consolidate a 4-hour level pivot, and then another upward movement for the fifth 4-hour level rebound to around 2,900-3,000, starting from 2,111, forming a daily level rebound to test the resistance at 3,000.
Therefore, the resistance at the 4-hour level is in the range of 2,700-2,800, and it remains to be seen whether it will surge to 2,800. If it fails to do so, a 4-hour level pullback is likely in the near future.
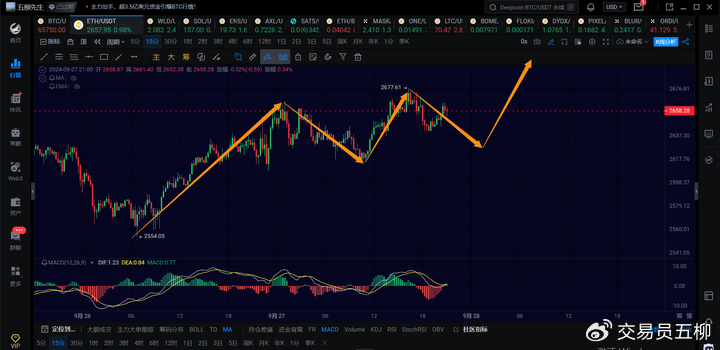
The ongoing 1-hour level rebound from 2,554 also needs further observation to see if it will consolidate a 15-minute level pivot and continue to surge to around 2,700. If the 15-minute level pullback does not fall below 2,615, there is likely to be another 15-minute level rebound to continue the surge, but if it falls below, a 1-hour level pullback should be expected.
Trend Direction
Weekly Level: Downward direction, the extension of the weekly decline, theoretically around 49,000, with a limit of around 45,000-48,000. Whether it has ended needs further observation.
Daily Level: Upward direction, short-term outlook is to continue to look at the range of 67,000-70,000.
4-Hour Level: Upward direction, as long as it remains above 64,000, the 4-hour level rebound is expected to continue. If it falls below, a 4-hour pullback is likely.
1-Hour Level: Upward direction, there is currently a possibility of further upward extension, with attention to the strength of the short-term 15-minute level pullback.
15-Minute Level: Upward direction, if the short-term 15-minute level pullback does not fall below 64,600, it may consolidate a pivot and continue to surge.
Feel free to follow my public account for further discussion and exchange:

The article is time-sensitive, so please be aware of the risks. The views expressed in the article are personal opinions and are for reference only!
免责声明:本文章仅代表作者个人观点,不代表本平台的立场和观点。本文章仅供信息分享,不构成对任何人的任何投资建议。用户与作者之间的任何争议,与本平台无关。如网页中刊载的文章或图片涉及侵权,请提供相关的权利证明和身份证明发送邮件到support@aicoin.com,本平台相关工作人员将会进行核查。


