Cryptocurrency News
September 27th Hot Topics:
1. OpenAI launches a new model based on GPT-4O, which is more accurate in detecting harmful text and images.
2. Trump calls for the prosecution of Nancy Pelosi for insider trading.
3. BNY Mellon Bank receives SEC approval to provide cryptocurrency custody services.
4. Robinhood is considering the potential launch of a stablecoin, and Revolut is also considering the launch of a stablecoin.
5. Gensler warns that without investor protection, the cryptocurrency industry "will not last long."
Trading Insights
Six wrong mindsets in a bull market:
- Failing to catch the bottom and constantly trying to guess the top to make money by shorting.
- Comparing returns with others and living in anxiety every day.
- Unable to hold onto coins, frequently changing positions, and increasing costs.
- Adding leverage after missing out, only to be liquidated by a pullback.
- Mistakenly believing that shorting BTC means shorting all high-quality coins.
- Wanting to succeed in every race, when in reality, you can only succeed in one.
LIFE IS LIKE A JOURNEY ▲
Below are the real trading signals from the Da Bai Community this week. Congratulations to the friends who followed. If your operations are not going well, you can come and try it out.
Real data, each signal has a screenshot taken at the time.
Search for the public account: Da Bai Lun Bi
BTC
Analysis
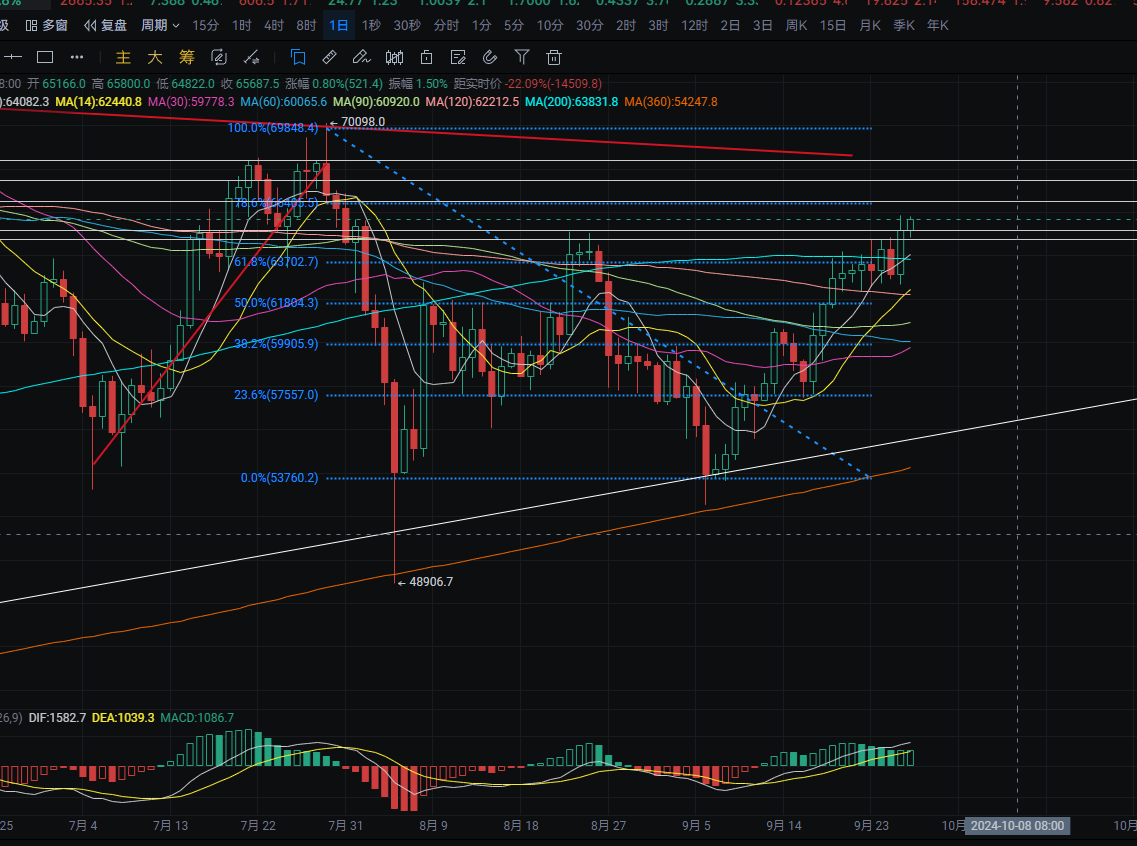
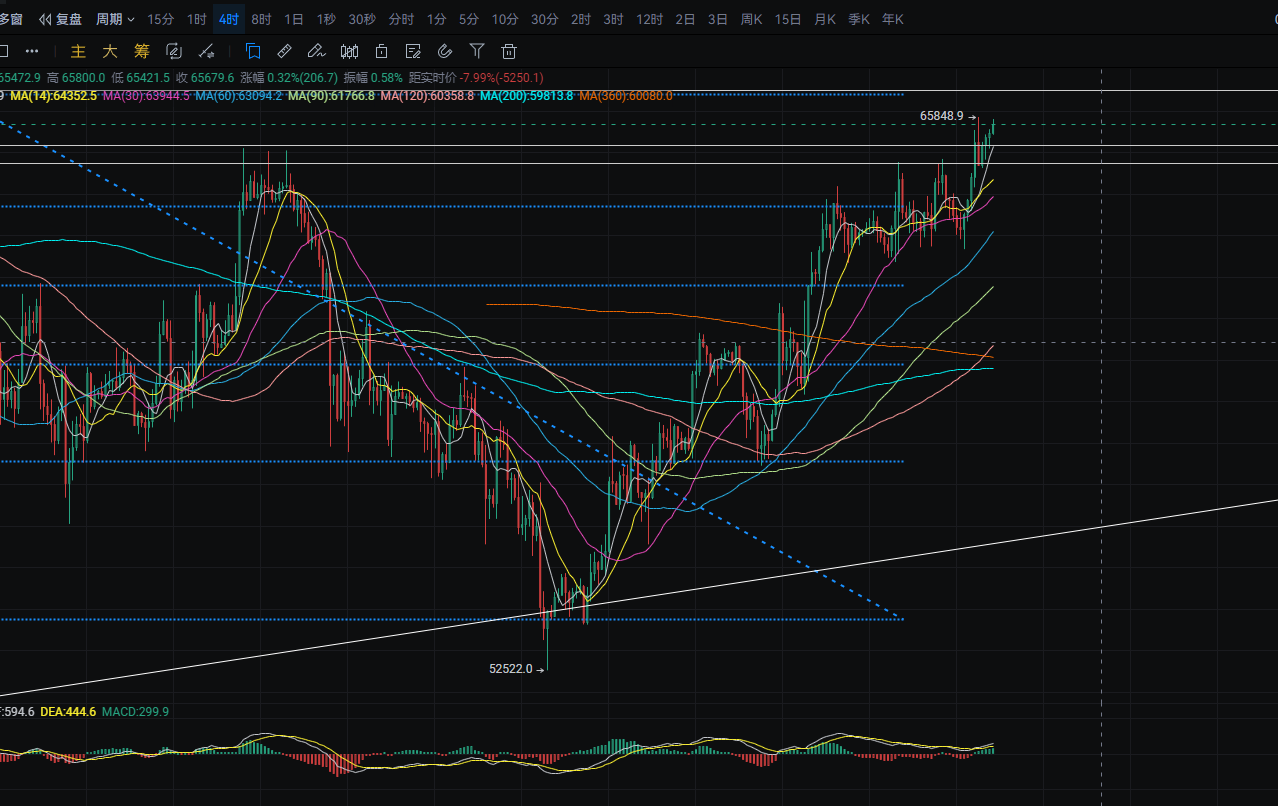
Bitcoin's daily chart showed a rally yesterday, rising from around 62660 to near 65850, closing at around 65150. The resistance is near 66500, and the support is around 65000. A pullback can be considered near these levels. The MACD shows bullish momentum. On the 4-hour chart, the support is near the MA7 moving average. If it breaks, it may test near MA14. A pullback near these levels can be considered for long positions. The top resistance is near 0.786, and a rebound to this level can be considered for short positions. The MACD shows bullish momentum and a golden cross. Short-term long positions can be considered near 65188-64750, with a rebound target around 66500-67500. A rebound to 67350-68300 can be considered for short positions, with a target around 65800-64850.
ETH
Analysis
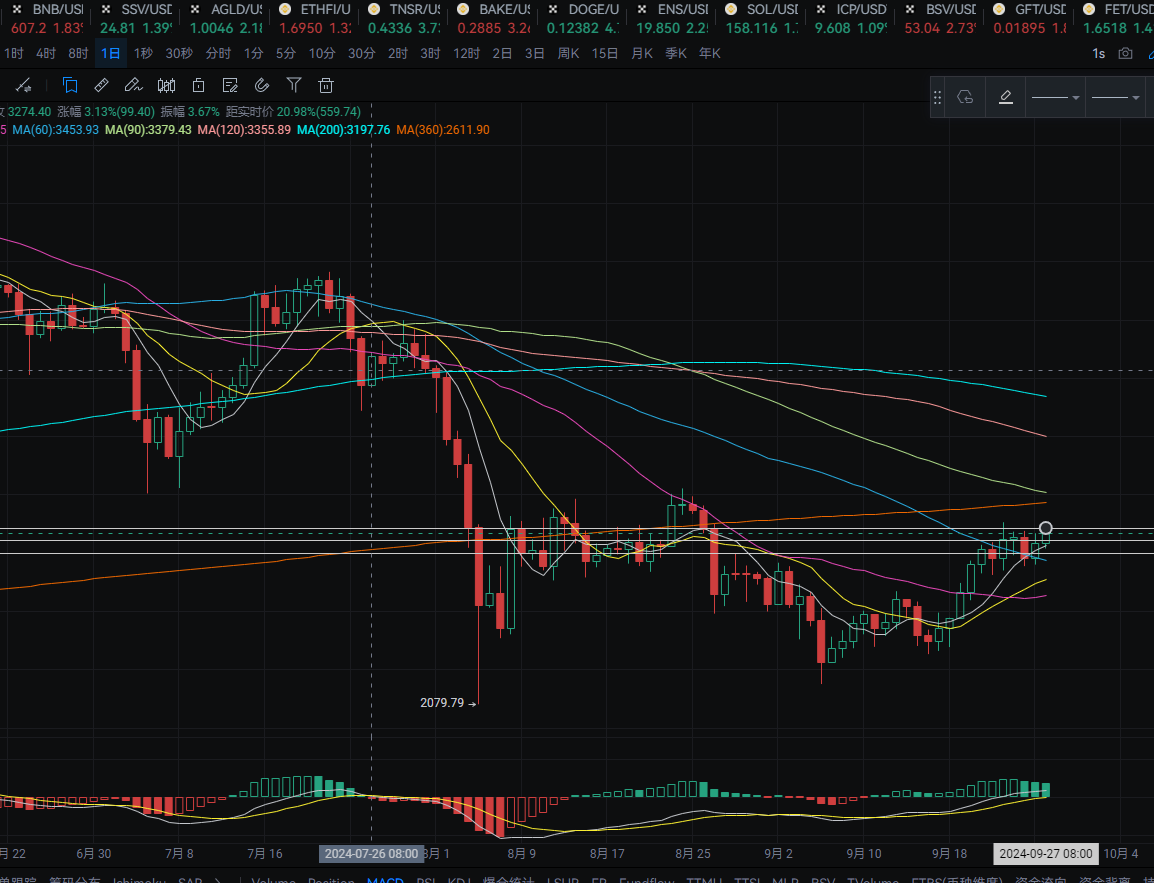
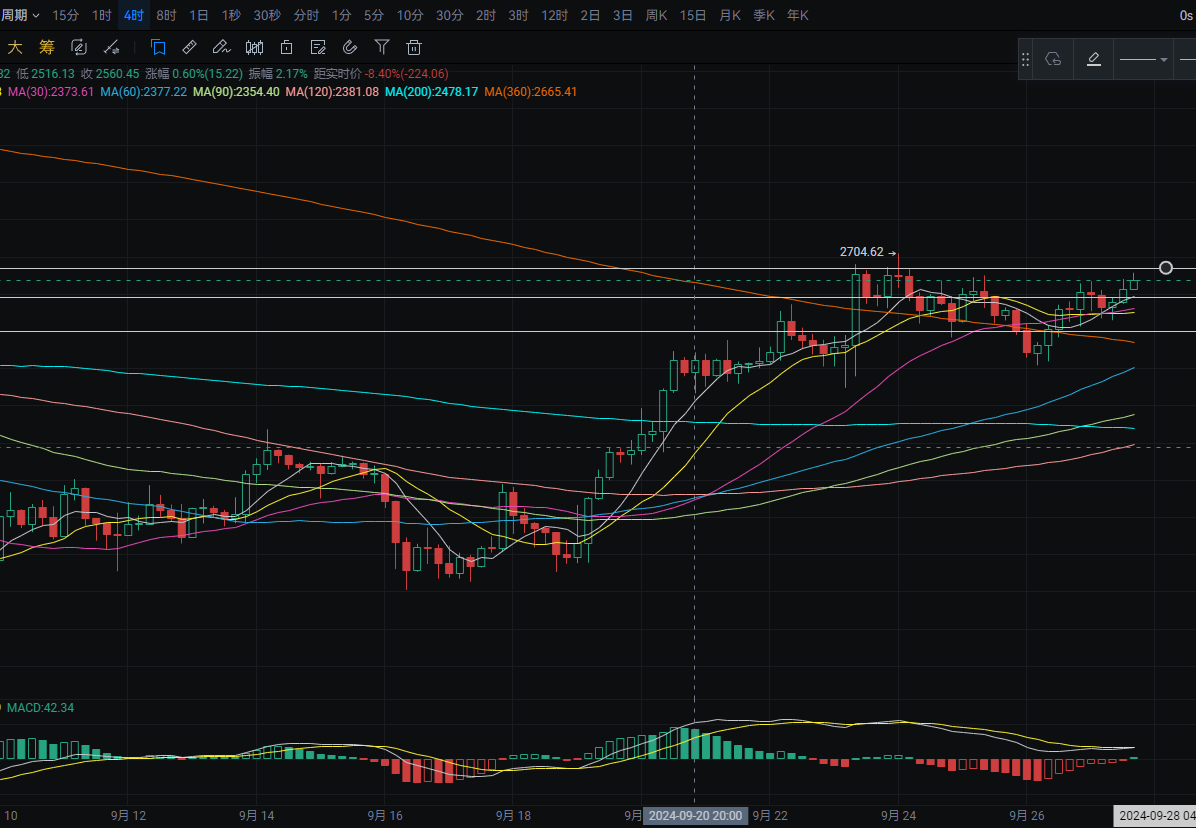
Ethereum's daily chart showed a rebound yesterday, rising from around 2560 to near 2665, closing at around 2630. There has been multiple tests of resistance near 2680. A breakthrough may lead to a test towards the MA360 yearly line. The support is near the MA7 moving average, and a pullback near these levels can be considered for long positions. The MACD shows bullish momentum. On the 4-hour chart, the support is near the MA7 moving average. If it breaks, it may test near MA360. A pullback near these levels can be considered for long positions. The MACD shows signs of a golden cross with bearish momentum. Short-term long positions can be considered near 2600, with a rebound target around 2645-2685.
Disclaimer: The above content is for personal reference only and does not constitute specific trading advice, nor does it bear legal responsibility. The market situation changes rapidly, and the article has a certain lag. If there is anything you don't understand, feel free to consult.
免责声明:本文章仅代表作者个人观点,不代表本平台的立场和观点。本文章仅供信息分享,不构成对任何人的任何投资建议。用户与作者之间的任何争议,与本平台无关。如网页中刊载的文章或图片涉及侵权,请提供相关的权利证明和身份证明发送邮件到support@aicoin.com,本平台相关工作人员将会进行核查。


