Don't worry if you have no confidant on the road ahead, there are like-minded people on the investment road. Good afternoon, everyone! I am BitKing from the Coin Victory Team. Thank you all for coming here to read BitKing's articles and watch the videos. I also hope that those brothers who have been following BitKing will come back.
Click the link to watch the video:https://www.bilibili.com/video/BV1absZeiE6J/

1. Current Price: The current price of Bitcoin is $65,500. It has remained relatively stable in the recent trading period, with a slight decrease of 0.17%. The overall market volatility is low, with an amplitude of 0.25%.
2. Technical Analysis: Moving Average (MA): The current Bitcoin price is above the MA(7) and MA(30) lines. The short-term MA(7) is $65,178, MA(30) is $64,466, and MA(90) is $63,878. The short-term average is above the long-term average, indicating a short-term bullish trend in the market. However, the MA(7) is close to the current price, indicating the possibility of a slight upward movement in the short term.
3. Support and Resistance Levels: Support Levels: The closest support level in the chart is $64,845. Strong buying pressure near this price is helpful in supporting the price. In addition, an important secondary support level is at $63,856, and the forward support level is $62,803.2. If the price breaks through the current support level, it may further decline. Resistance Level: The short-term resistance level is $65,848.9. The price previously encountered resistance at this level. If Bitcoin can effectively break through this resistance level, it may initiate further upward movement.
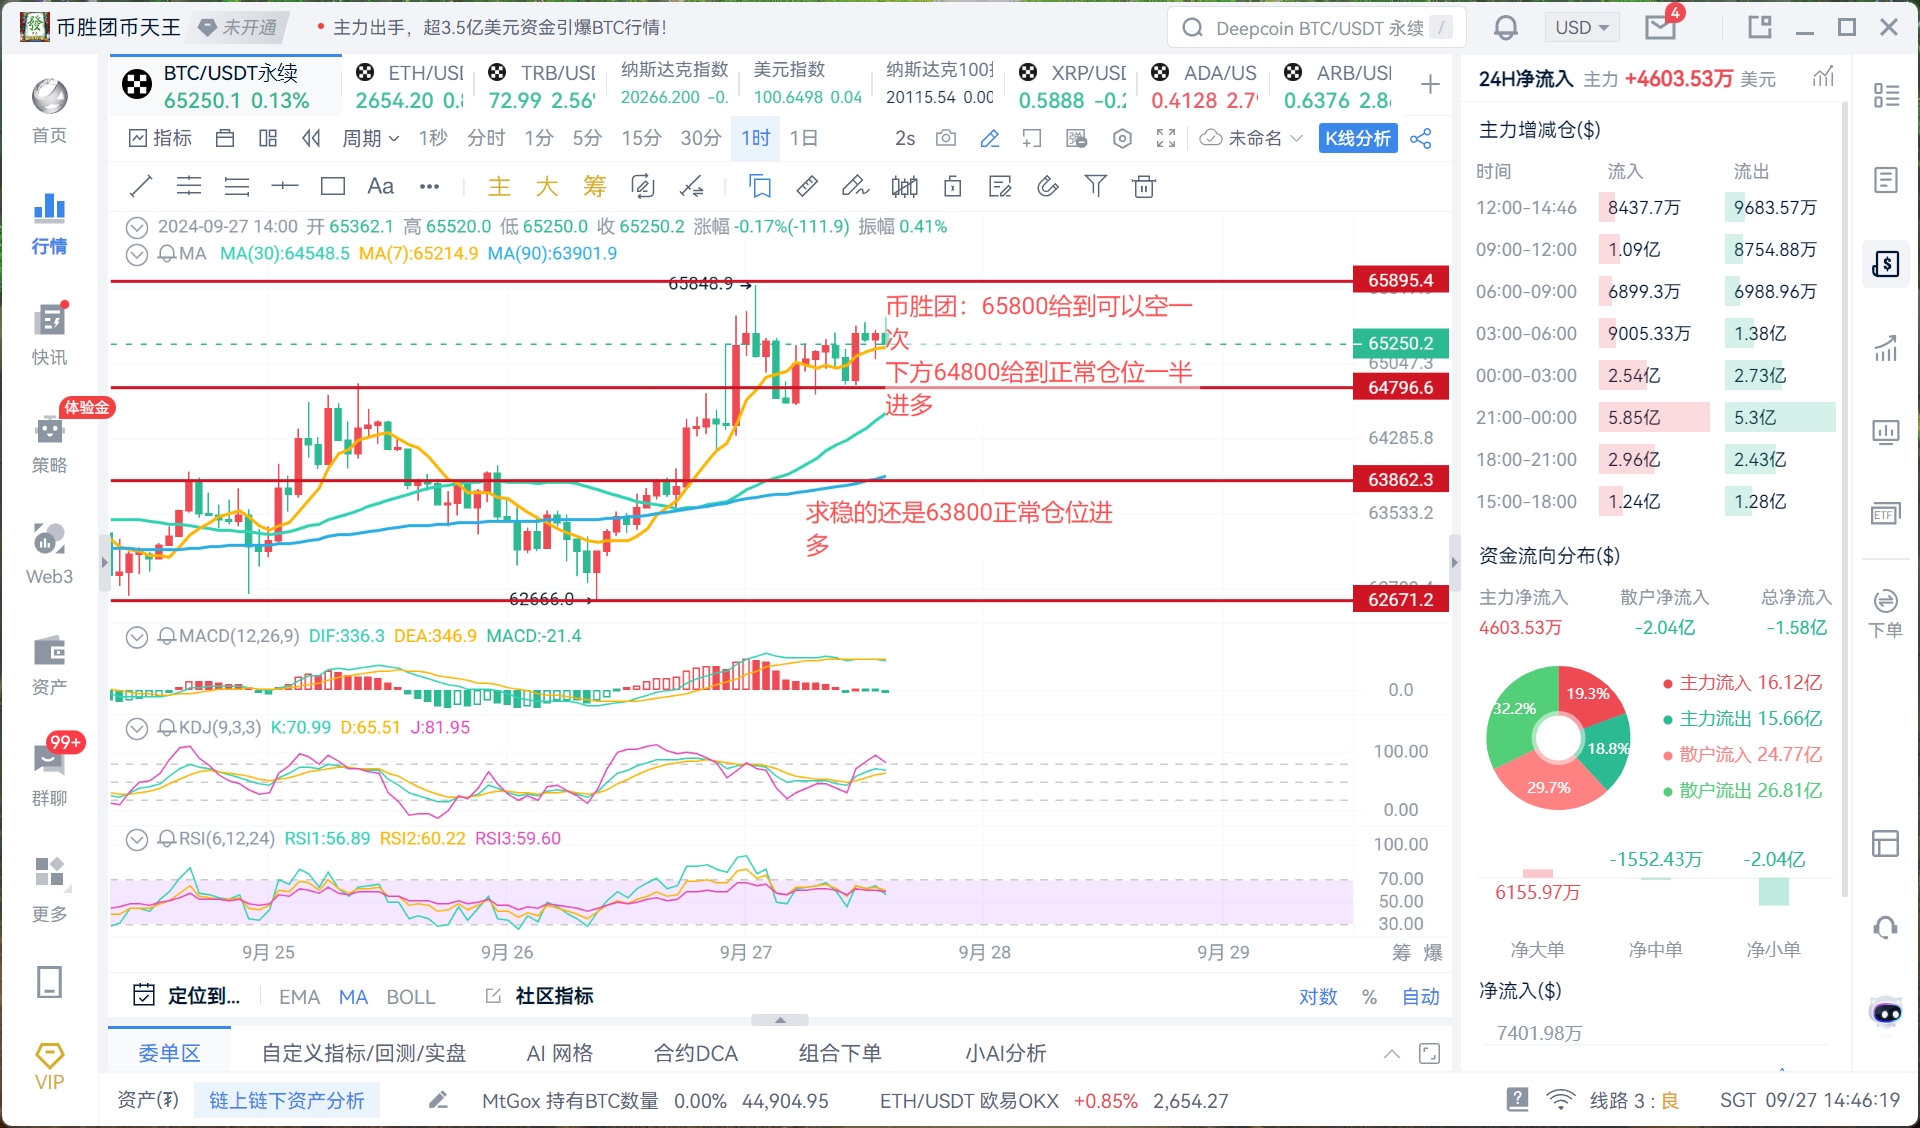
4. Technical Indicator Analysis: MACD: The DIF value is 335.1, the DEA value is 346.8, and the MACD is negative, indicating that the market selling pressure is slightly dominant, but the gap is not large, and there is still a possibility of turning bullish. Attention should be paid to changes in trading volume in the coming days. KDJ Indicator: The K value is 66.62, the D value is 60.48, and the J value is 78.91. The KDJ indicator shows that the market is in a strong buying zone, but since the J value has entered the overbought zone, there may be oscillation or short-term pullback in the future. RSI Indicator: RSI1 is 55.64, RSI2 is 59.43, and RSI3 is 59.12. RSI shows that the current market is in a slightly bullish neutral state, and the short-term upward momentum has not been exhausted, but attention should be paid to the price reaction near the resistance level.
5. Trend Analysis: The current Bitcoin price is in a trend of mild oscillation and upward movement in the short term. The overall market sentiment is bullish, but the resistance level of $65,848.9 is an important upward barrier. If it can break through this barrier, there is a possibility of further upward movement; otherwise, the price may pull back to the support level near $64,845.9.
6. 24-hour Net Fund Inflow: +$63.0651 billion, with a net inflow of $1.602 billion from the main force and a net outflow of $2.446 billion from retail investors. The fund flow data shows that there is a relatively large inflow of main funds, indicating that large funds are optimistic about the short-term trend, while retail funds have a net outflow, indicating that small funds have signs of profit-taking.
7. Summary and Suggestions: Bitcoin is currently in a bullish trend, and in the short term, it may oscillate between $64,845.9 and $65,848.9. If it breaks through $65,848.9, the price is expected to further rise. In the short term, it is recommended for investors to buy on dips near the support level and gradually reduce positions near the resistance level while observing.
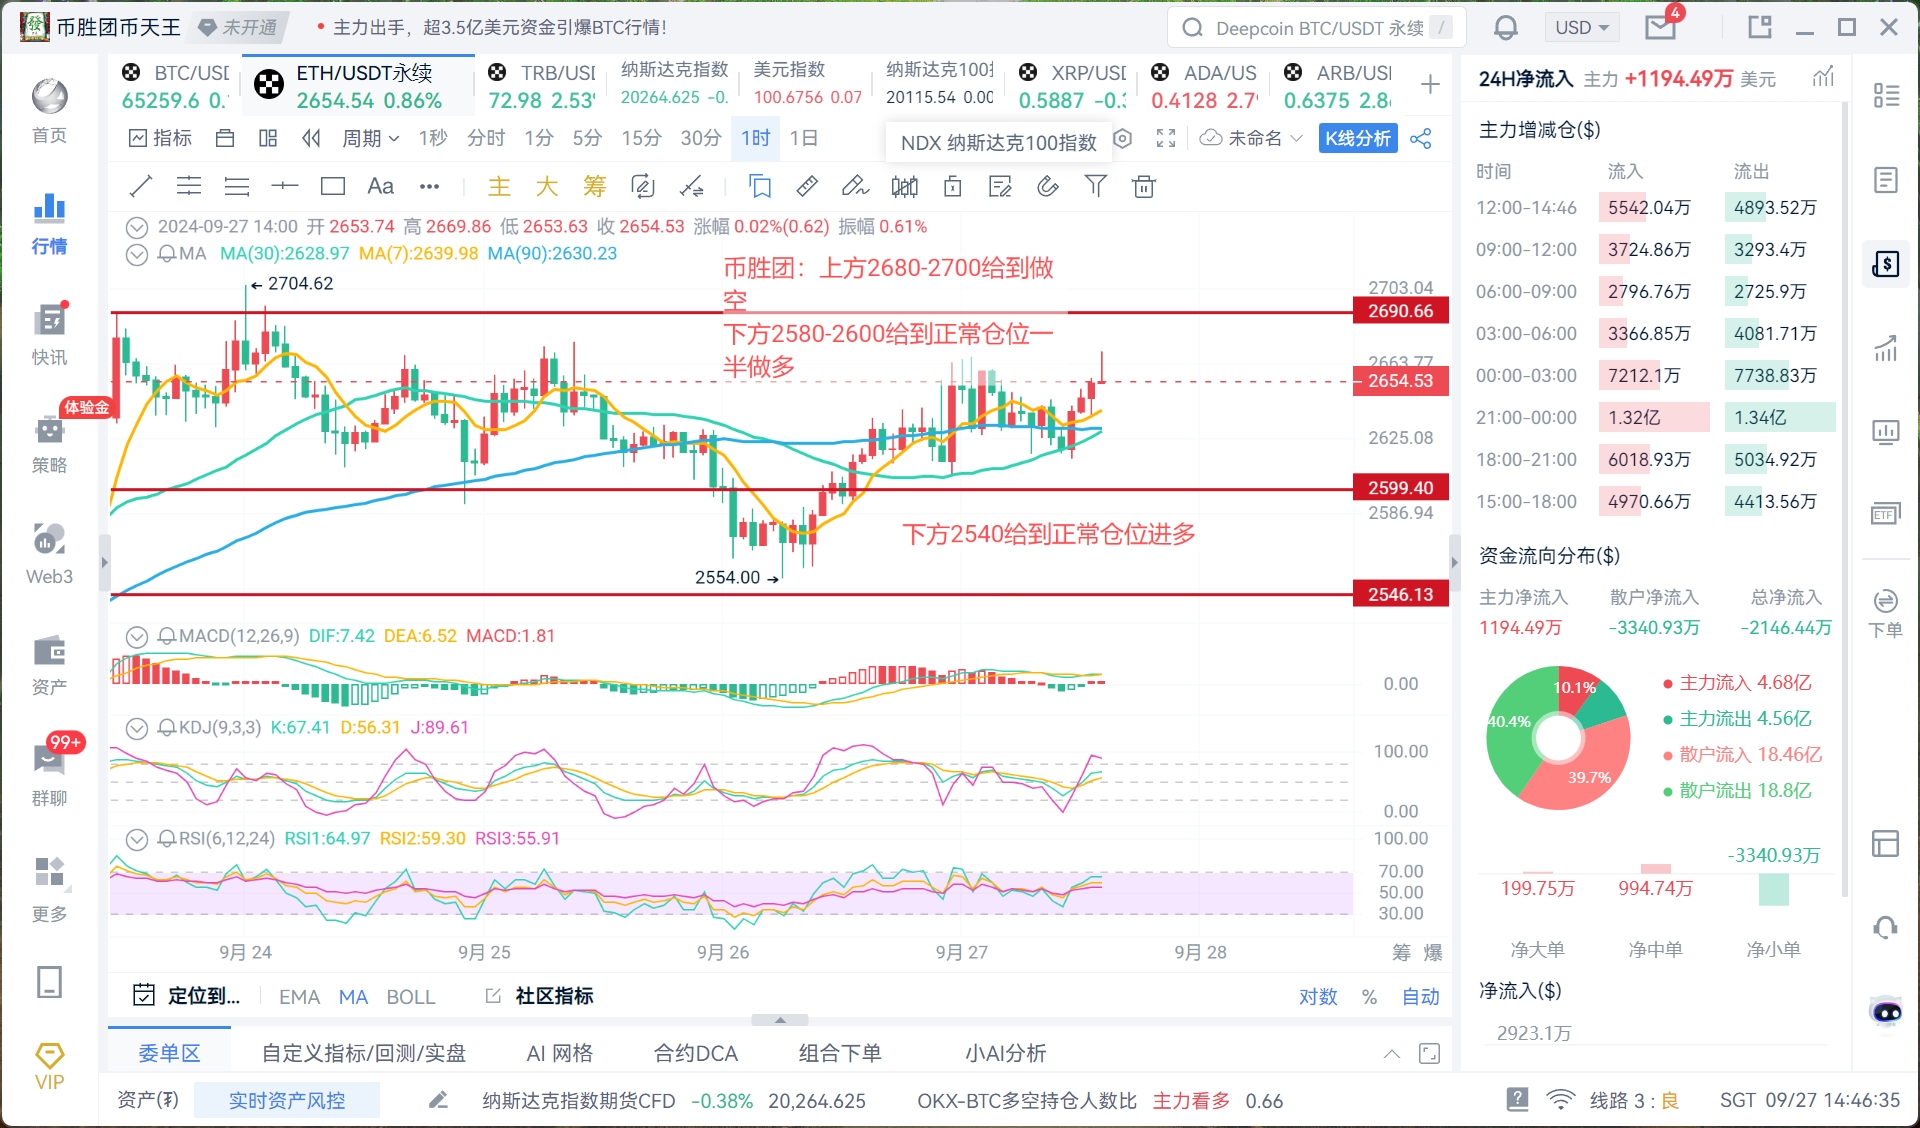
Now let's take a look at Ethereum. 1. Price Overview: Current Price: The current price of Ethereum is $2,642.66, with a 0.43% increase. 24-hour price range: The lowest point is $2,636.55, and the highest point is $2,651.66, indicating a narrow range of fluctuations, showing that the market is in a narrow range of oscillation and consolidation phase.
2. Technical Analysis: Moving Average (MA): The current price is slightly above the short-term, medium-term, and long-term moving averages, indicating a bullish trend, but the moving average trend is relatively flat, showing that the market temporarily lacks strong upward momentum. MACD Indicator: The indicator shows that the bullish momentum in the market is slightly dominant, but overall it is still in a oscillating state. It is expected to maintain a slight upward trend in the short term, but attention should be paid to whether new buying will enter to drive a stronger upward movement. KDJ Indicator: The indicator is in a strong zone, but the J value is high, indicating the possibility of overbought conditions in the short term, and may face temporary pressure for a pullback. RSI Indicator: The indicator shows that the market sentiment is neutral to slightly bullish, but has not entered the extreme zone, indicating that there is still some upward space in the market.
3. Support and Resistance Levels: Support Levels: First support level: $2,605.42, which is a key recent support level. If the price falls to this level, it may receive buying support. Second support level: $2,536.46, is a stronger support level. If the price falls below the first support level, this will become an important defensive point. Resistance Level: Current resistance level: $2,704.62, is a key point that needs to be broken through in the short term. If the price breaks through this level, the market is expected to open up further upward space.

4. Fund Flow Analysis: 24-hour Net Fund Inflow: +$6.4794 million, showing that the inflow of main funds is greater than the outflow, indicating that institutions and large holders have a certain bullish expectation for the future. Main Fund Flow: Inflow of $449 million, outflow of $174 million, net inflow of main funds, indicating that the bullish force in the market is relatively strong. Retail Fund Flow: Net outflow of $1.812 billion, indicating a relatively large outflow of retail funds, showing that retail investors are cautious about the current price and may choose to stay on the sidelines or take profits.
5. Market Sentiment Analysis: The overall market sentiment is bullish, with the inflow of main funds indicating that large funds still have a positive outlook for the future, while the outflow of retail funds indicates that some small investors are cautious. In the short term, the market sentiment is relatively optimistic, but beware of the risk of a pullback caused by overbought conditions.
6. Summary and Suggestions: Ethereum is currently in a trend of oscillation and upward movement, and in the short term, the price may fluctuate between $2,605.42 and $2,704.62. If the price can effectively break through $2,704.62, it is expected to further rise; otherwise, the market may pull back to the support level near $2,605.42. It is recommended for investors to buy on dips and closely monitor changes in key resistance levels and fund flows.
This article is independently written by the Coin Victory Team. Friends who need current price strategies and solutions can find the Coin Victory Team across the entire network. Because the recent market trends have been mainly oscillating, followed by intermittent sharp movements, so when placing orders, please remember to set stop-loss and take-profit levels and control them well. When facing major market data trends in the future, the Coin Victory Team will also organize live broadcasts across the entire network. Friends who need to watch can find the Coin Victory Team across the entire network and contact me, and I will send the link at that time.

Mainly targeting spot, contract, BTC/ETH/ETC/LTC/EOS/BSV/ATOM/XRP/BCH/LINK/TRX/DOT, proficient in style, mobile lock position warfare around high and low support and pressure short-term band high and low, medium and long-term trend orders, daily limit retracement, weekly K top prediction, monthly line top prediction.
免责声明:本文章仅代表作者个人观点,不代表本平台的立场和观点。本文章仅供信息分享,不构成对任何人的任何投资建议。用户与作者之间的任何争议,与本平台无关。如网页中刊载的文章或图片涉及侵权,请提供相关的权利证明和身份证明发送邮件到support@aicoin.com,本平台相关工作人员将会进行核查。


