On the afternoon of September 12th at 16:00, AICoin researchers conducted a graphic and text sharing on "Williams Indicator, a New Shortcut to Wealth (with Membership Giveaway)" in the AICoin PC-end Group Chat Live. Here is a summary of the live content.
I. Overview of the Williams Indicator
The content of this live broadcast is to learn the usage of the Williams Indicator, accurately grasp market overbought and oversold signals.
The Williams Indicator is an indicator that combines overbought and oversold levels and strong and weak boundaries. It is mainly used to measure the overbought and oversold levels of the market, also known as "Williams Index" or "Overbought and Oversold Index." It was first proposed by Larry Williams, a well-known commodity trader in the United States, in his book "How I Made One Million Dollars" published in 1973.
Indicator guidance: PC client-Indicator Library-Williams Indicator WR, follow this tutorial to operate together.
The Williams Indicator WR is the difference between the highest price of N days and the closing price of the day, divided by the difference between the highest and lowest prices of N days, and the result is magnified by 100 times. It is an indicator that combines overbought and oversold levels and strong and weak boundaries based on the "closing price" swing point. It measures whether the market is in an overbought or oversold state and assists in confirming short-term buying and selling signals with other indicators. You can learn about oversold and overbought through this indicator. 
In simple terms, it can be understood as a moving ball in a space with a ceiling above and a floor below, bouncing up and down. When the ball hits the ceiling, it will turn downwards, and when it hits the floor, it will bounce upwards, and this ball is the Williams Indicator. 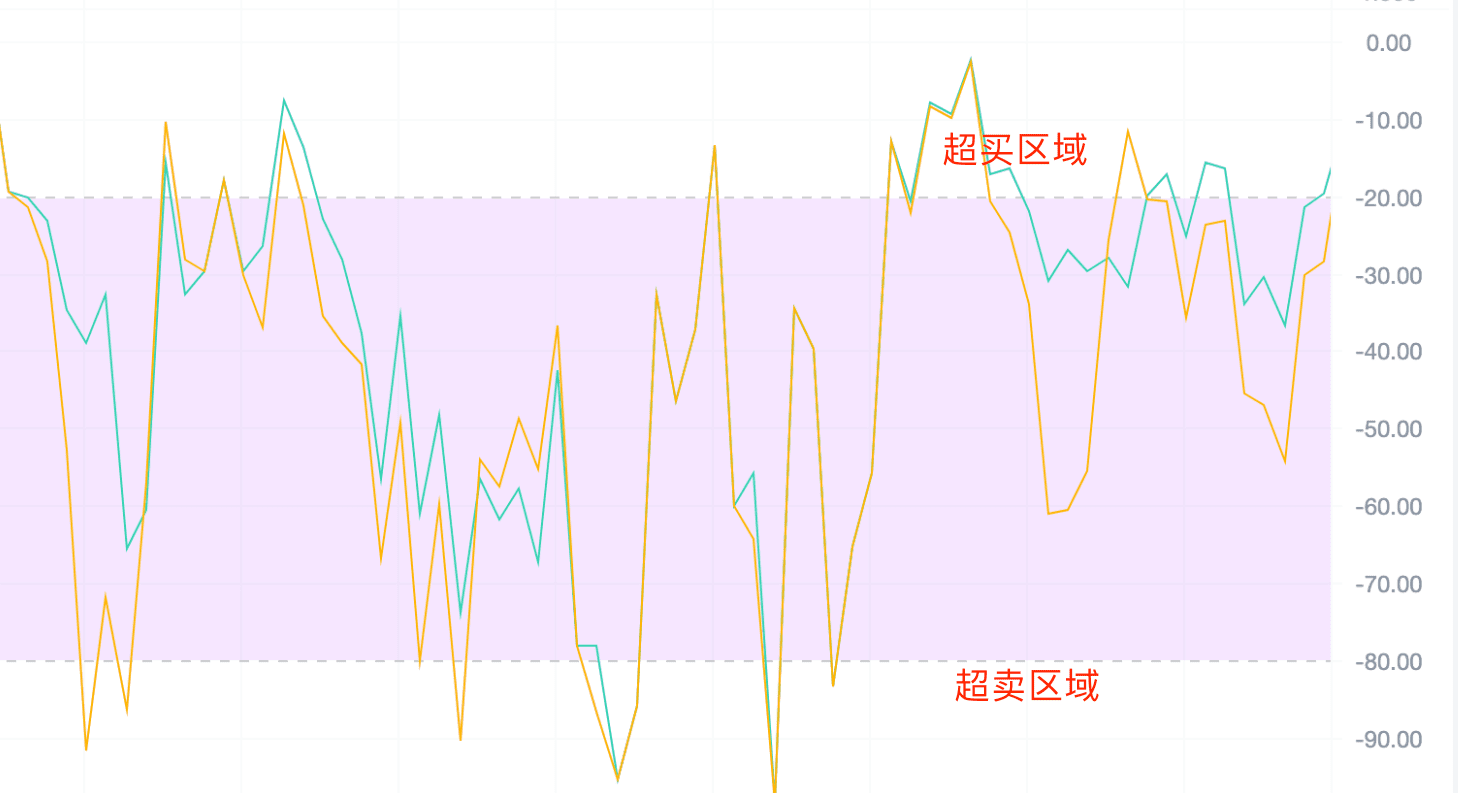
As a momentum oscillation indicator, the value of the Williams Indicator ranges from 0 to -100, with -50 as the midpoint. When using the Williams Indicator, it is important to focus on the -20 and -80 overbought and oversold boundary lines. After opening this indicator, you can use the default parameters without additional settings. Adjust them on your own once you understand their meanings.
Generally, when the Williams Indicator is above the -20 boundary line, it indicates that the market is in an overbought state; when the Williams Indicator is below the -80 boundary line, it indicates that the market is in an oversold state. 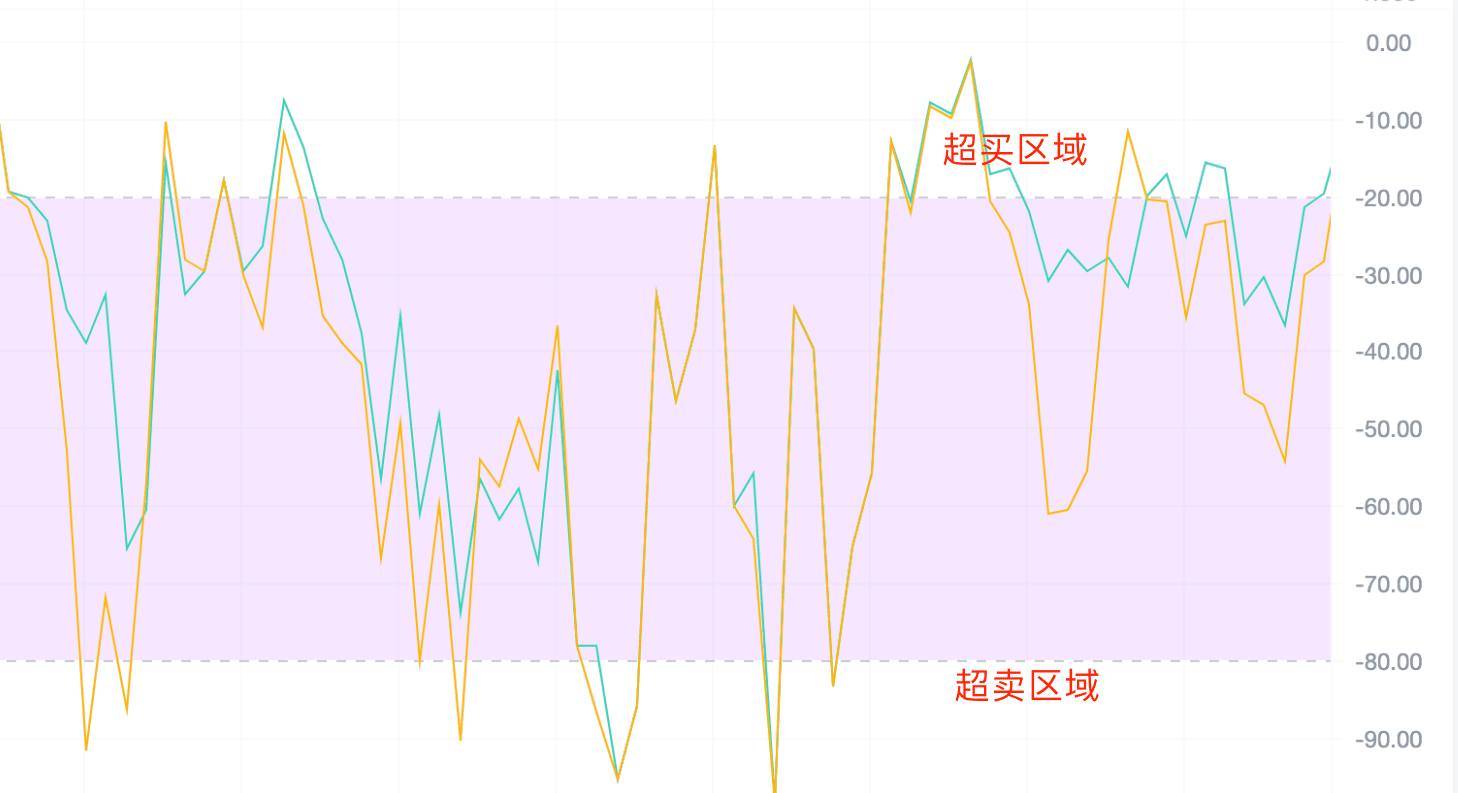
Like other technical analysis indicators, the Williams Indicator can be used to analyze market trends on various timeframes. The system defaults to selecting two values, 10 days and 6 days (values can be changed by yourself).
As an indicator for identifying overbought and oversold states, its partition is as follows: 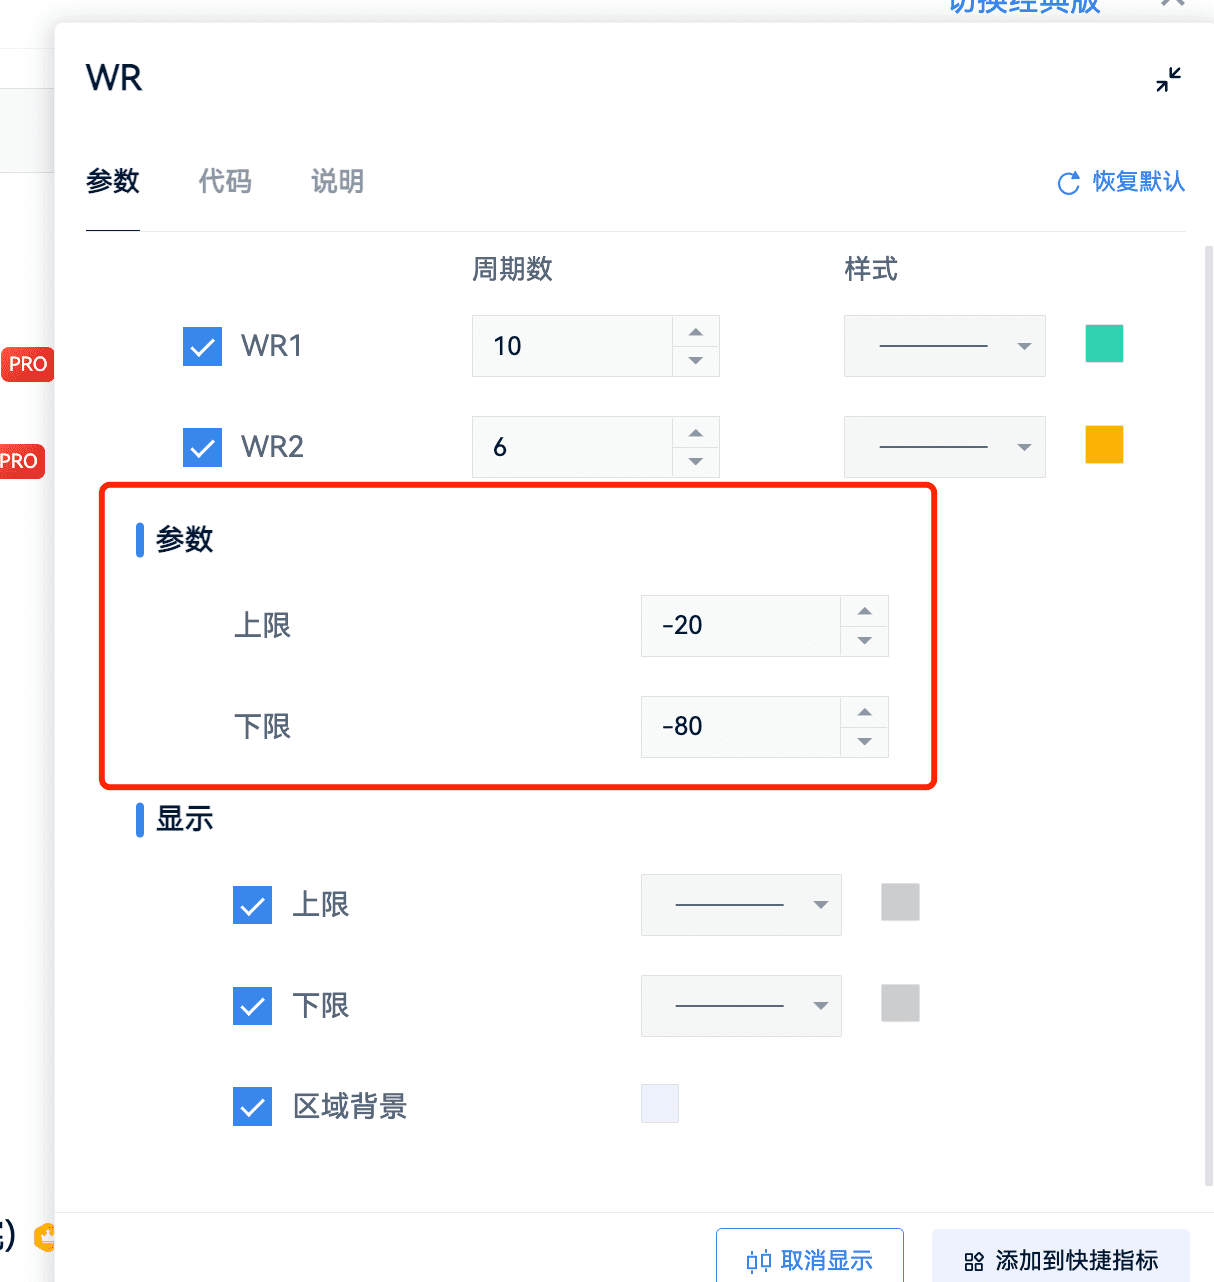
This parameter is the chart we will present later. For example: with 0 as the top and -100 as the bottom.
(1) When the WR line climbs up from the oversold area and exceeds the -20 line, it indicates that the market may break through upwards, which is a bullish signal.
(2) When the WR line starts to fall from the overbought area and falls below the -80 line, it indicates that the market may reverse downwards, which is a bearish signal.
(3) The Williams Indicator is an indicator that combines overbought and oversold levels and strong and weak boundaries. 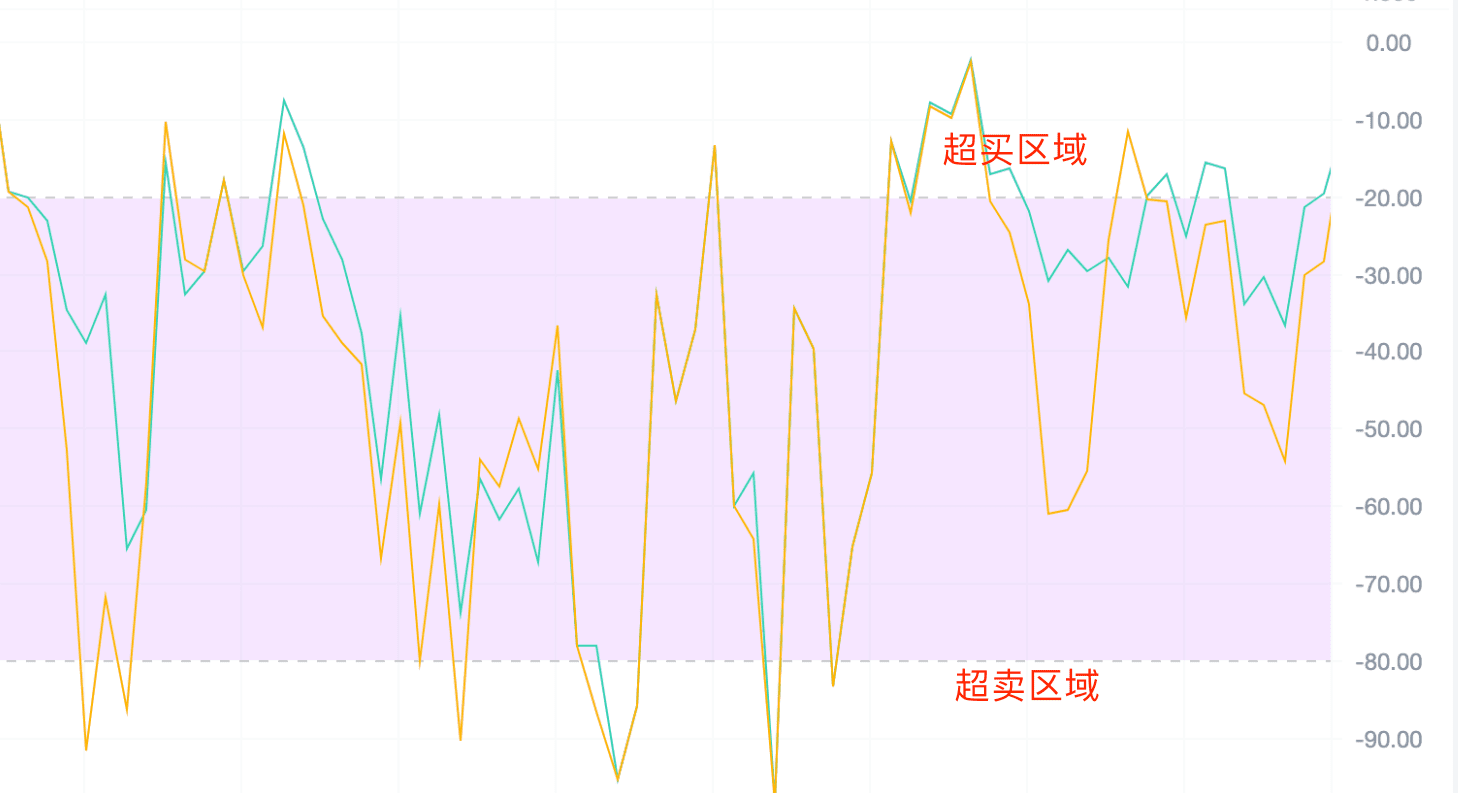
Summary: In the overbought area - bullish signal, in the oversold area - high probability bearish signal.
II. Methods of Using the Williams Indicator
Method 1: Continuous hitting the top. When the WR value is higher than -20, the Williams Indicator value hits the top value of 0 continuously, indicating hitting the top. At this time, the market is in an oversold state (critical!). 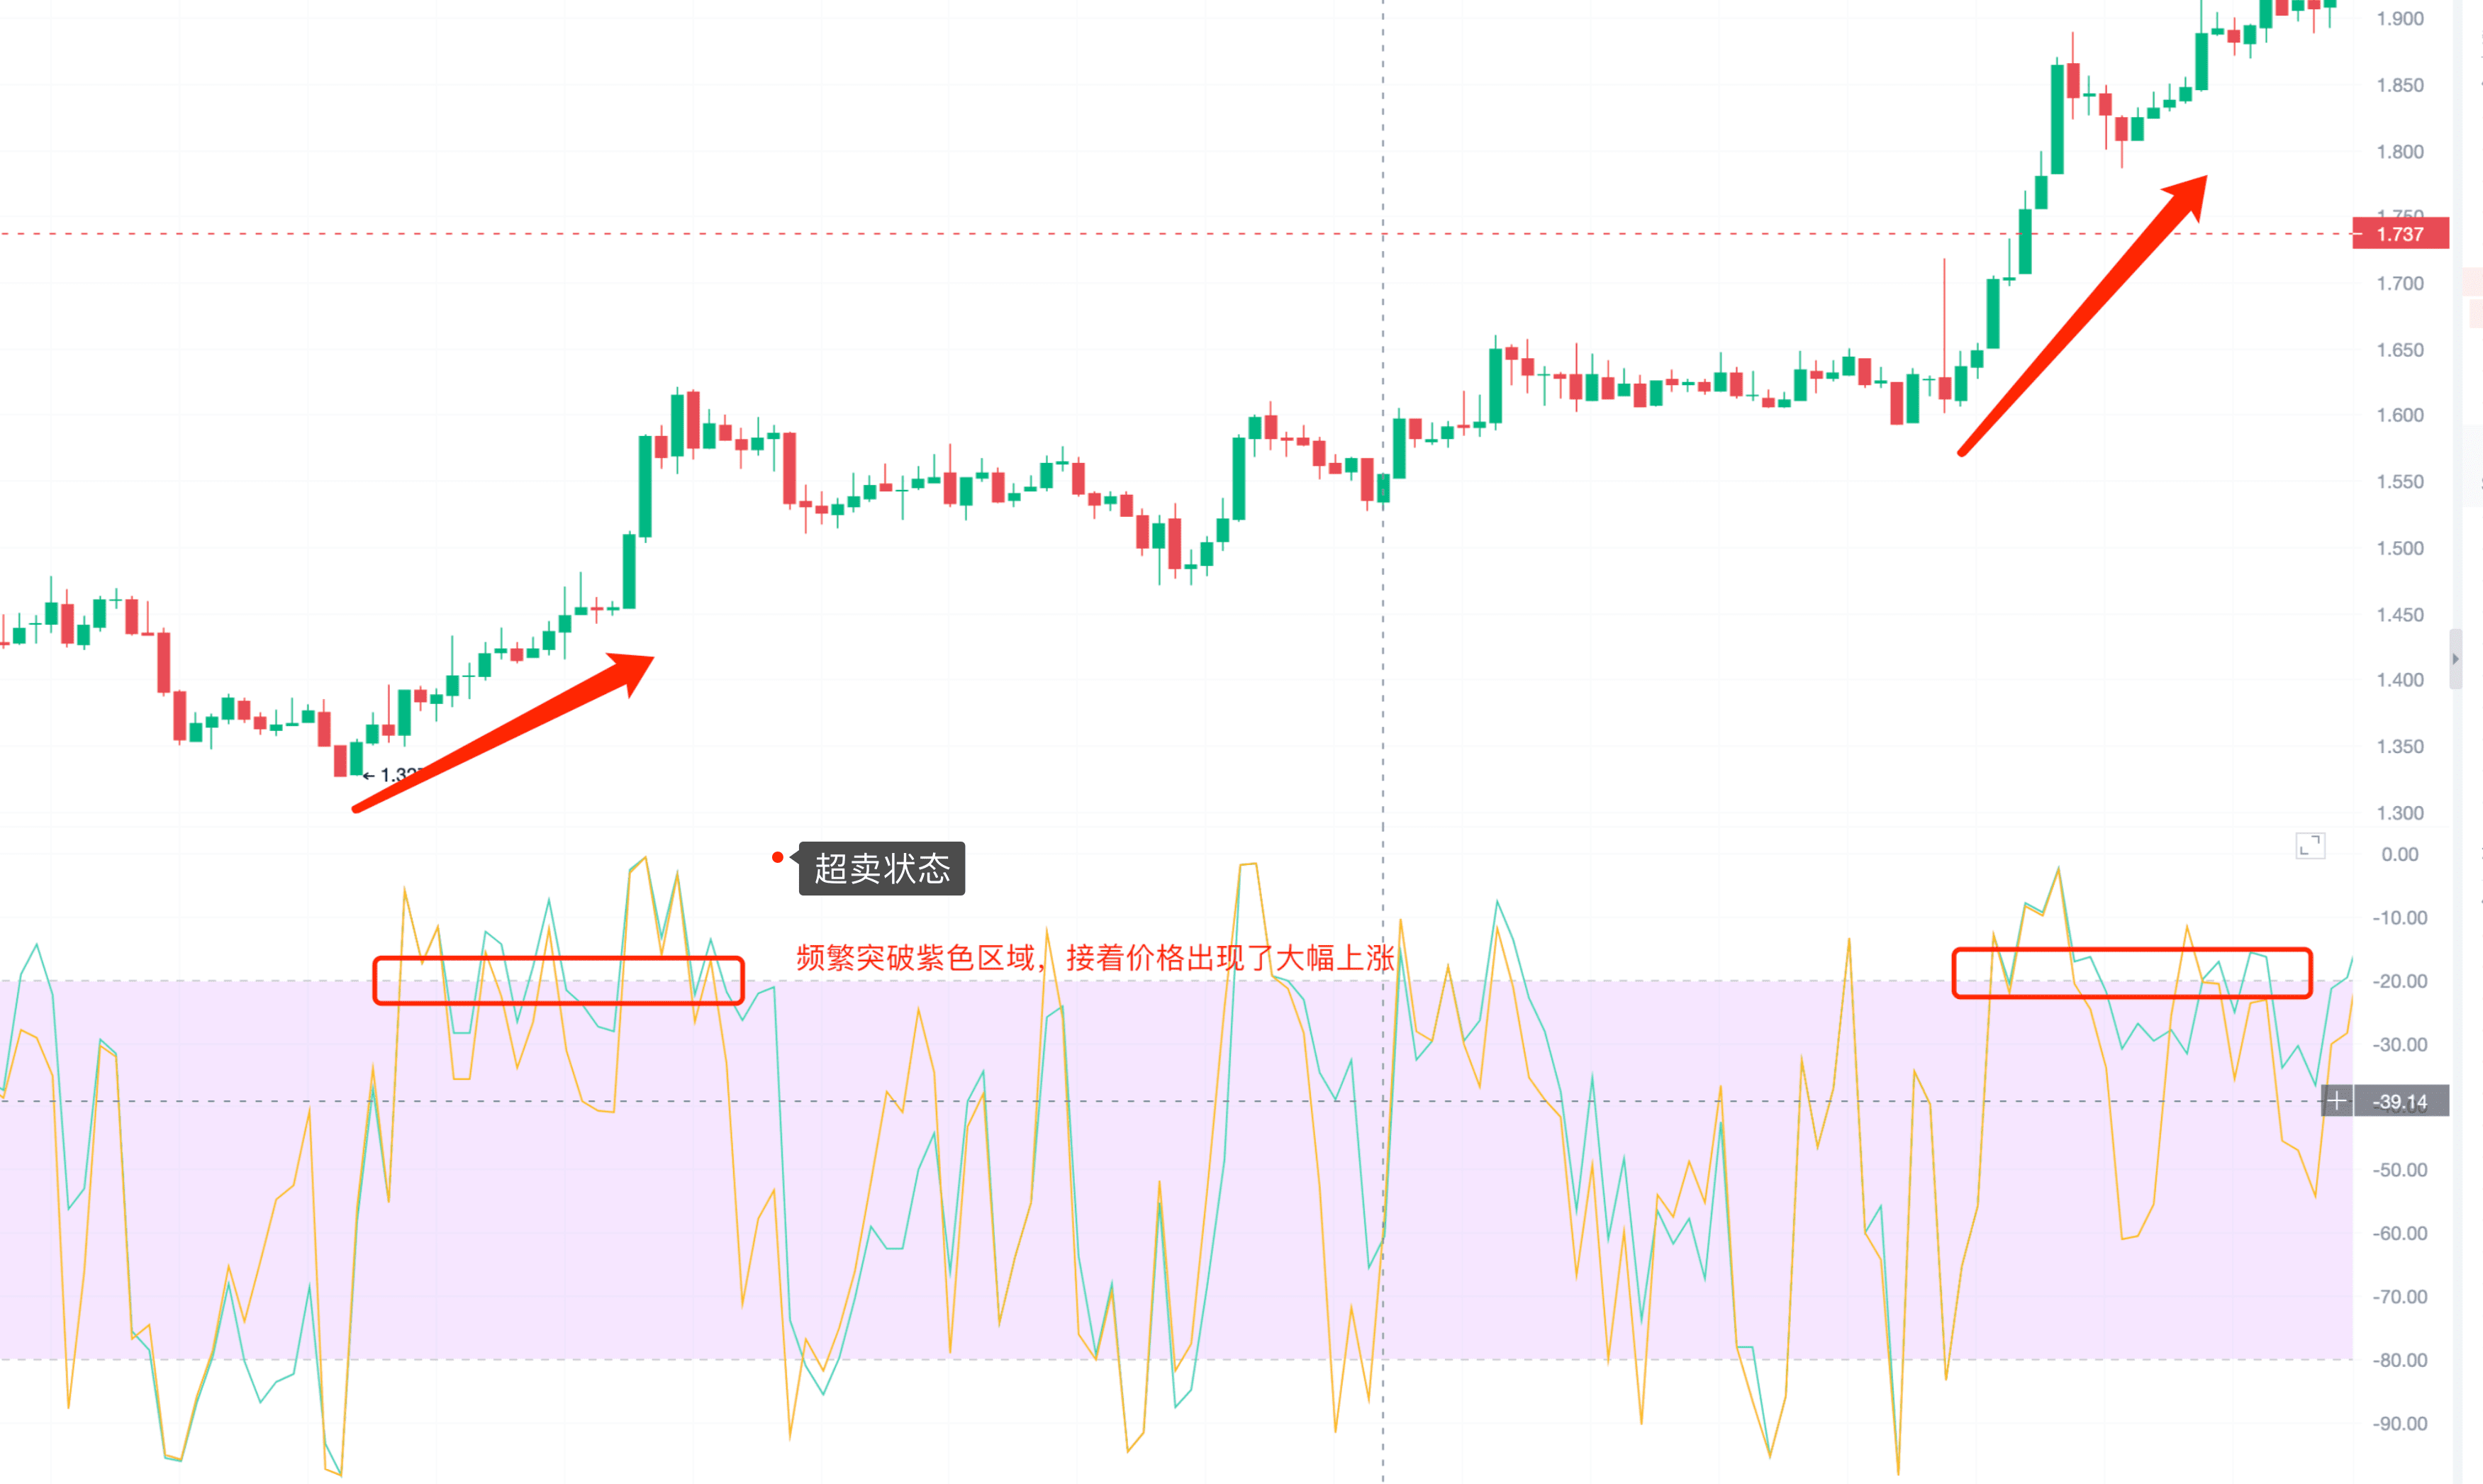
When you see the Williams Indicator continuously hitting the top on the left, the market is likely to rise subsequently.
Method 2: Continuous hitting the bottom. When the WR value is lower than -80, the Williams value hits the bottom value, indicating hitting the bottom. The market is in an overbought state: 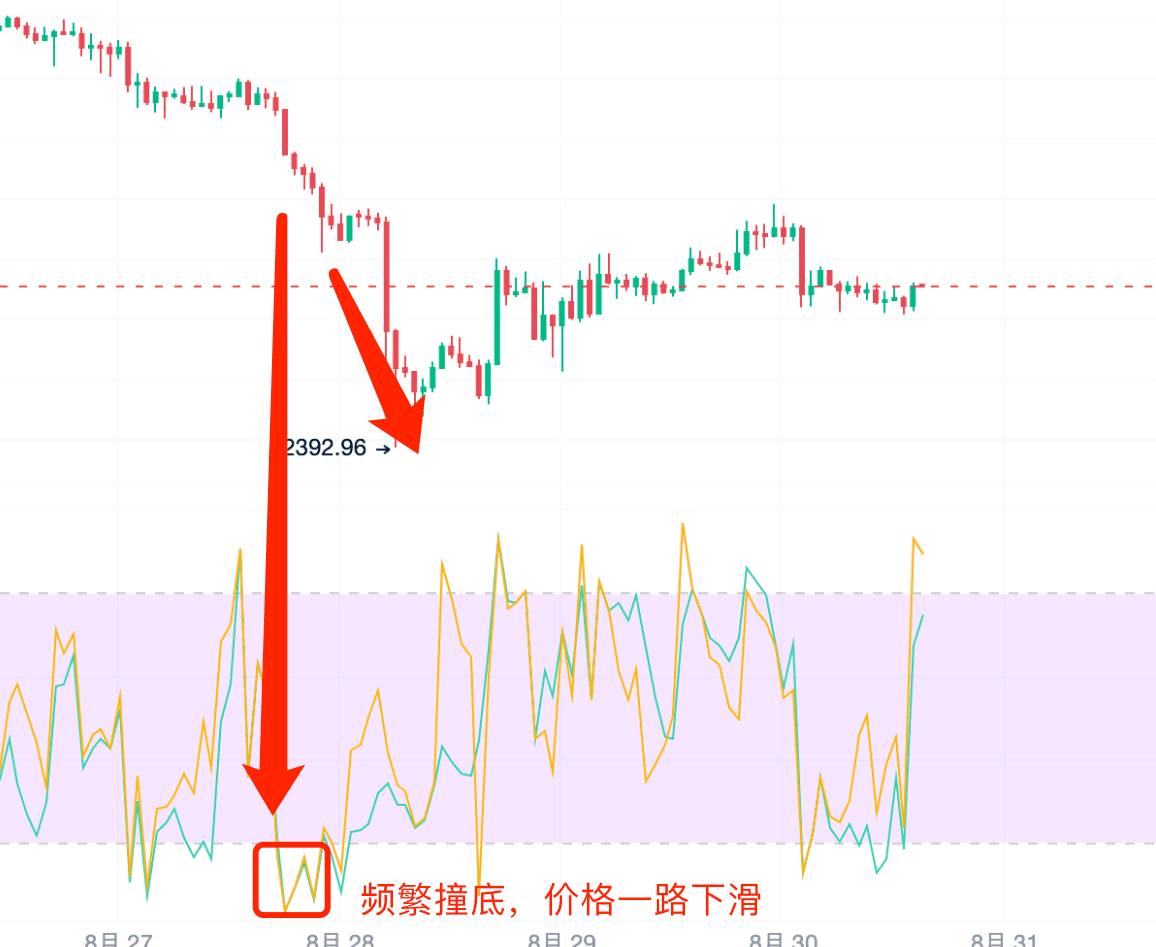
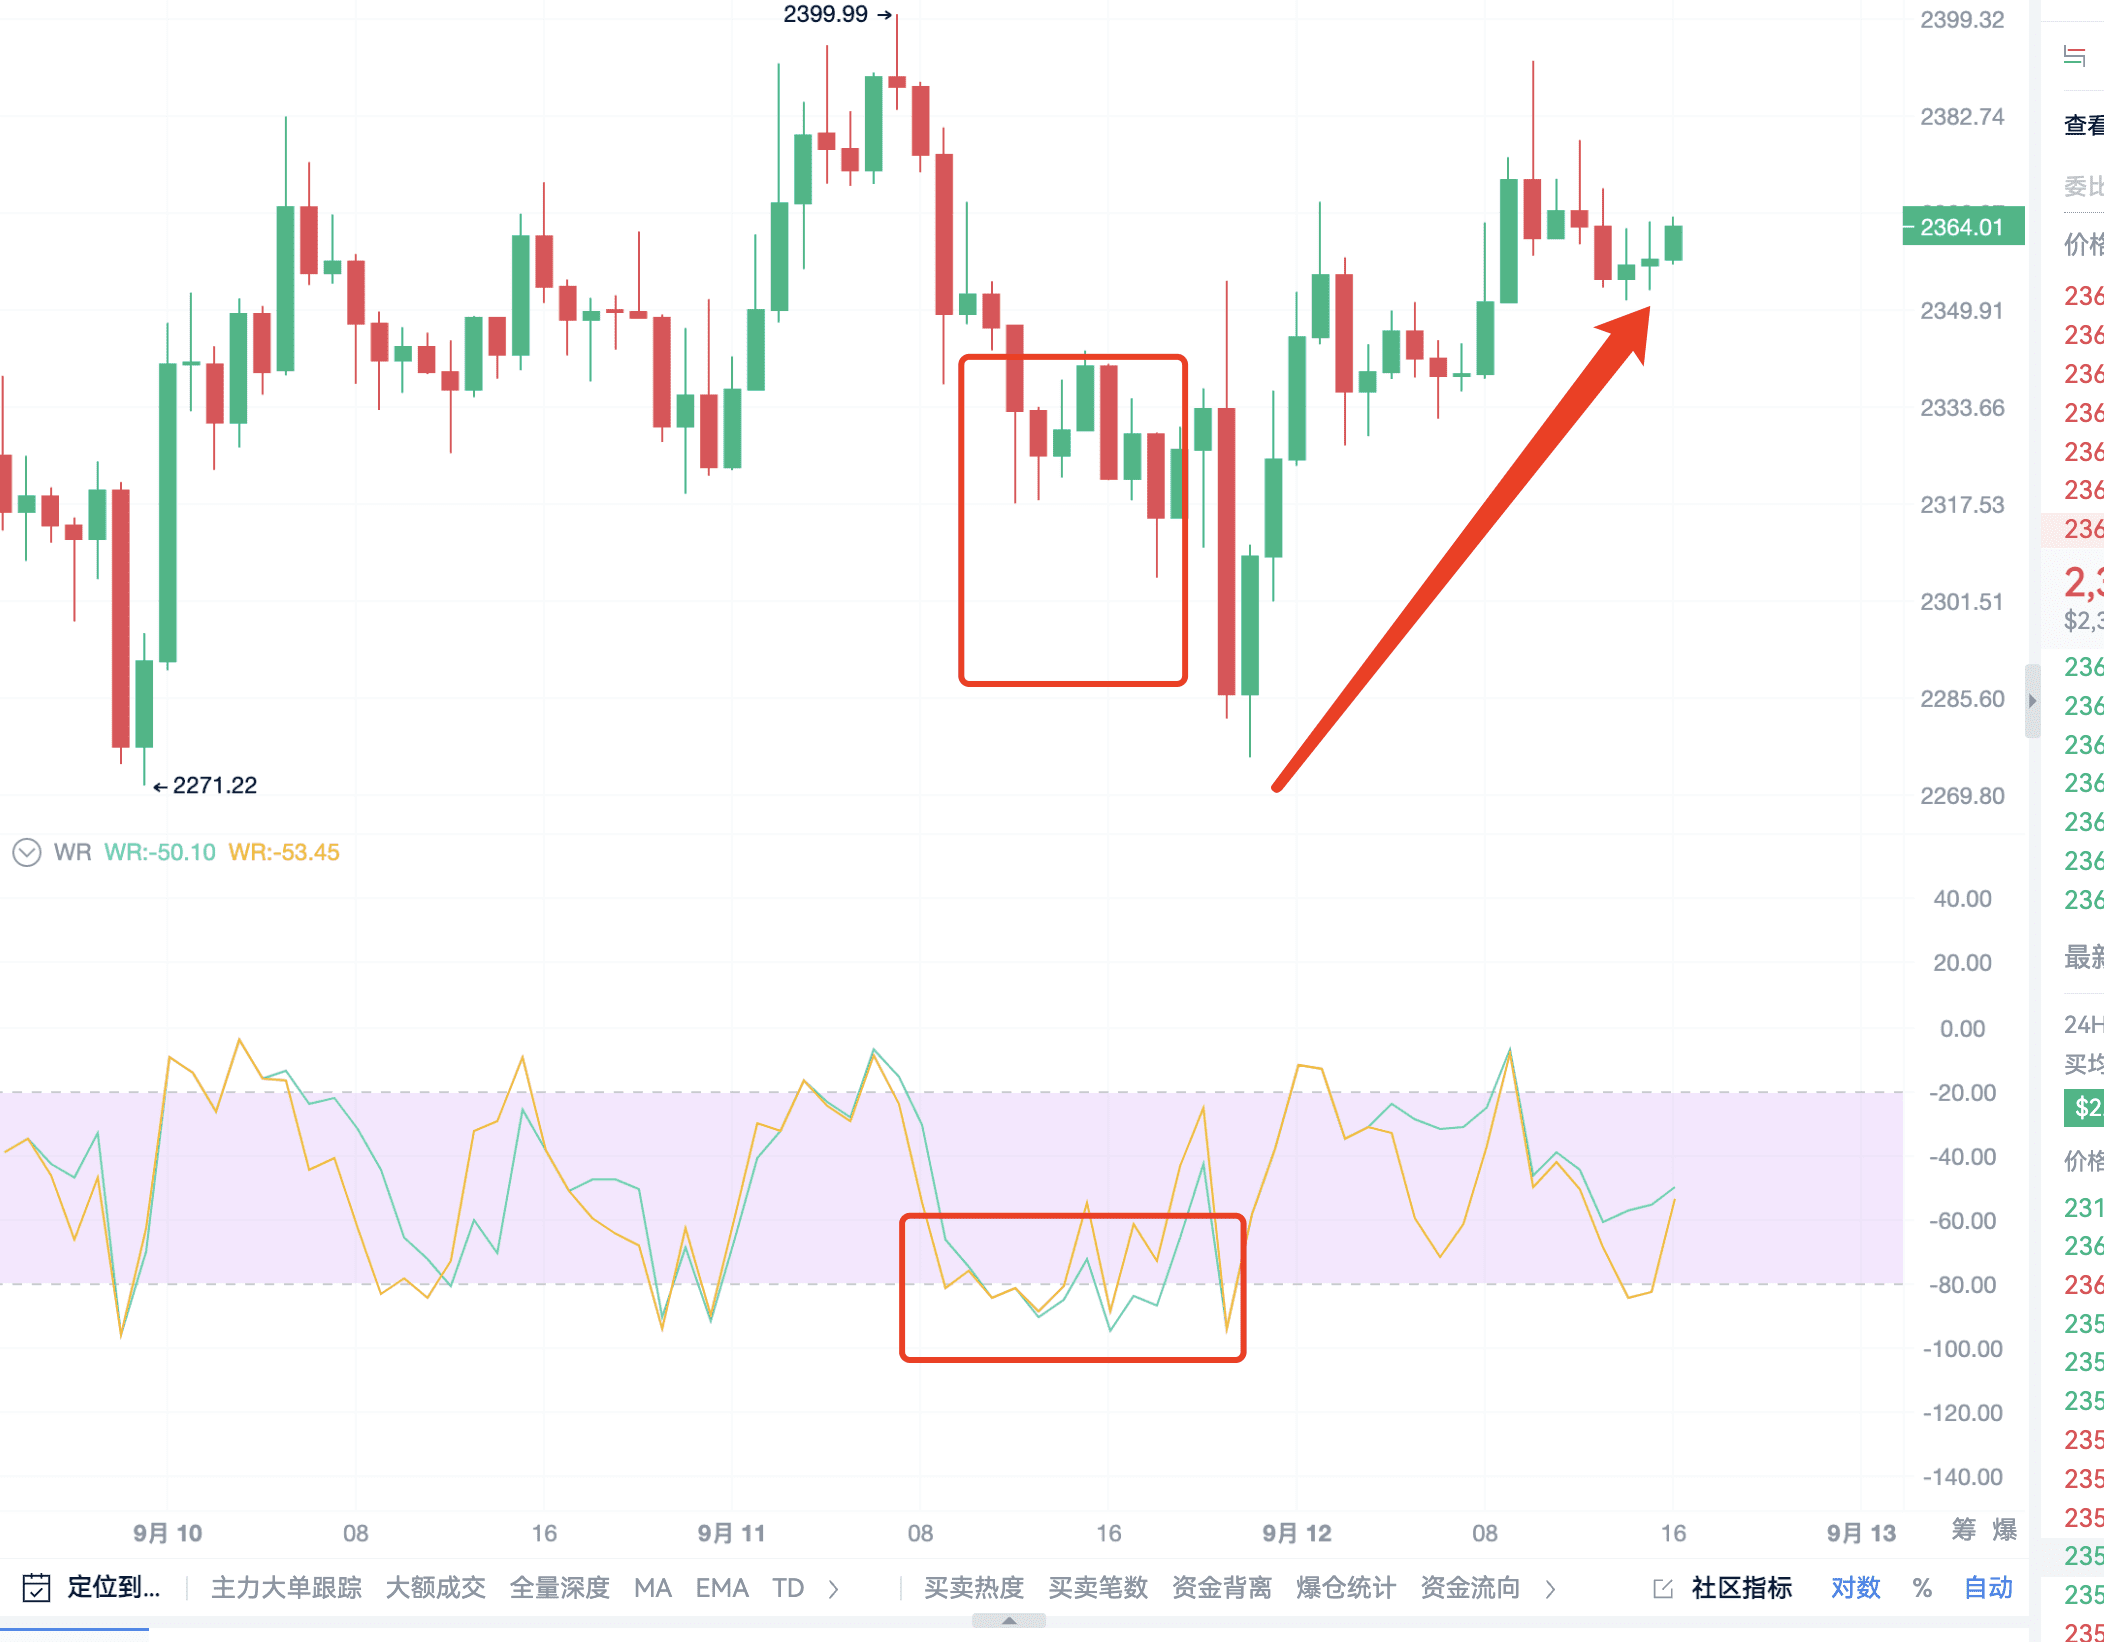
The 1-hour, 45-minute, and 90-minute timeframes are all acceptable. After hitting the bottom, it may be a sideways trend or a direct rebound surge. Therefore, it is necessary to analyze with multiple indicators. When you combine two to three technical indicators to look at together, the accuracy will be greatly improved. As an excellent investor, it is very necessary to learn to comprehensively use several technical indicators.
Method 3: Dual-line hitting the top and sticking together. Dual-line sticking together refers to the complete overlap of the two indicator lines: 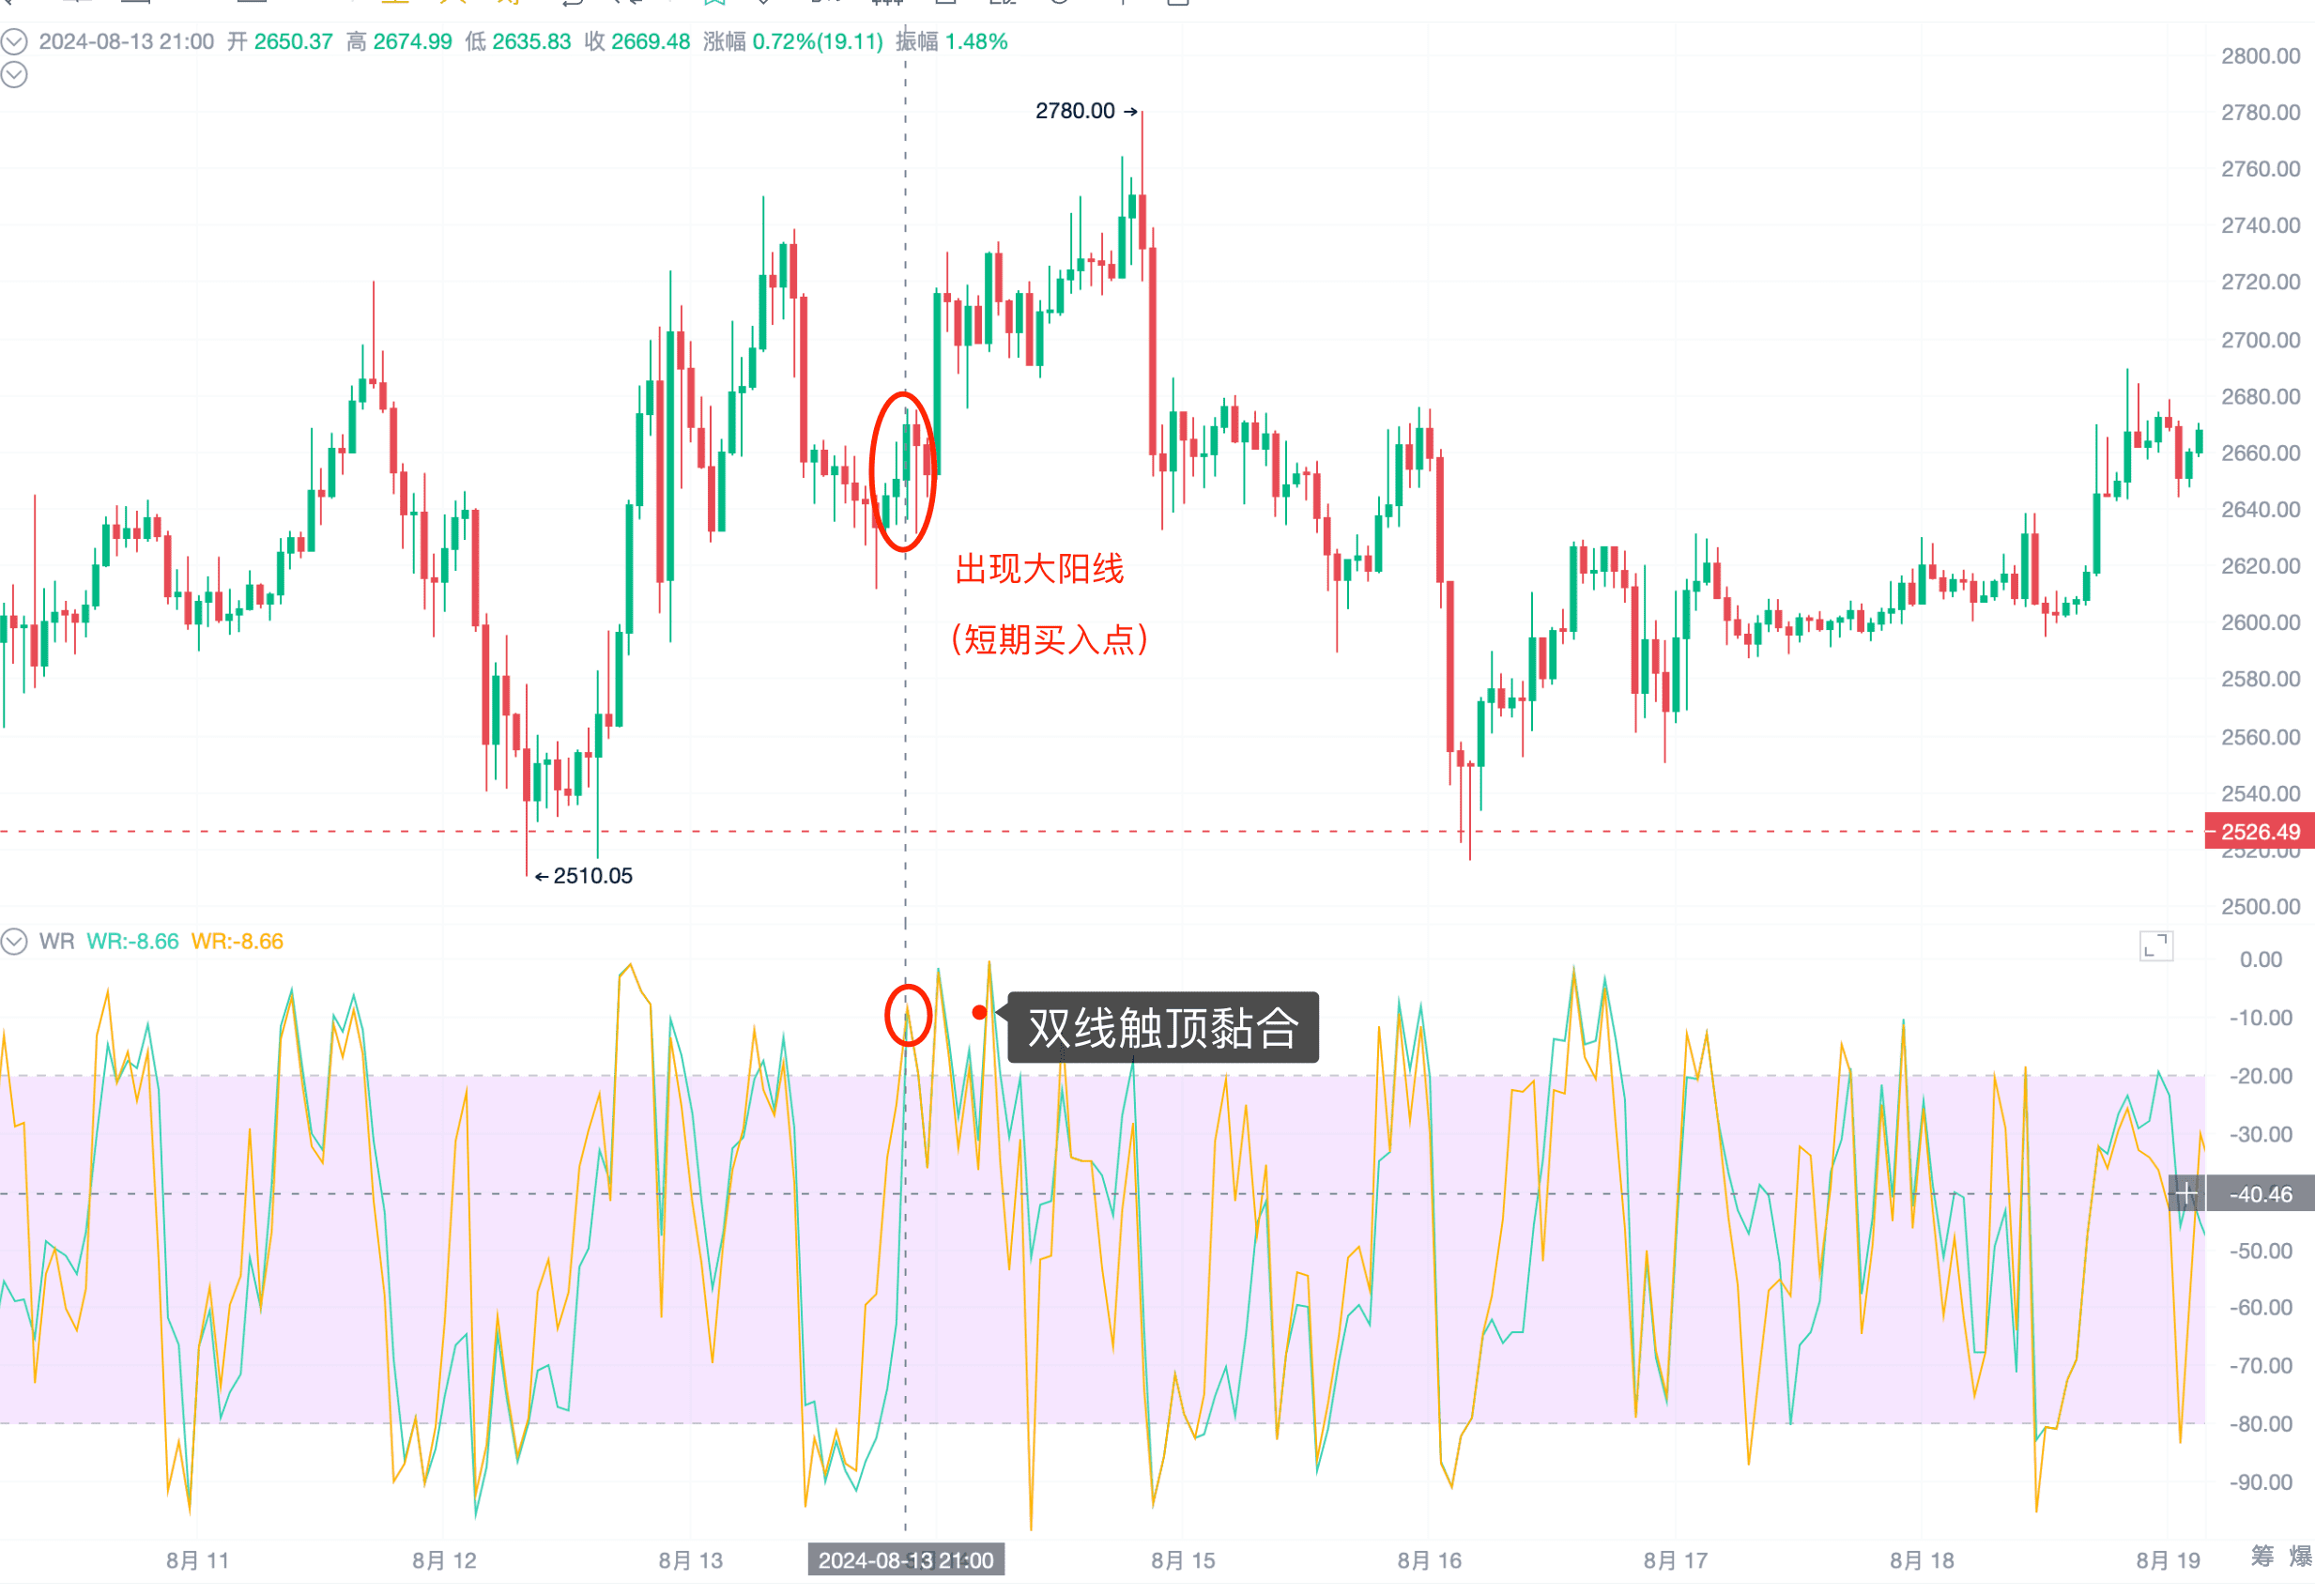
When the Williams Index is in the oversold area, after the two indicator lines stick together, if a large bullish candlestick appears and the indicator falls below -20, it is considered a short-term buying point and can be bought at the right time. This situation generally indicates that the short-term high and low prices are the same as the long-term high and low prices, indicating a potential bottoming rebound in the short term. When the Williams Index is in the oversold area, it indicates that the market price has dropped significantly and a reversal may occur. If the two lines stick together and the indicator line breaks above -20, it means that when WR sticks together in the overbought area and then rebounds and breaks through the -20 level, it indicates that the market may rebound from a low point. At this time, combined with the appearance of a large bullish candlestick, it confirms the market reversal signal, which is a good opportunity for short-term buying. Therefore, it is important to consider multiple signals, such as a large bullish candlestick: the appearance of a long bullish candlestick during the rebound process indicates strong buying pressure.
Due to the rapid fluctuation frequency of the Williams Indicator, errors are easily made. Therefore, combining the Williams Indicator with RSI can effectively improve accuracy.
One more point we need to pay special attention to is that it must be a "continuous multiple" occurrence of hitting the top to be a buying point.
In summary, three methods for observing the Williams Indicator:
- Continuous hitting the top, hitting the top at -20
- Continuous hitting the bottom, hitting the bottom at -80
- Dual-line hitting the top and sticking together, hitting the top/hitting the bottom
The above is all the content shared this time.
Thank you for watching. We hope that every AICoin user can find a suitable indicator strategy and create abundant wealth!
Recommended Reading:
For more live content, please follow the AICoin "AICoin - Leading Data Market, Intelligent Tool Platform" section, and feel free to download AICoin - Leading Data Market, Intelligent Tool Platform.
免责声明:本文章仅代表作者个人观点,不代表本平台的立场和观点。本文章仅供信息分享,不构成对任何人的任何投资建议。用户与作者之间的任何争议,与本平台无关。如网页中刊载的文章或图片涉及侵权,请提供相关的权利证明和身份证明发送邮件到support@aicoin.com,本平台相关工作人员将会进行核查。


