Deliver the way of trading and enjoy a wise life.

Daily Chart Analysis: On the daily chart, Bitcoin is getting closer to the upper channel line. The last contact was around August 21st. This time, above 65,000 - 66,000, it will become a relatively high-pressure zone.
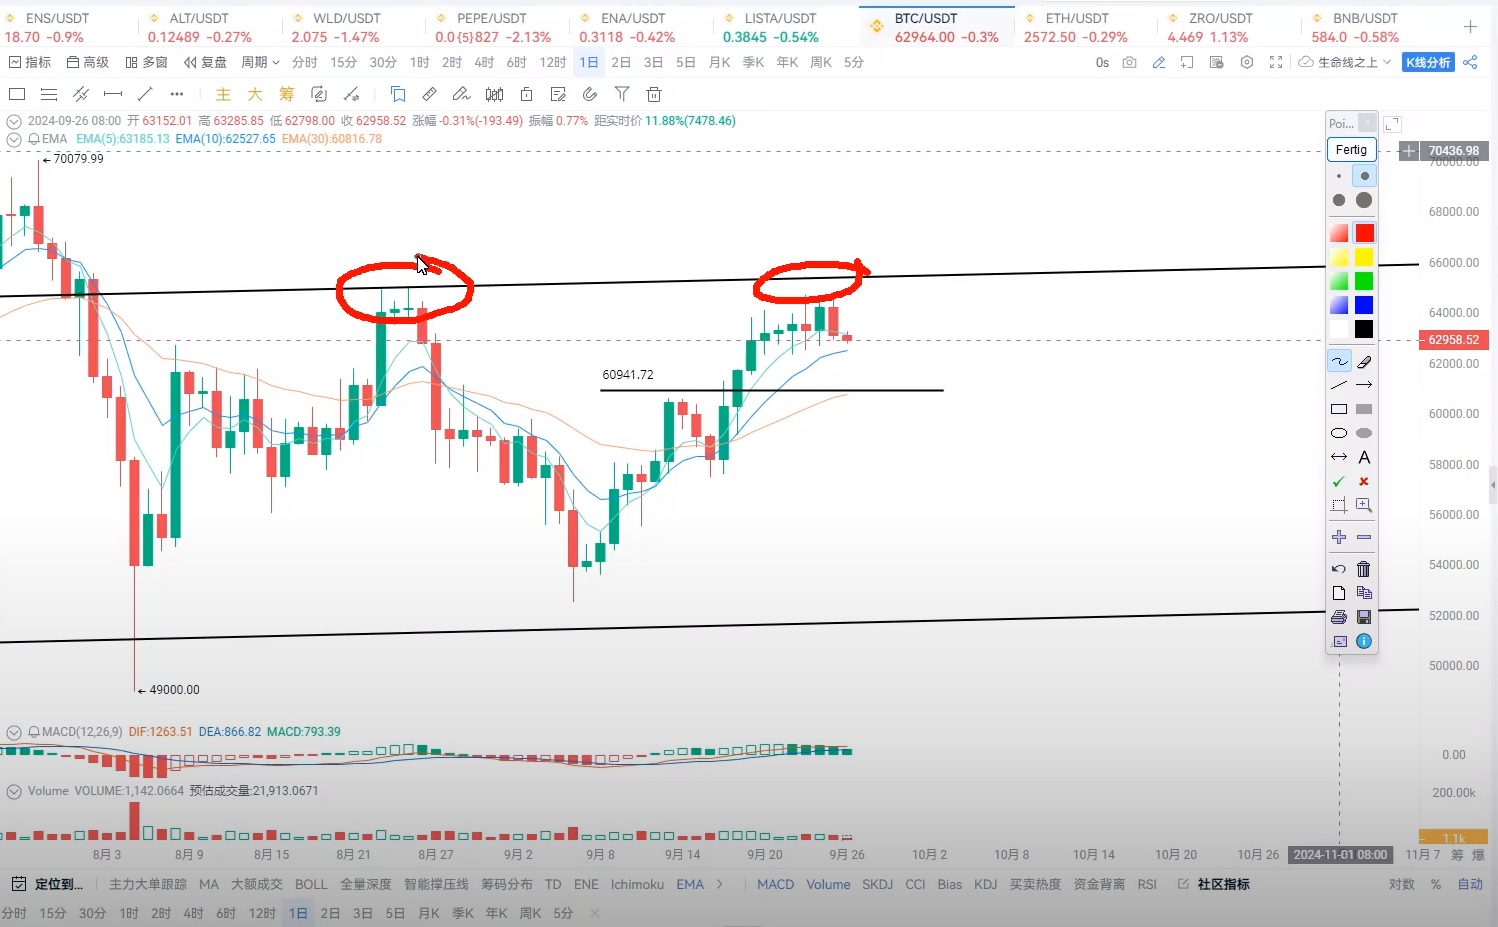
Looking at yesterday's closing situation of Bitcoin, it formed a bearish engulfing candlestick pattern. In fact, the price of Bitcoin has shown loose chips around 65,000 since September 20th. So, for the candlesticks, there are small bearish and bullish candlesticks, with many wicks above and below. This indicates a long and short divergence around 65,000, with selling pressure above and buying interest below. However, based on yesterday's candlestick pattern, the short-term superiority between bearish and bullish has emerged. Therefore, Bitcoin at this level may continue to pull back, and the price closed below the 5-day EMA, indicating a short-term bearish signal. Of course, if it is bearish, where will it go?

4-hour Bitcoin Price Trend: Looking at the 4-hour chart, we can see that the MACD indicator's energy column only showed a very small green energy column at the last golden cross, indicating that the bullish momentum has greatly weakened. Compared to the previous period, it is incomparable. However, the price has repeatedly hit new highs, leading to a continuous divergence pattern on the 4-hour chart.
During a continuous divergence, we can see that the price of Bitcoin has experienced a short-term pullback. The first target of the pullback can be connected by two high points and the lowest common denominator, and we will find that the first support for Bitcoin is around $62,800. So, this place will become a relatively low point for Bitcoin today or tomorrow, and it may also be the neckline of a double top structure. Therefore, if it cannot obtain effective support at this level, the price of Bitcoin may break through again and move to another place.
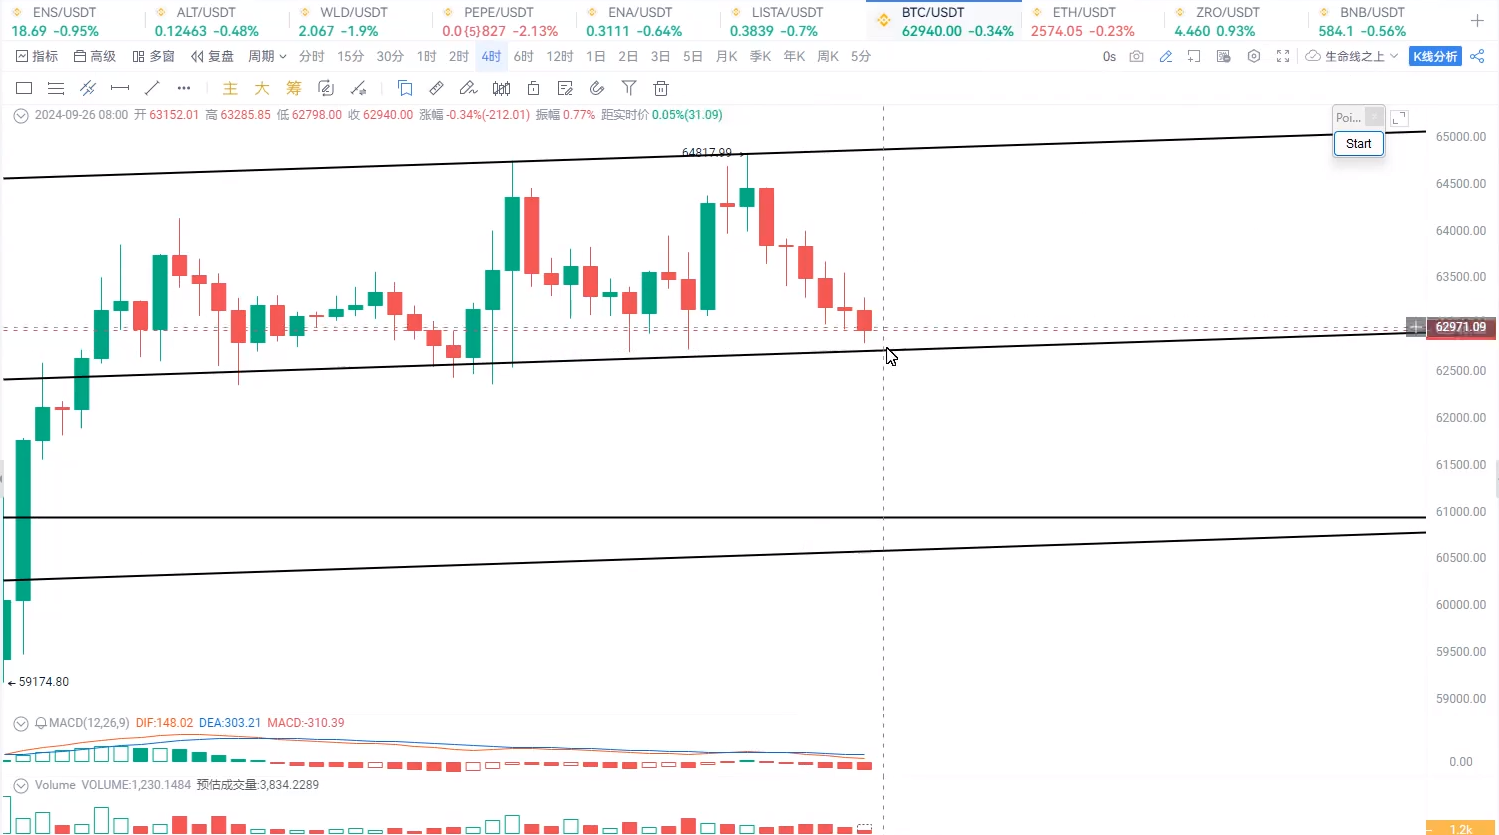
This place is also a channel. The position of the lower channel extension is $60,700. Of course, $60,700 is also an important entry point. Looking back, let's see what this place is. After Bitcoin's price reaches $62,800, if it can resist the downward trend directly, the price of Bitcoin may rebound. The extent of the rebound depends on the situation. If it can break through this level, the rebound will end. Therefore, there is short-term support at this level, but once it is broken, it will accelerate the decline.
Returning to what we just talked about, if Bitcoin goes to $60,700, what will it be? We can see that when Bitcoin's price broke through last time, there was a neckline. After the first attack to the neckline at $60,600, it started to fall and then broke through again. After the breakthrough, there was no decent pullback, so we cannot rule out the possibility of a downward retracement after the breakthrough. This retracement will be a very important support for Bitcoin, $60,600 - $60,700. This will be another opportunity for us to enter the market or add to our positions. This is the price trend of Bitcoin. If Bitcoin reaches this level, can it obtain effective support? Or what kind of position is it in on a larger time frame?

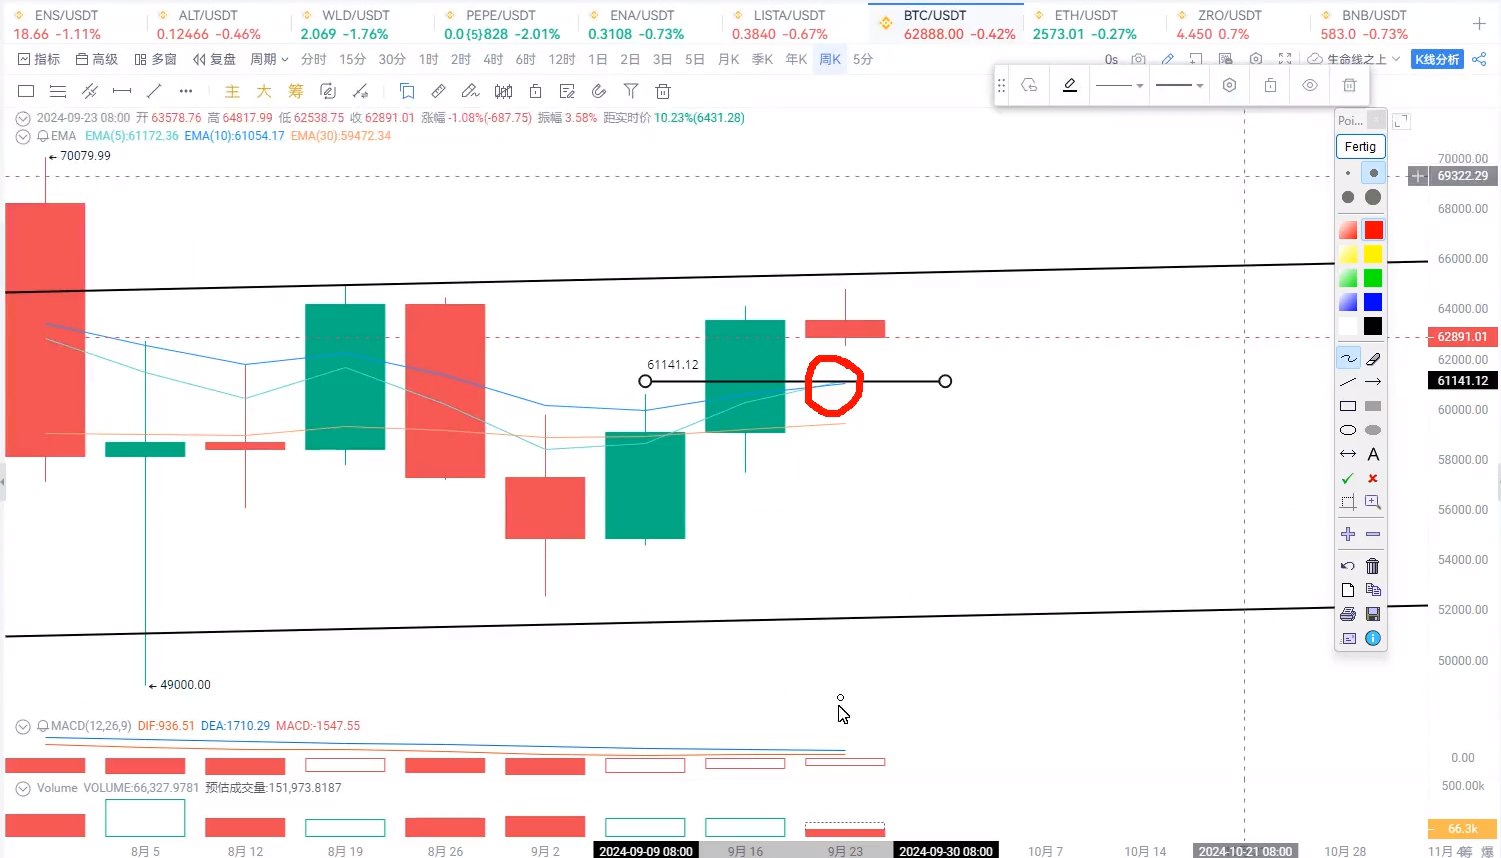
Let's go back to the weekly chart. As for Bitcoin on the weekly chart, we are focusing on the fact that there has been a golden cross between the 5-week and 10-week lines on the weekly MACD indicator and moving averages. So, in addition to $60,700, the first important support for Bitcoin is at the 5-week and 10-week lines, at $61,100. This is also a support level for the 5-week and 10-week lines.
So, looking at Bitcoin comprehensively, its support level is between $60,700 and $61,200, and this area will be our point for adding to our positions. If your position is less than 30%, you can consider adding to it when Bitcoin retraces to $60,600 - $61,100. Or wait for Bitcoin to effectively break through upwards, or stabilize at $66,000, which can also be an important moment for us to add to our positions. If this moment has not arrived, do not act blindly, and do not overweight. If it arrives, it will create a new uptrend.
In terms of overall position, it is currently recommended to control it within 30%. If Bitcoin retraces to $60,600 - $61,100, you can control the position within 50%. Or wait for Bitcoin to effectively break through upwards, or stabilize at $66,000, which can also be an important moment for us to add to our positions. If this moment has not arrived, do not act blindly, and do not overweight. If it arrives, it will create a new uptrend.
免责声明:本文章仅代表作者个人观点,不代表本平台的立场和观点。本文章仅供信息分享,不构成对任何人的任何投资建议。用户与作者之间的任何争议,与本平台无关。如网页中刊载的文章或图片涉及侵权,请提供相关的权利证明和身份证明发送邮件到support@aicoin.com,本平台相关工作人员将会进行核查。


