BTC continues to oscillate at a high level below 65000, maintaining this level for a week. Although it was quickly pushed down near 64800 twice, the support at 62300 has been effective. After a morning pullback to 62600, it continued to rebound. Unemployment claims and the PCE price index will be announced at 8:30 tonight.
Ether retraced to above 2500 on the 4-hour platform and continued to rebound. The bullish momentum has weakened, but the trend has not changed temporarily. The ETH/BTC exchange rate mentioned yesterday that it would pay attention to the opportunity for continued rebound after retracing to 0.04. It continued to rebound after hitting a low of 0.0452 in the morning.
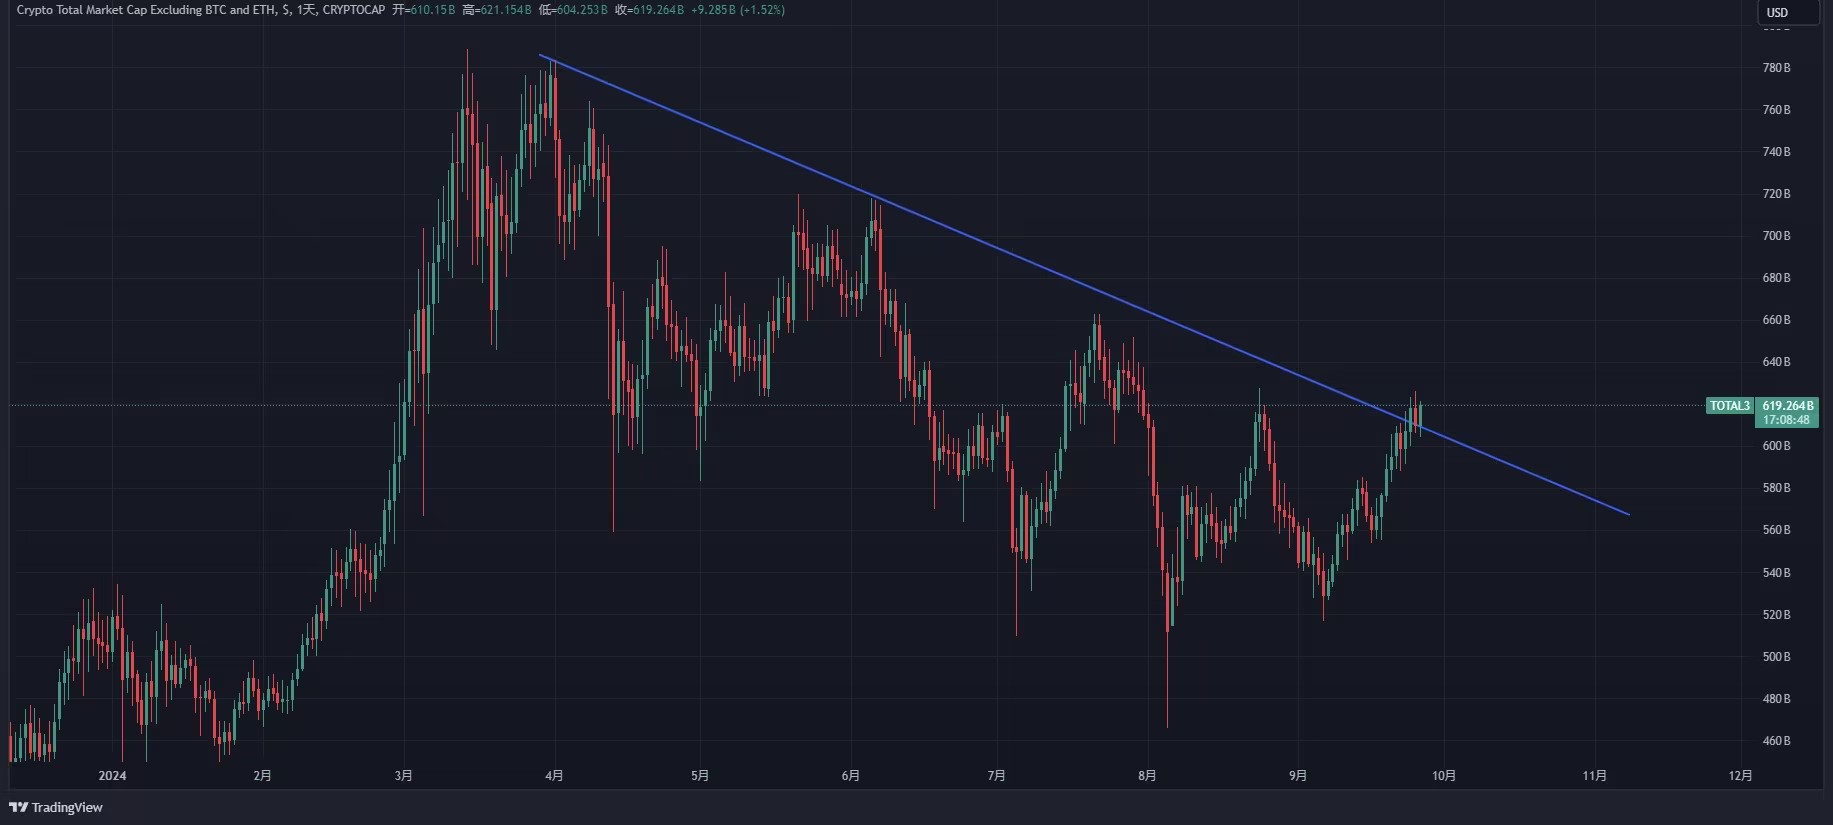
On the K-line chart of the total market cap of altcoins, the downtrend line has been broken and a combination of two positive candles and one negative candle has appeared. If the closing of this week confirms the breakthrough, the altcoin season has arrived. Therefore, the previous warning about altcoins should not be taken lightly. As for whether it will be affected by the retracement of Bitcoin, it definitely will, but the trend of Bitcoin is still intact for the time being.
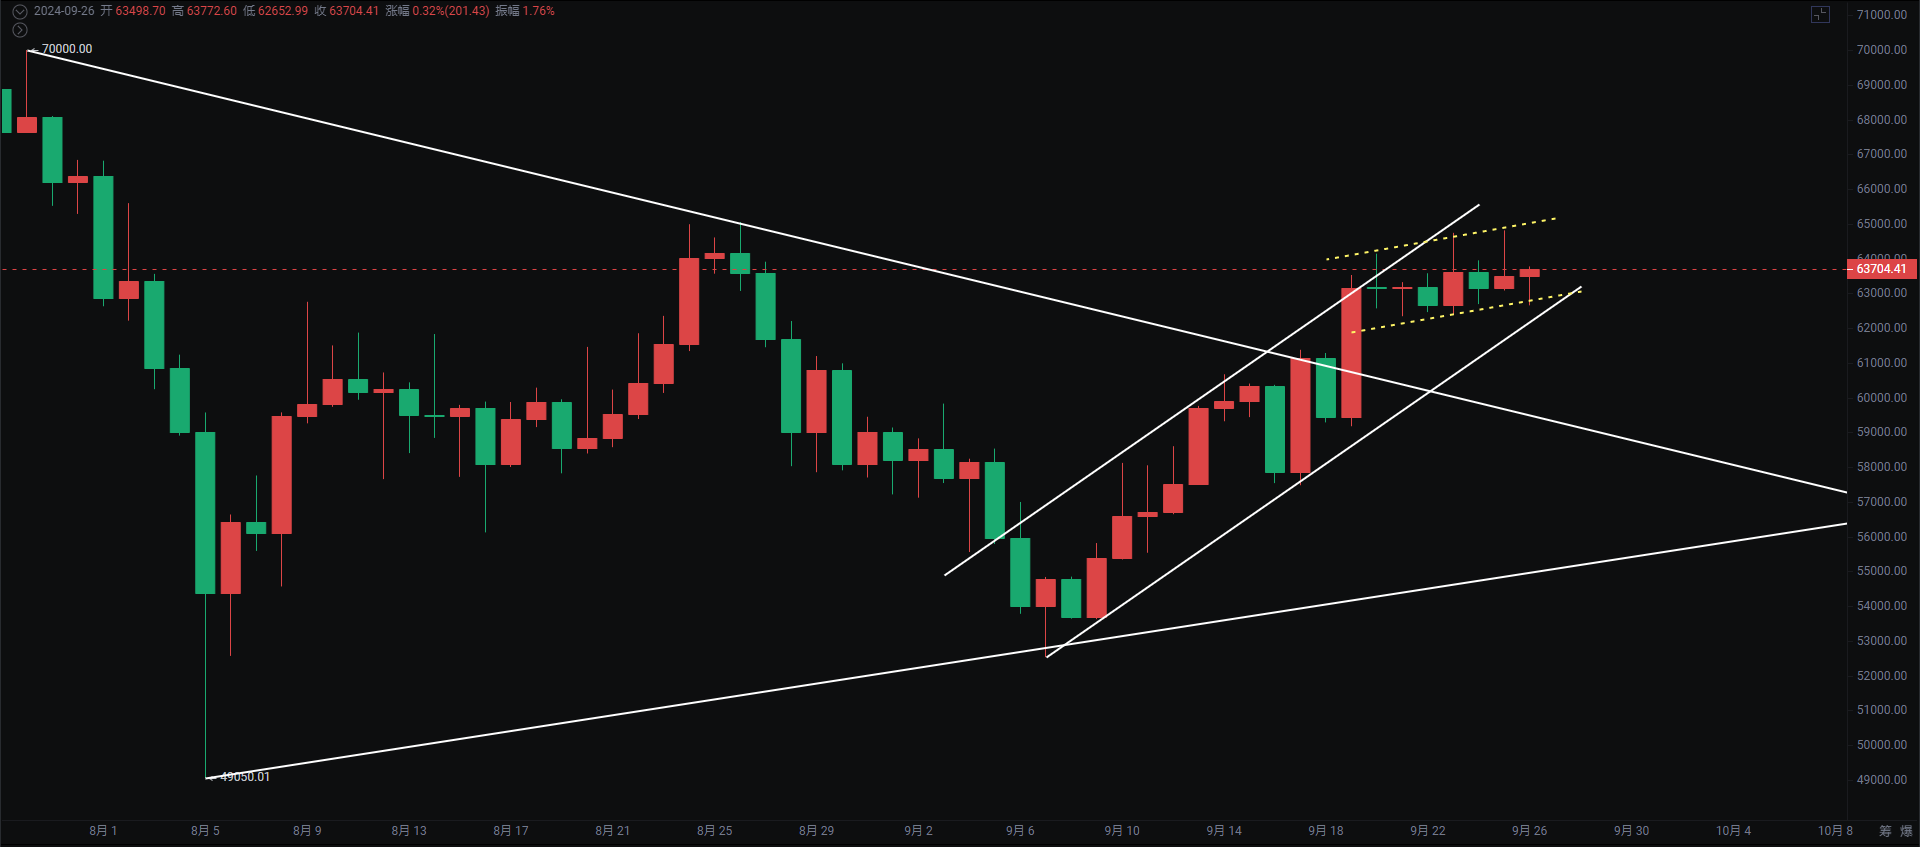
Bitcoin The daily chart shows narrow fluctuations, but the candles have an upward trend, and the technical indicators are dull. If it continues to maintain the weekly chart, it is highly likely to close with a doji star above the BOLL midline (which is a bullish signal).
On the 4-hour chart, it is still operating within the upward channel, with the key support at 62300. As long as it continues to maintain above this level, there is a chance to continue the upward trend. If it falls below, it will need to retrace to 59600-60600. The potential hidden bullish divergence on the 4-hour chart will determine how long the oscillation can be maintained.
Support:
Resistance:
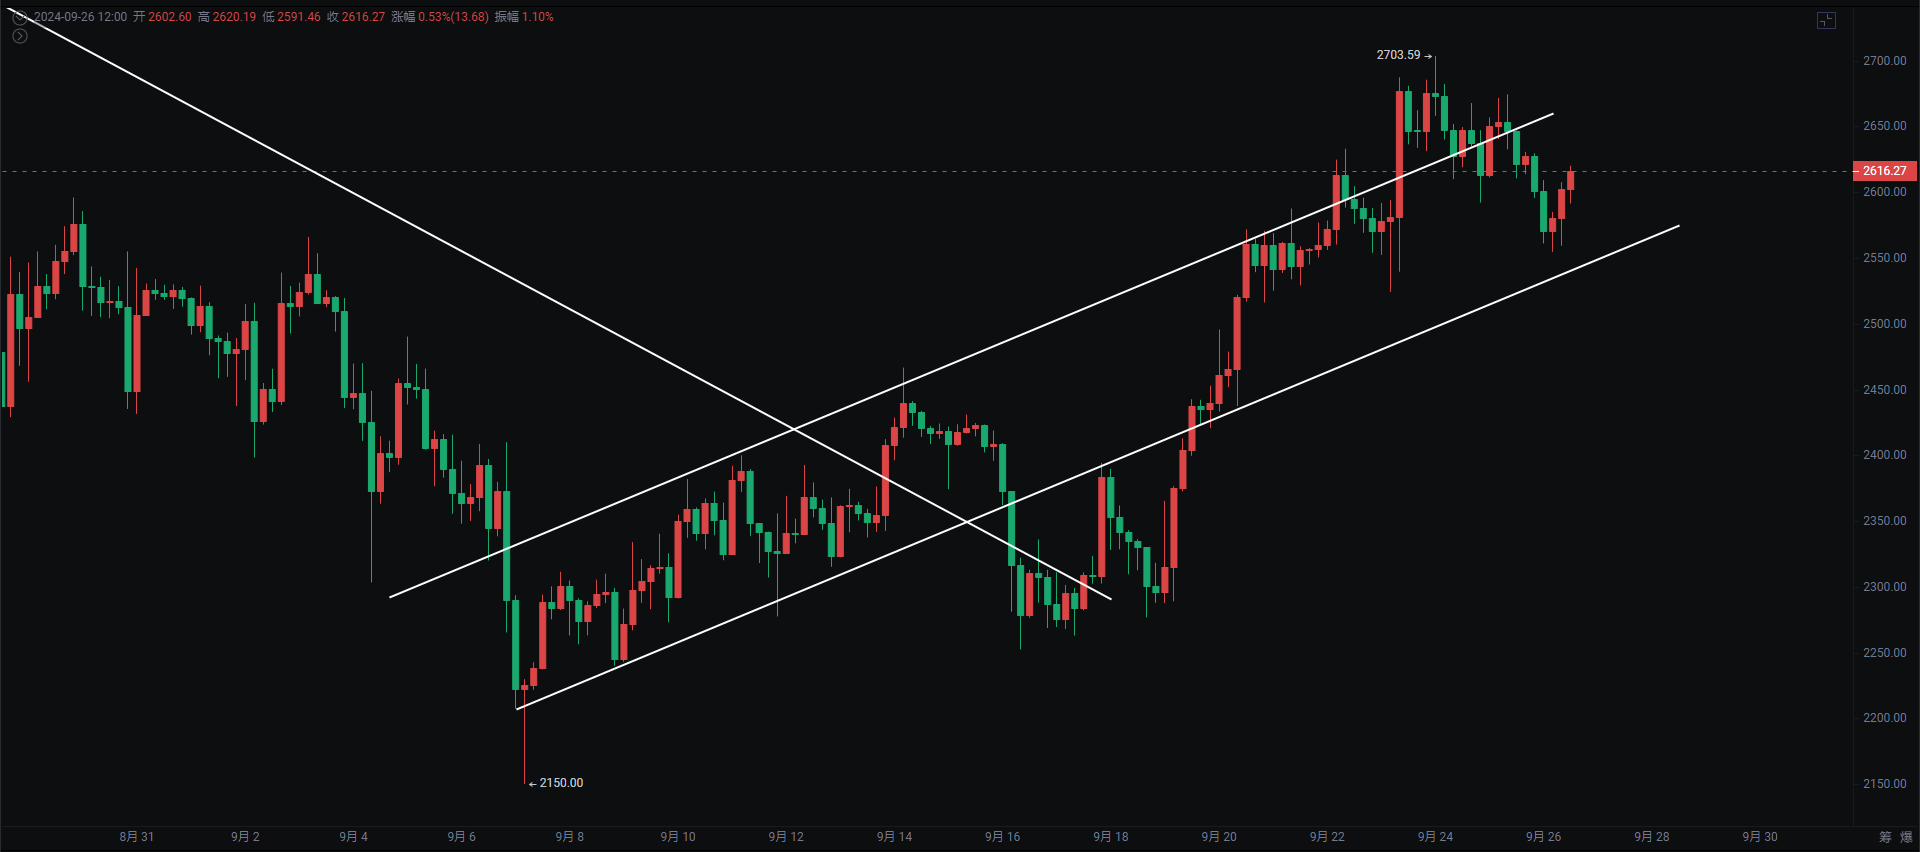
Ether Ether is still completing the bat pattern, with TP1 focusing on the pressure at 2800 and a high probability of a pullback. TP2 is at 3300-3400.
From the perspective of the candlestick pattern on the daily chart, 2500 is the area of transition between bullish and bearish trends. It will only turn bearish if this level is broken. Seize this opportunity for wealth since the altcoin season.
Support:
Resistance:
If you like my views, please like, comment, and share. Let's navigate the bull and bear markets together!!!
The article is time-sensitive and is for reference only, with real-time updates.
Focus on K-line technical research and win-win global investment opportunities. Official account: 交易公子扶苏 (Trading Prince Fusu)

免责声明:本文章仅代表作者个人观点,不代表本平台的立场和观点。本文章仅供信息分享,不构成对任何人的任何投资建议。用户与作者之间的任何争议,与本平台无关。如网页中刊载的文章或图片涉及侵权,请提供相关的权利证明和身份证明发送邮件到support@aicoin.com,本平台相关工作人员将会进行核查。