Spreading the Way of Trading, Enjoying a Wise Life.

Bitcoin has now reached sixty-three thousand, which is a very critical level. The closing last week was a bullish piercing of three, crossing the thirty-week, five-week, and ten-week moving averages, and the five-week and ten-week formed a golden cross above the thirty-week moving average. Generally, we believe this is the early stage of a bullish trend, so at this level, is it possible to see a relatively large upward trend?
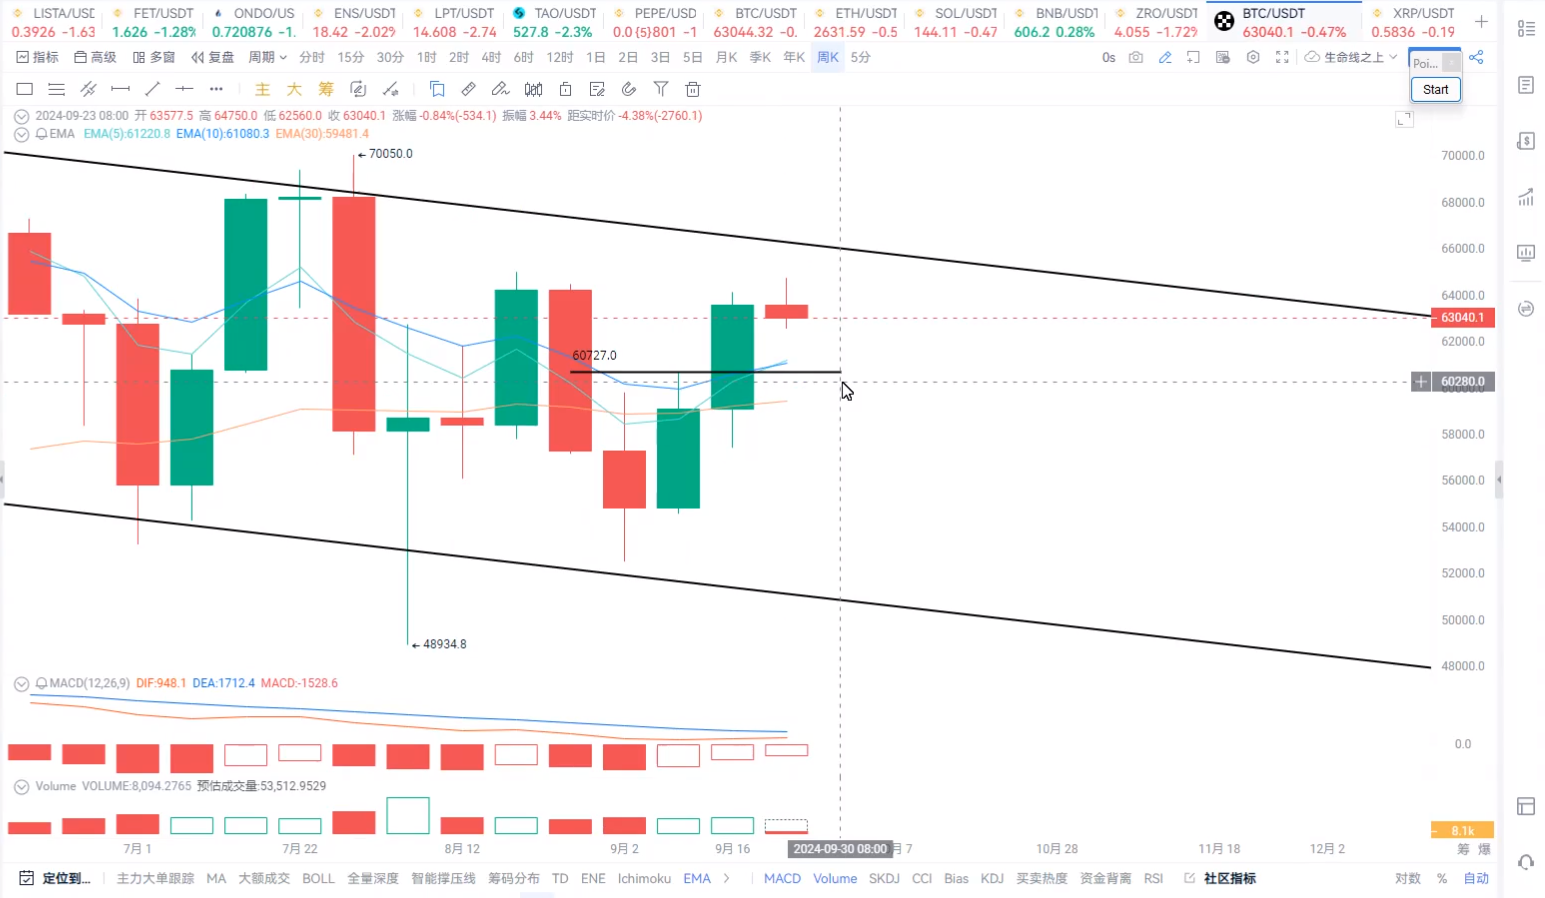
My view is that it is possible. After entering the market earlier, if Bitcoin retraces to around $60,700 near the five-week and ten-week moving averages, it can be considered as an important point for replenishing your position. Of course, if you don't have a position, you can also consider entering at the $60,700 level. Your stop-loss point must be below the thirty-week moving average, which would signal the end of this trend. It is also crucial whether the MACD indicator slowly starts to turn upwards and whether it can form a golden cross. If a golden cross is formed, it indicates that a resonant upward trend will form at the weekly chart level, leading to a significant upward surge, marking the start of a new major uptrend. If it fails to form a golden cross, or if the fast line crosses below the slow line at the 0 axis, then it signifies the failure of the new trend, and it is highly likely to continue to decline. The upper price trend line or the upper boundary of the descending channel at $66,000 and $65,000 is crucial. Is there a possibility that Bitcoin will break through $66,000 and the corresponding MACD indicator will also form a golden cross?
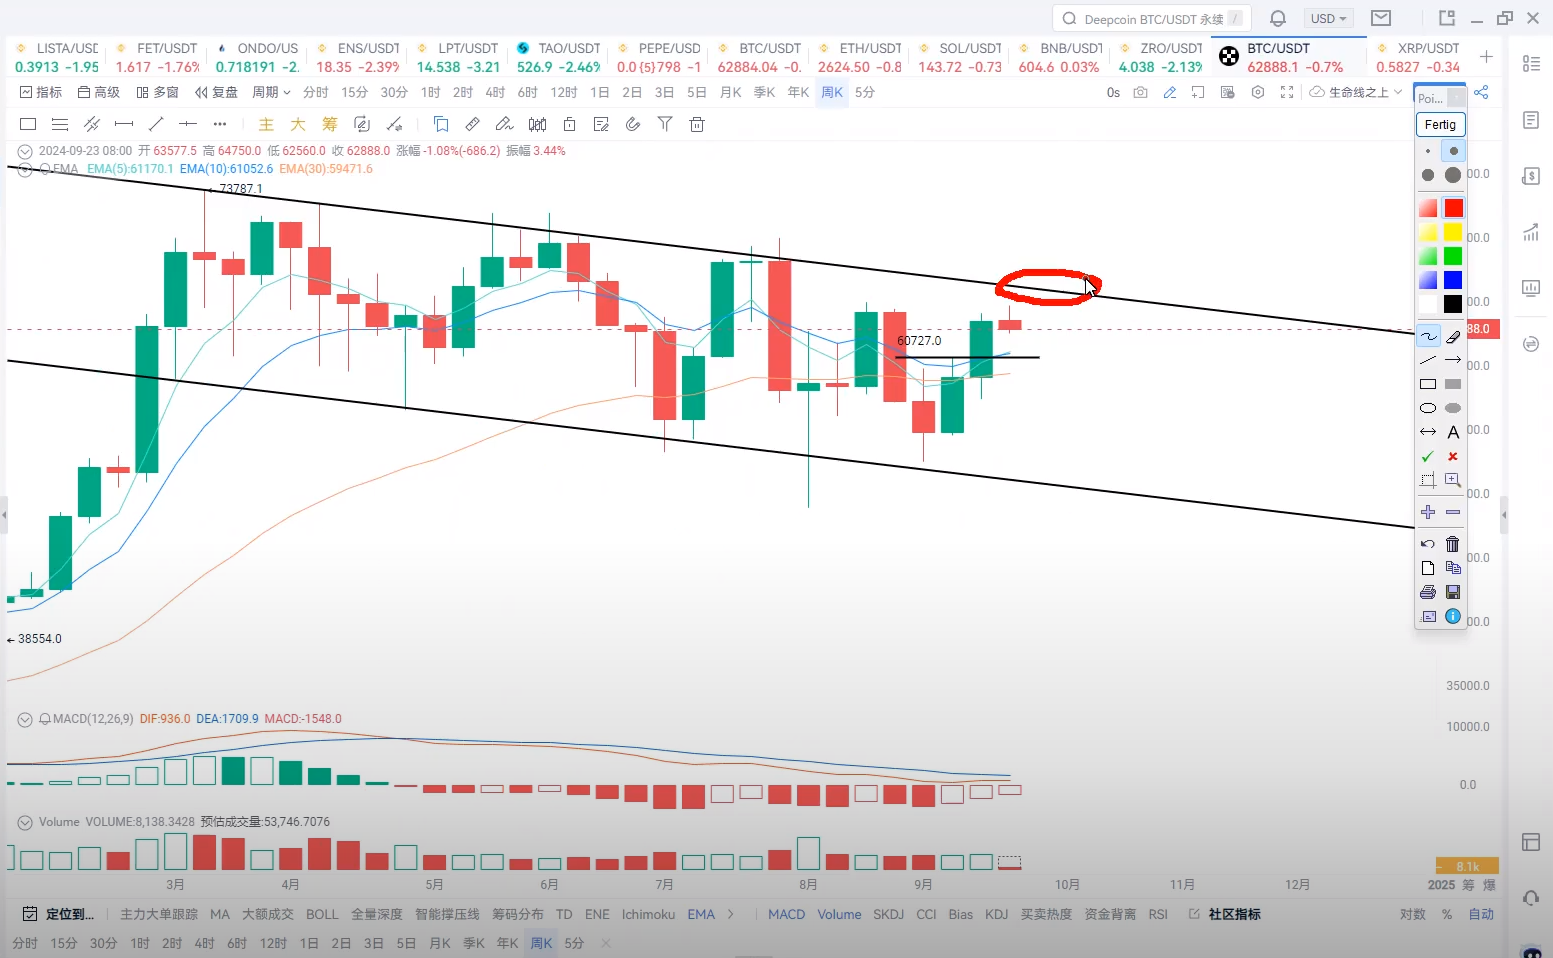
In fact, this possibility is very high. We need to pay close attention to the next two weeks, at the end of September and the beginning of October, to see if Bitcoin can reach this level smoothly. From a historical perspective, every October's Golden Week, excluding bear market phases, has seen a good breakthrough. In October 2020, after the National Day, the price of Bitcoin surpassed $10,000, marking the start of a bull market. In October 2023, after the National Day, it ushered in a bull market. So, is it possible for 2024 to follow the trend of 2020-2023 and see an upward breakthrough after the National Day? It is worth looking forward to. Of course, before this happens, it is important to control your position, as the trading market is not certain. Even in a market you are optimistic about, it may move in the opposite direction to your expectations. This is the unpredictability of trading and life. Do not be too attached or invest too much energy and effort into what you consider to be your entry point. If you go all in at this point, it is highly likely to lead to a disaster. The overall position can be controlled at 3-5% before the breakthrough, and after the breakthrough, consider increasing the position to 6% or more, otherwise maintain the current position.

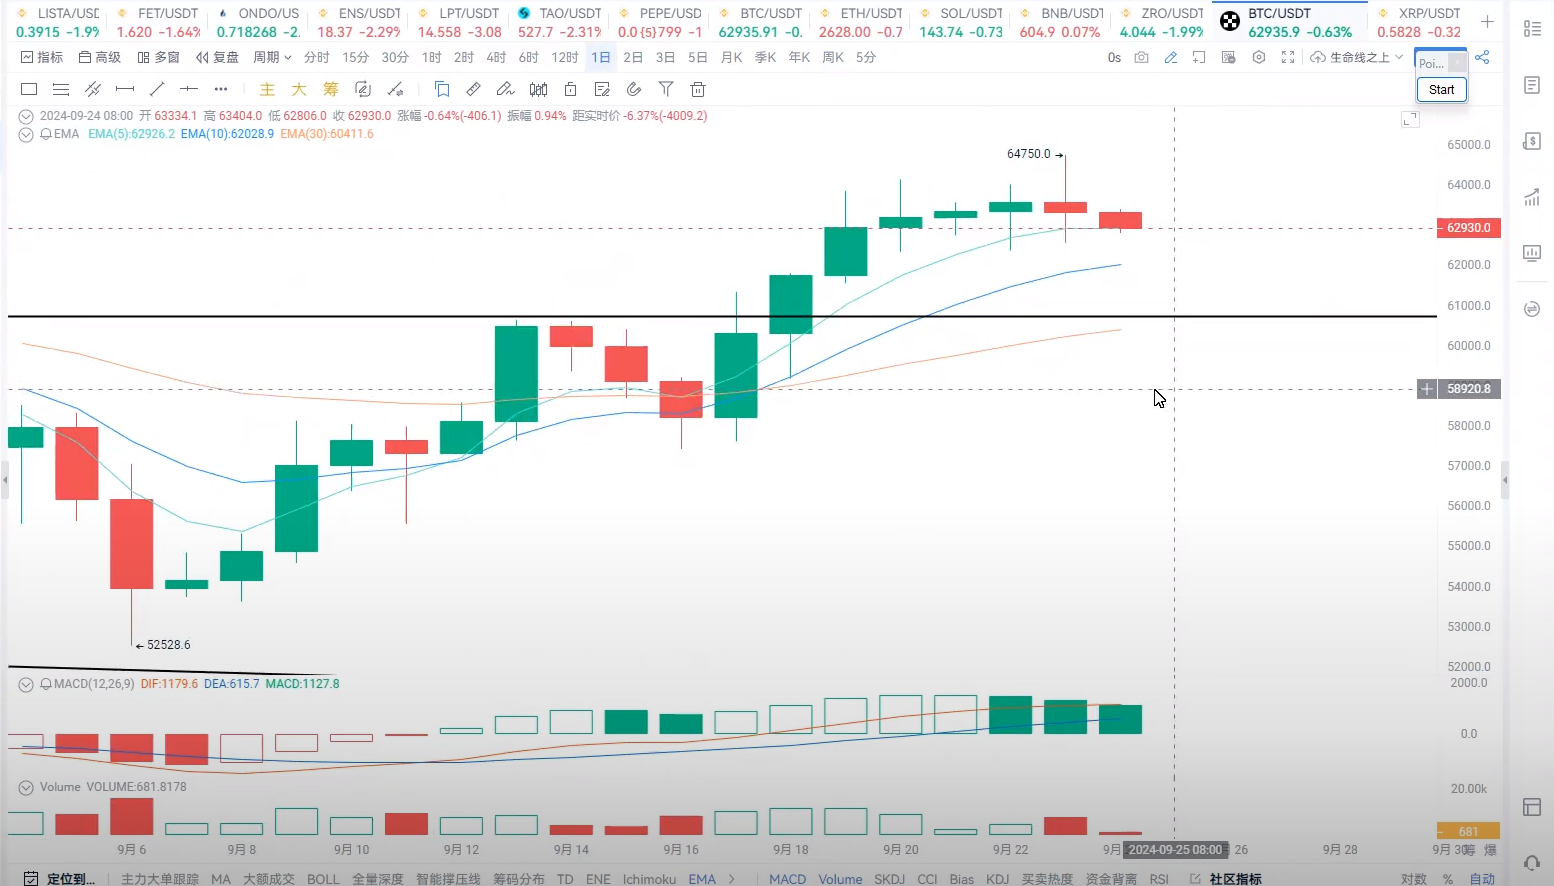
At the daily chart level, the price has also experienced a special candlestick pattern for some time, indicating that the bulls at the $66,000 - $65,000 level have already shown signs of weakening, and the upward momentum is somewhat insufficient. A Bitcoin retracement may be inevitable!
So where would be a suitable retracement level? Let's look at the price trend at the hourly chart level. From the hourly chart level, we find that Bitcoin has formed a bearish divergence at the top.

Looking at the two-hour chart will provide a clearer picture. The price made a new high, but the corresponding MACD indicator did not make a new high, and the area and height of the energy column did not exceed the height and area of the first appearance, indicating that the momentum at this level is still insufficient, and Bitcoin is facing a retracement.
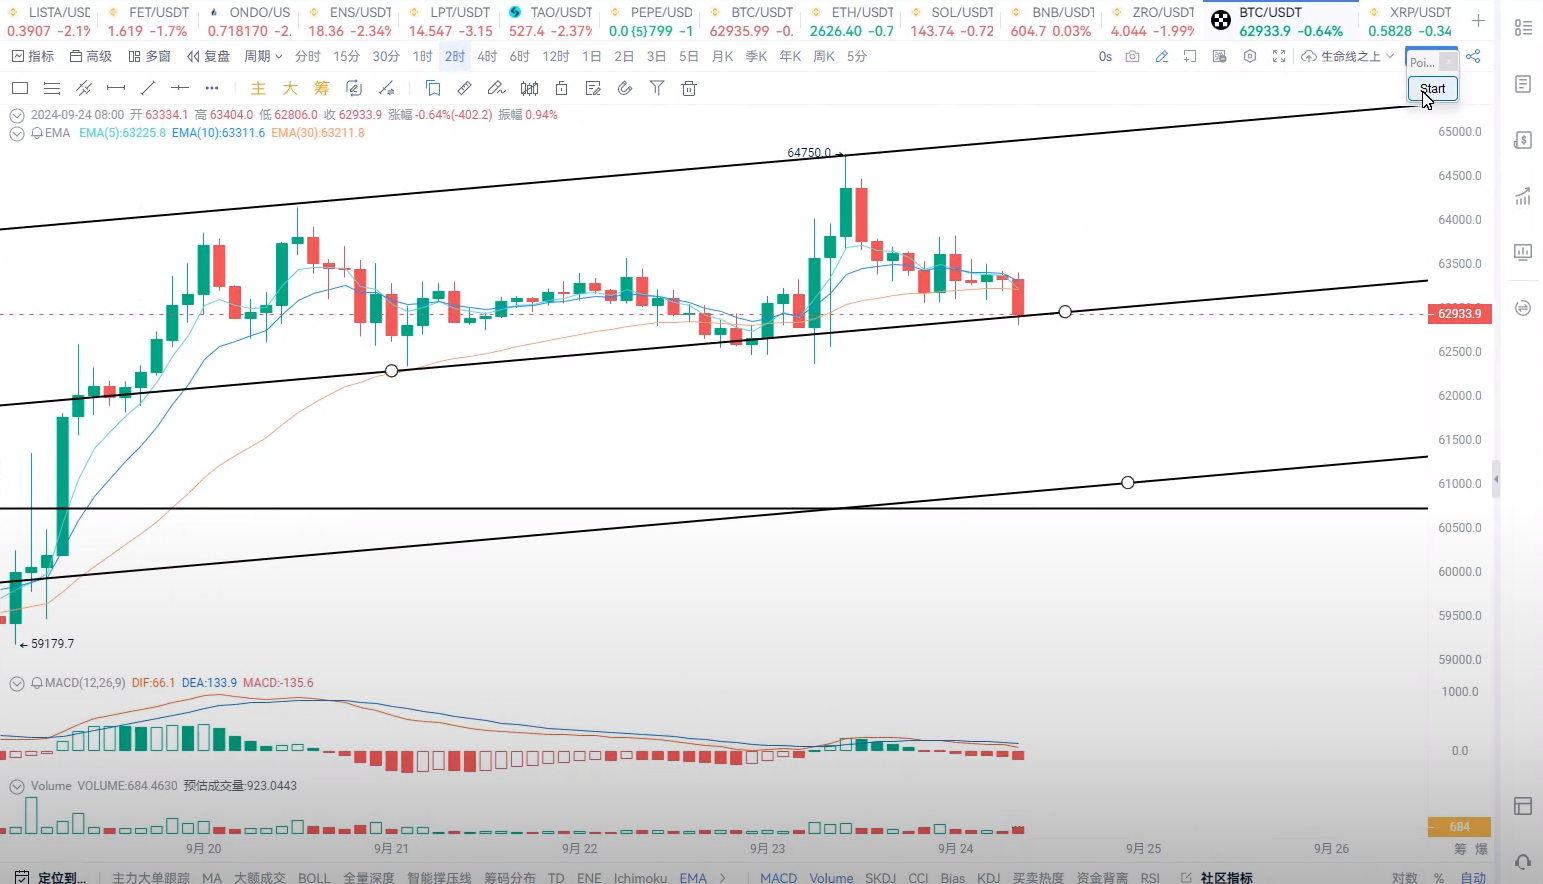
Retracing from $64,000 to $62,700, which is today's target. If it breaks below the channel's lower boundary, the next target below is at $60,700. This is where the five-week and ten-week moving averages at the weekly chart level are located, making it an ideal entry point. If it effectively breaks below this level, the situation will become very bad. This is a very important logic that I remind everyone to control their positions to prevent a downward breakthrough. So, if it retraces to the $60,700 level, can you consider replenishing your position or entering again? Of course, at this point, if it can confirm a rebound or a bottom, you can also increase your position. Of course, if it breaks below, you should exit. This point is both an opportunity and a risk, so everyone should handle it on their own. In the trading process, it is important to be extremely cautious and not too aggressive!
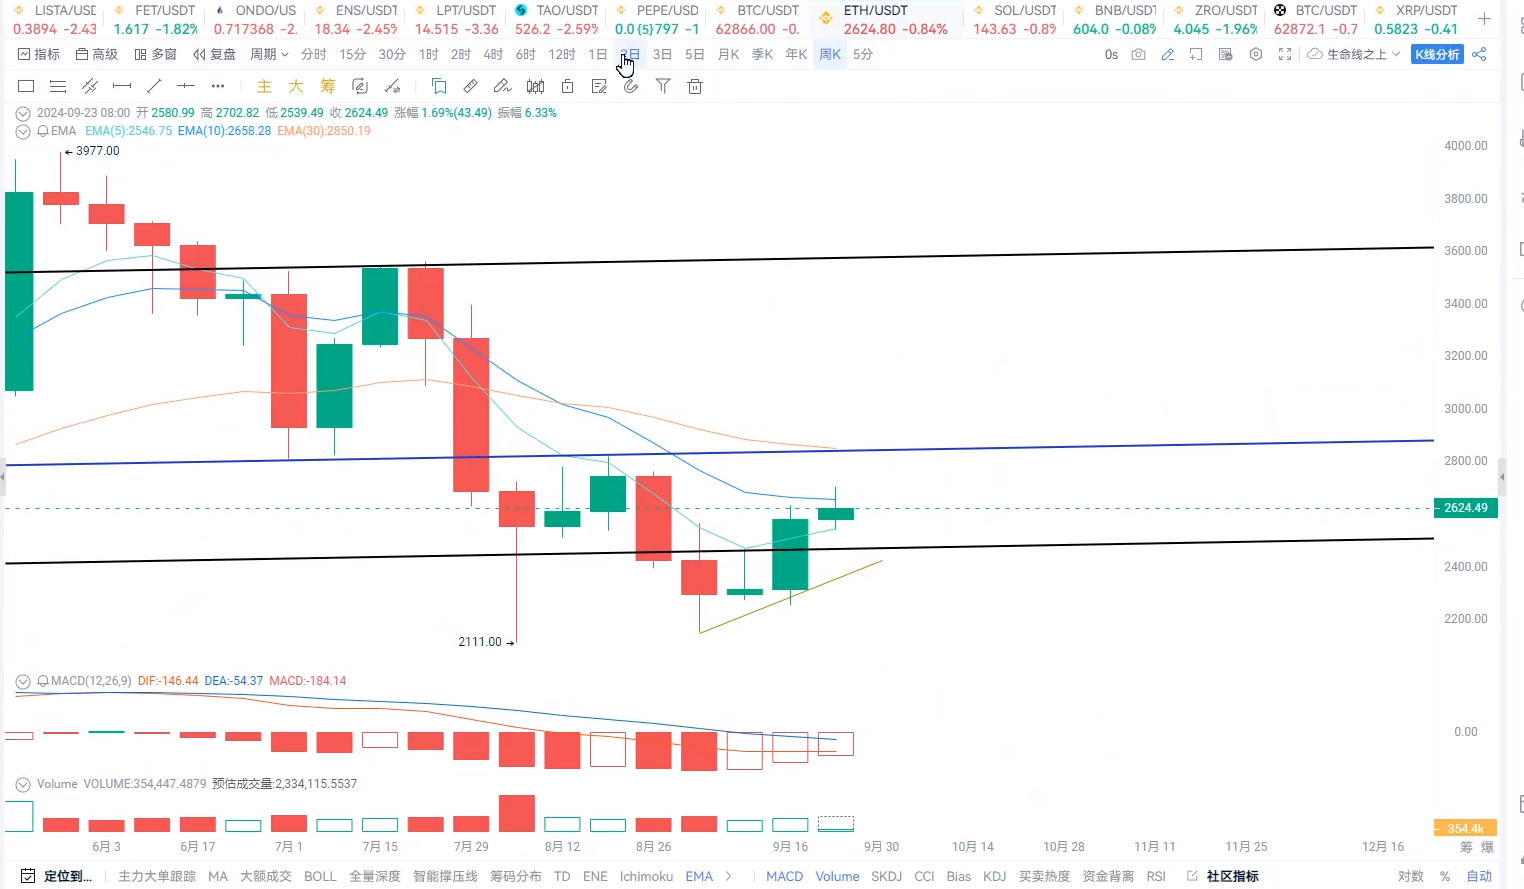
Bitcoin's price is leading the upward surge, while Ethereum is currently showing a form of corrective rise. It rose from $2,400 to $2,700. From the daily chart level, it also broke through the neckline of the "N" pattern. So, when it retraces to the neckline of the "N" pattern, you can consider replenishing your position, with the upper target at $2,840.
You don't need to watch the market every day. It may not be a good thing to watch the market at this stage. After entering the market, be patient and hold until the trading signal appears again.
免责声明:本文章仅代表作者个人观点,不代表本平台的立场和观点。本文章仅供信息分享,不构成对任何人的任何投资建议。用户与作者之间的任何争议,与本平台无关。如网页中刊载的文章或图片涉及侵权,请提供相关的权利证明和身份证明发送邮件到support@aicoin.com,本平台相关工作人员将会进行核查。