Coin Circle Liying: The bullish trend of Bitcoin at 9.24 remains! Ethereum's cup-shaped pattern emerges! How to deal with short-term fluctuations? Latest market analysis
Article release time 2024.9.24----07:00
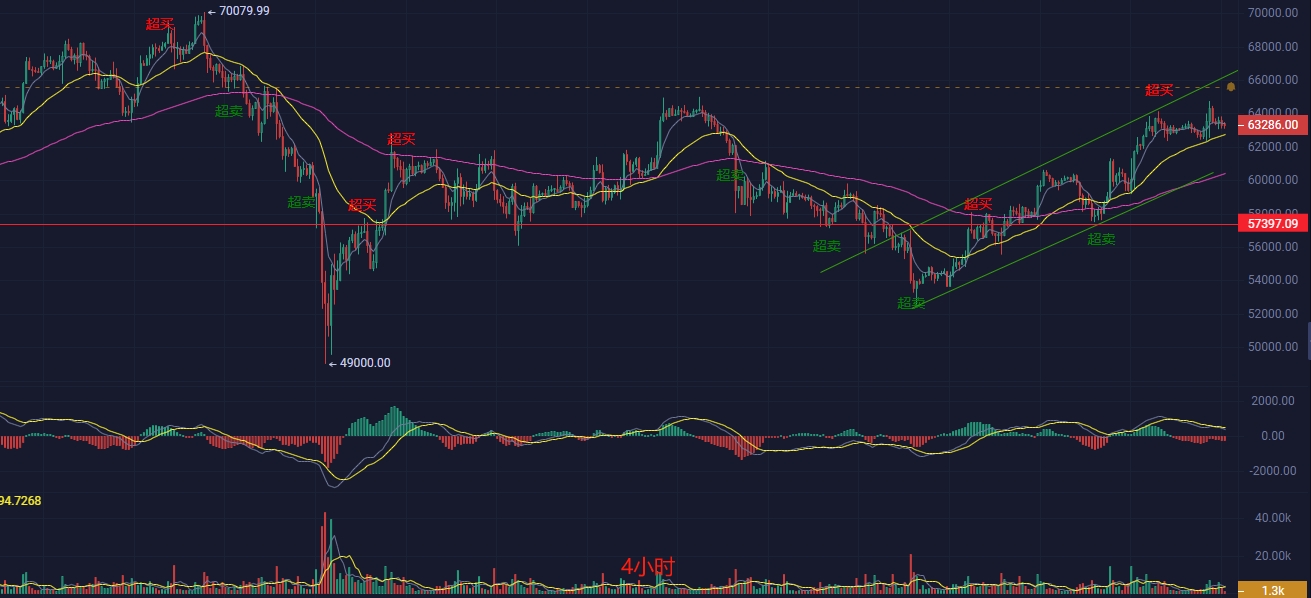
Bitcoin has started a high-level consolidation period, with the bulls being blocked at the 65,000 integer mark. The bullish trend at the large level remains unchanged, and a sideways trend has appeared in the short term. Currently, the four-hour K-line pattern fluctuates within the range of 63,000 to 64,000, forming a relatively stable box consolidation pattern. From 08:00 to 12:00 on the 23rd, there was a clear long upper shadow line, indicating effective resistance above according to Liying's judgment from the market.
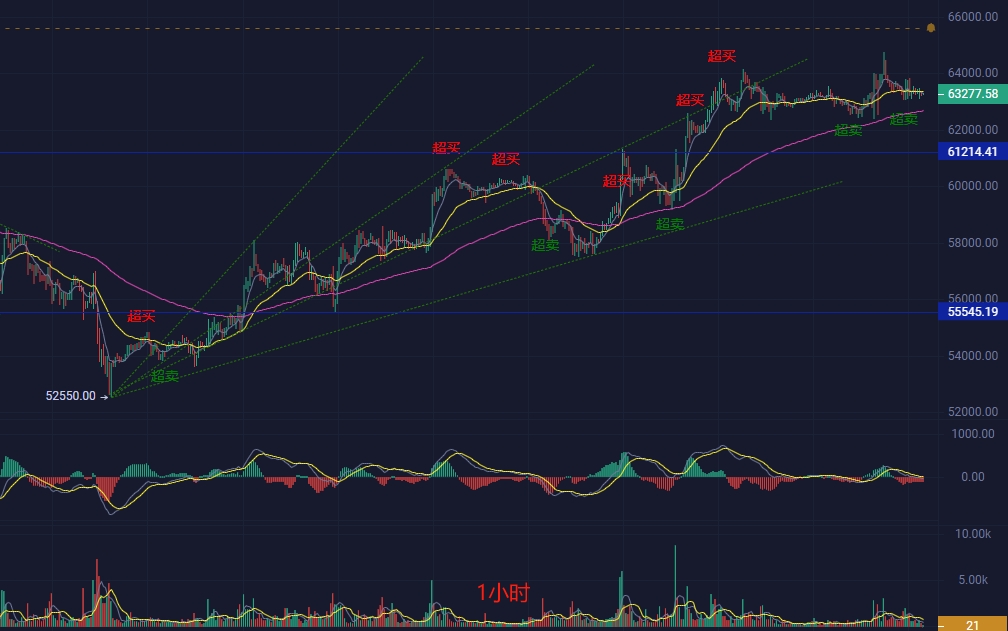
The MACD technical indicator is below the zero axis, but the DIF and DEA are gradually approaching, showing signs of a golden cross, indicating a possible demand for a rebound in the short term. The RSI is currently around 54.3, indicating a neutral to slightly bullish sideways market sentiment. The EMA trend indicator shows a bullish arrangement, but the long-term trend is still positive. In the short term, the sideways trend is basically confirmed, with strong resistance above and some support below. The strategy suggests flexible and changeable conventional thinking, shorting on rallies and longing on dips.
Today's reference points: Trend (sideways)
Long at 63,000, defend at 62,500, stop loss at 62,000, target at 64,500
Short at 64,500, defend at 65,000, stop loss at 65,500, target at 63,000
Ethereum
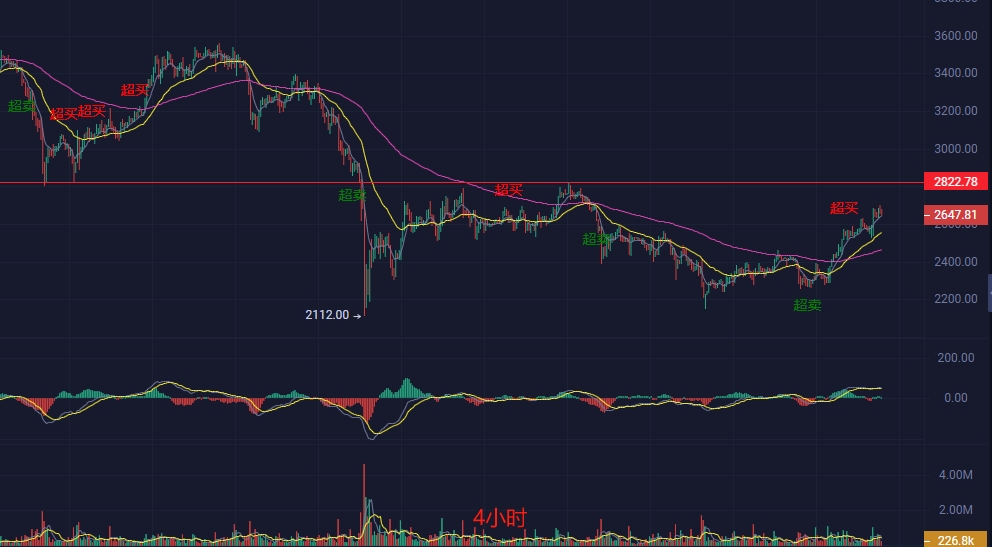
Ethereum has shown a cup-shaped closing pattern at the large level, indicating an increased probability of challenging the 2820 resistance level. After two consecutive attempts to break through 2700, it has fallen back. Currently, the four-hour K-line pattern fluctuates within the range of 2600 to 2700, forming a oscillating consolidation pattern. On the 23rd at 08:00, a long positive line appeared, followed by several K-lines showing high-level oscillation.
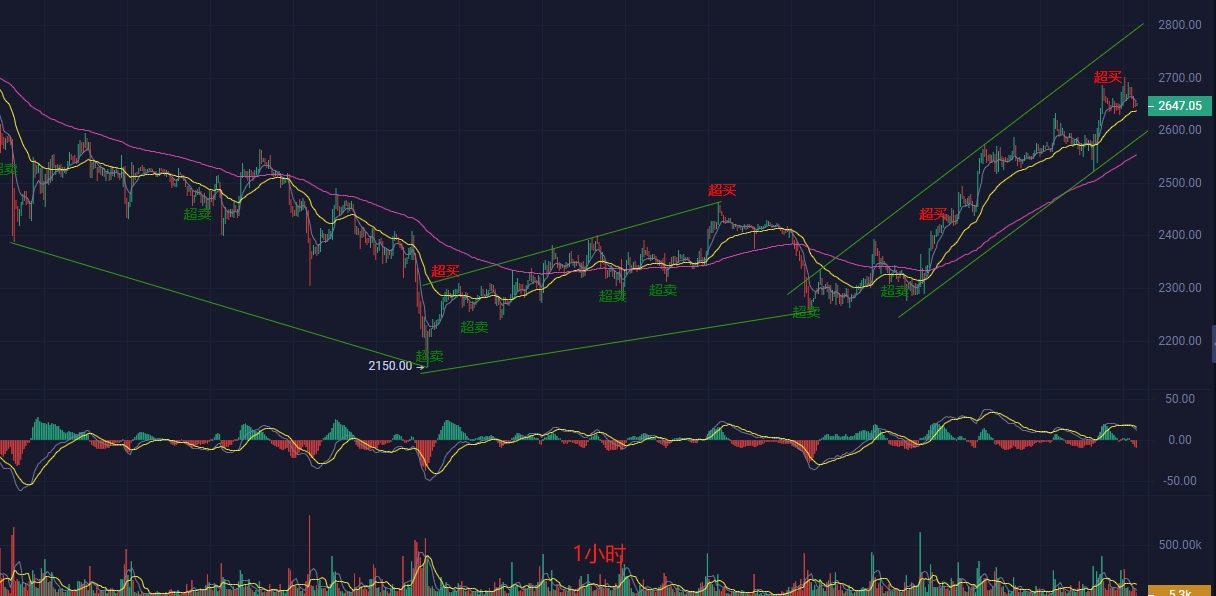
The MACD technical indicator: The current DIF and DEA are both positive, and the MACD histogram shows strong bullish momentum, but there are signs of weakening, increasing the probability of a sideways trend. Pay attention to the key support point. The RSI14 is currently at 64.7, indicating a risk of a pullback. EMA7 is very close to the latest price, which may provide support; EMA30 and EMA120 are diverging upwards, indicating a bullish trend in the medium to long term, with a short-term sideways trend.
Liying's latest reference points for today (sideways)
Long at 2620, add position at 2560, stop loss at 2520, target at 2700
Short at 2700, add position at 2800, stop loss at 2830, target at 2600
The content of the article is time-sensitive and is for reference only. Take your own risks.

The above analysis by Liying is based on market data and trend analysis from the market, for reference only and does not constitute investment advice. For the reference of family members. Over the past decade, Liying has continuously explored and experienced hundreds of different types of digital assets. In this process, Liying has experienced the brilliance of the bull market and the dimness of the bear market, accumulating numerous valuable experiences and profound lessons. As a female trader who has been struggling in this challenging field, Liying feels a responsibility to share her insights and hopes to help others with dreams to find their own position in this unpredictable market and embark on their own journey to success.
免责声明:本文章仅代表作者个人观点,不代表本平台的立场和观点。本文章仅供信息分享,不构成对任何人的任何投资建议。用户与作者之间的任何争议,与本平台无关。如网页中刊载的文章或图片涉及侵权,请提供相关的权利证明和身份证明发送邮件到support@aicoin.com,本平台相关工作人员将会进行核查。


