Bitcoin continued to fluctuate narrowly around $63,000 over the weekend, and after a sharp rise to $64,700 from a pin at $62,356 at 6 a.m. today, it staged a long and short battle, approaching the high of $65,000 set in mid-August. At the time of writing, Bitcoin was priced at $63,449.
Bitcoin 4-hour chart
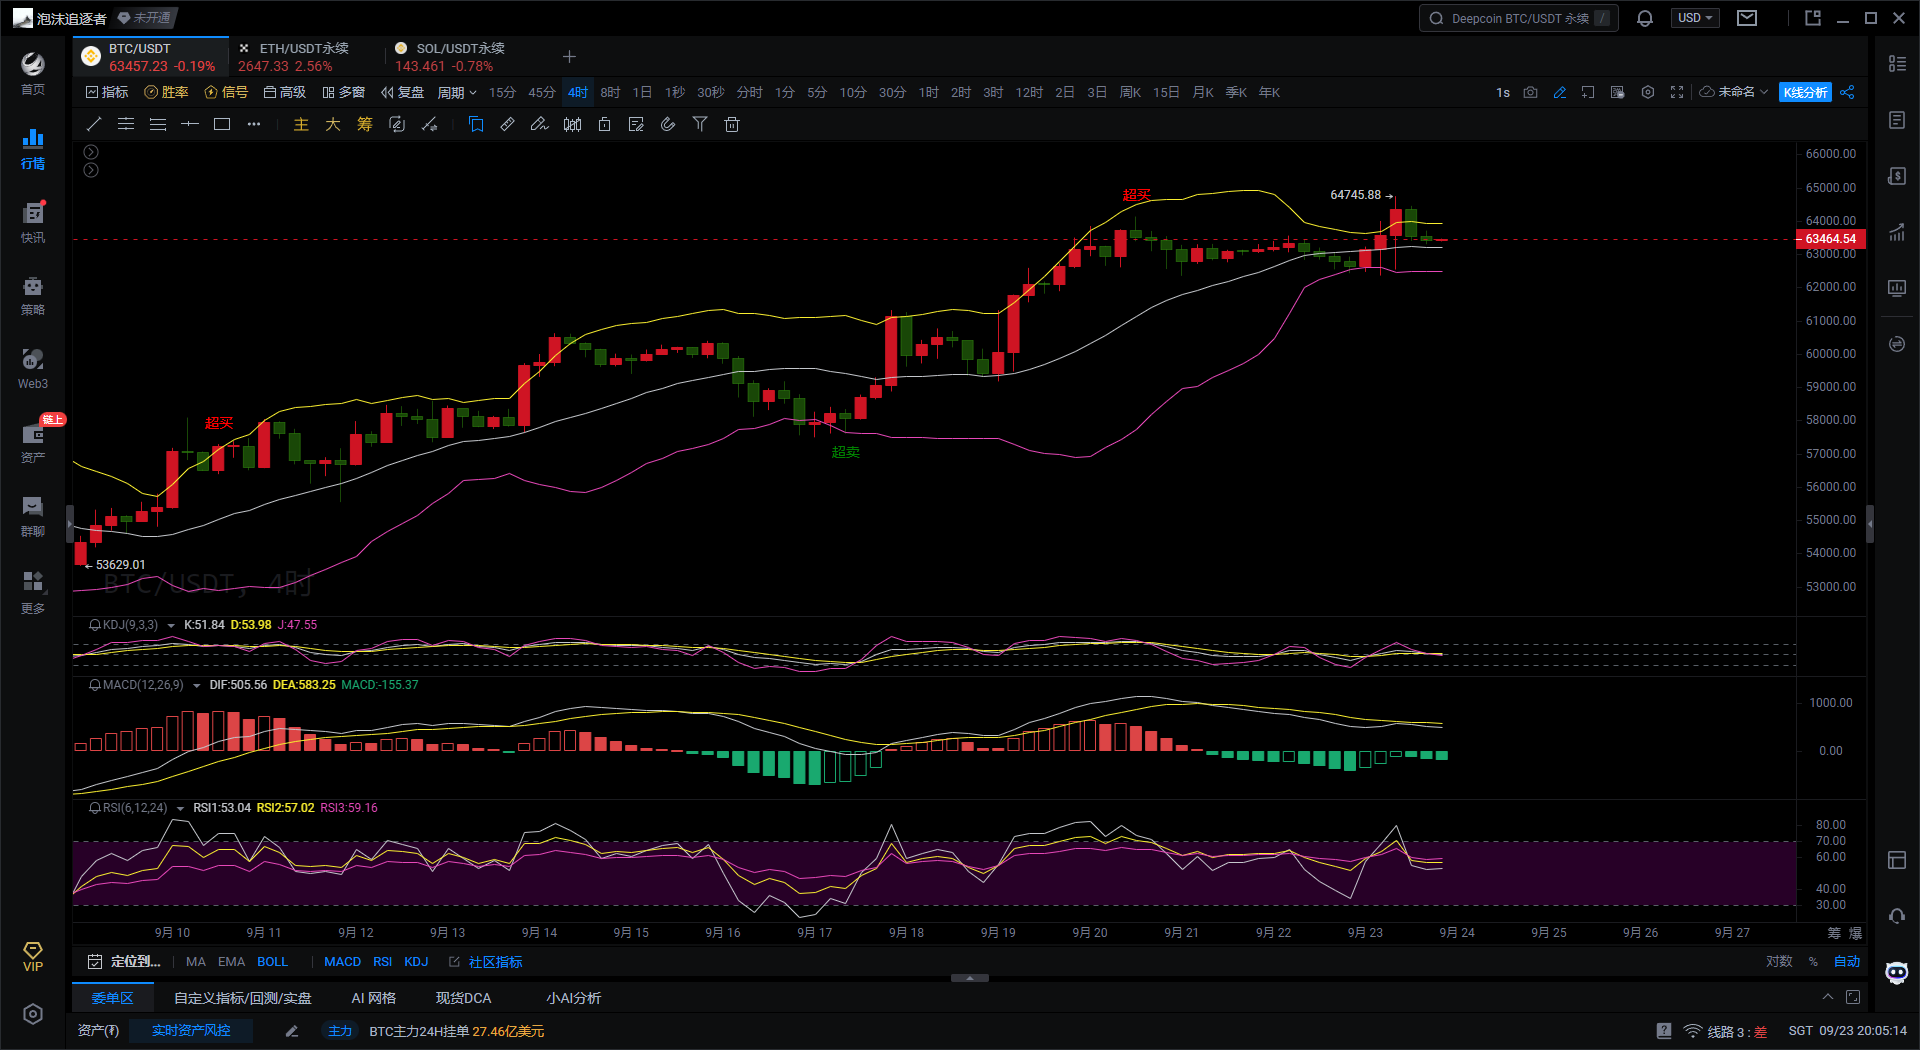
According to the Bollinger Bands indicator on the 4-hour chart of Bitcoin, the price is close to the upper band of the Bollinger Bands and has experienced a brief pullback, indicating that the market is currently in an overbought state, and the price may continue to fall in the future. The distance between the upper and lower bands of the Bollinger Bands has not significantly contracted, indicating that the market volatility remains intense.
According to the MACD indicator on the 4-hour chart of Bitcoin, the DIF line is still above the 0 axis but has begun to converge with the DEA line, and the red histogram of the MACD is gradually shortening, indicating that the upward momentum is weakening. If it continues to form a bearish cross, there will be a risk of a pullback in the short term.
According to the KDJ indicator on the 4-hour chart of Bitcoin, the K-line and D-line values are currently in an overbought state at high levels, while the J-line value is at an even higher level and is beginning to show signs of decline, indicating potential downward pressure in the short term.
According to the RSI indicator on the 4-hour chart of Bitcoin, the RSI value is currently at the middle level of 56, indicating that the market is not in a clear overbought or oversold condition, and the price may continue to maintain a downward trend.
Bitcoin 1-hour chart
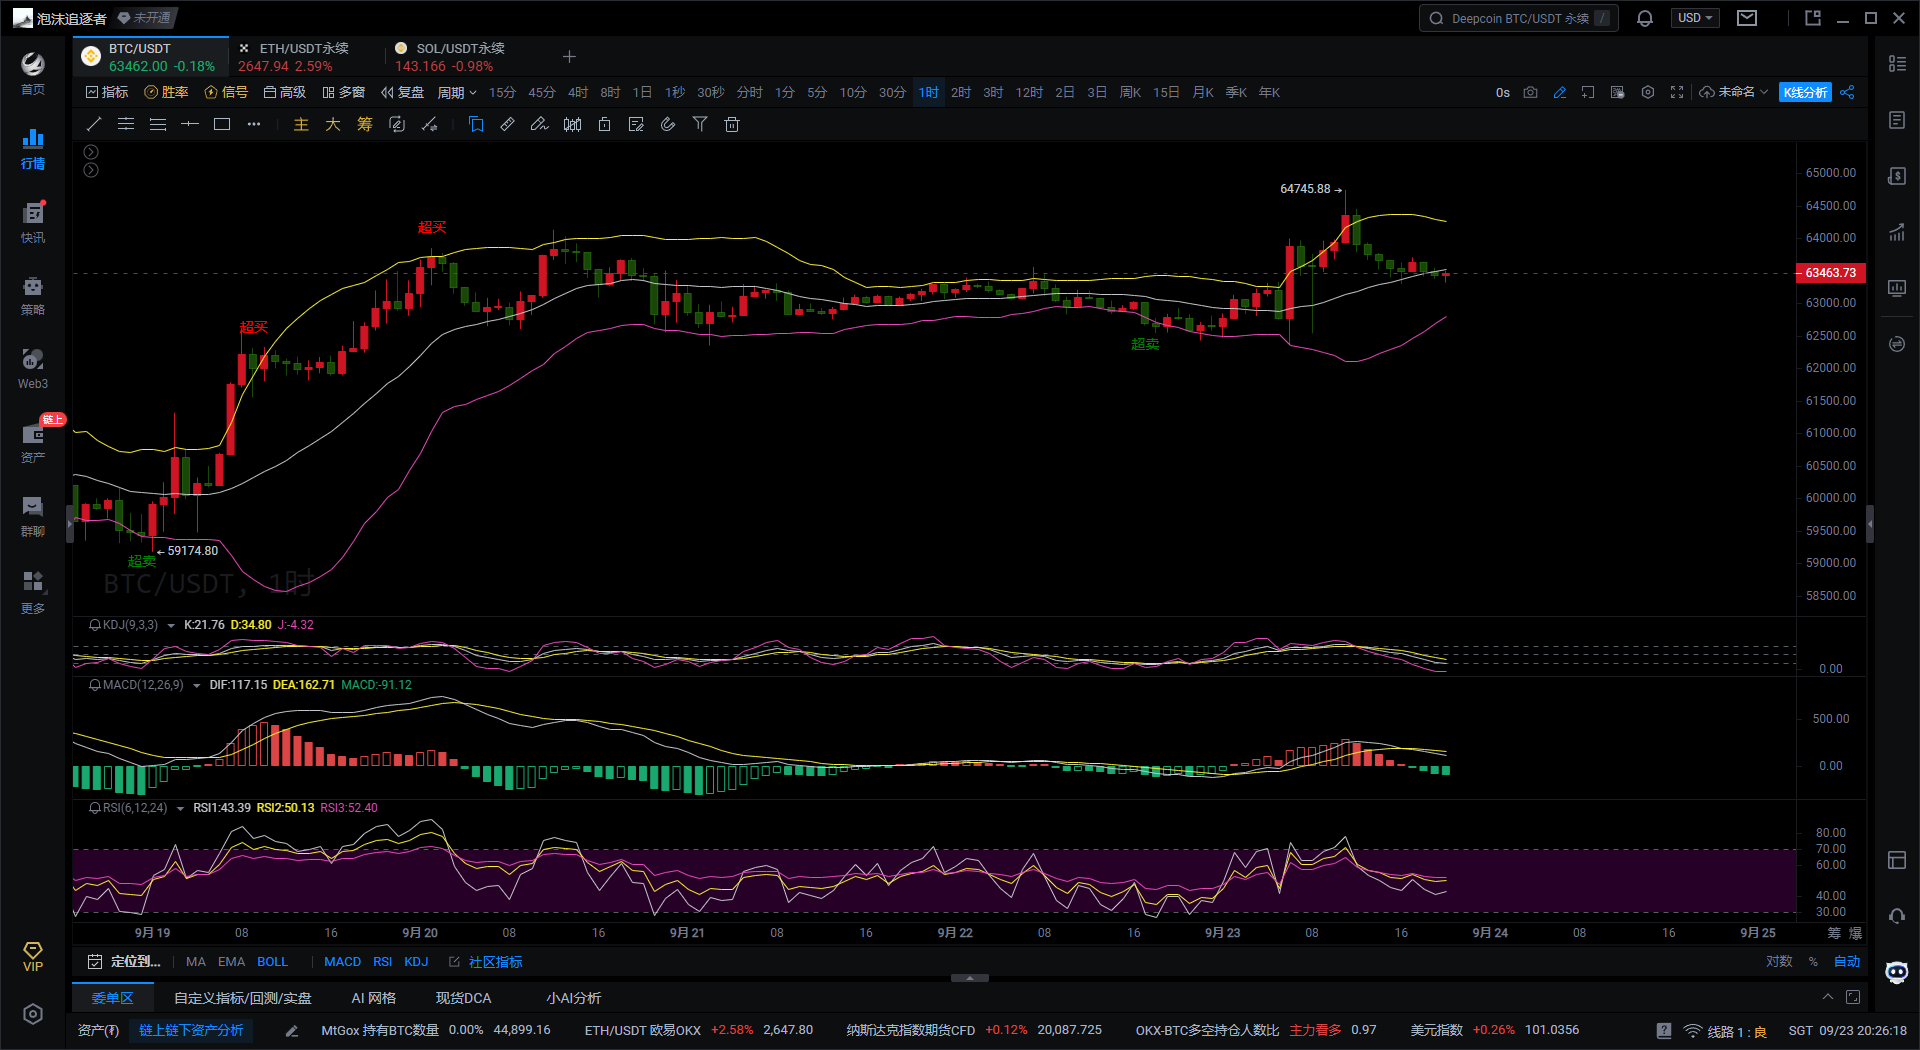
According to the Bollinger Bands indicator on the 1-hour chart of Bitcoin, the price is below the middle band of the Bollinger Bands and is starting to approach the lower band, indicating downward pressure in the market. If the price falls below the lower band, it may accelerate the downward trend, but if the lower band receives strong support, there may be an opportunity for a rebound.
According to the MACD indicator on the 1-hour chart of Bitcoin, the DIF line has crossed below the DEA line to form a bearish cross, indicating that the market is currently in a downward trend, and the green histogram of the MACD is gradually increasing, indicating that there is further room for decline in the market.
According to the KDJ indicator on the 1-hour chart of Bitcoin, the values of the three KDJ lines are starting to turn upward at low levels, indicating that the oversold condition is about to end, and there may be an opportunity for a rebound in the short term.
According to the RSI indicator on the 1-hour chart of Bitcoin, the current RSI value is 40, approaching the oversold area, indicating that the bearish momentum is weakening, and the market may seek support in this area, accompanied by a slight rebound.
In summary, Bitcoin may face some downward pressure in the short term, but overall, it remains in an upward trend. It is necessary to pay attention to whether the MACD forms a bearish cross and the further decline of the KDJ. If the middle band of the Bollinger Bands can provide effective support, the pullback may be limited.
Based on the above analysis, the following suggestions are provided for reference:
Long Bitcoin at 62,800-63,000 for a target of 64,150-64,450, with a stop loss at 62,500.
Instead of giving you a 100% accurate suggestion, it's better to give you the correct mindset and trend, after all, teaching someone to fish is better than giving them a fish. The suggestion is to earn for a moment, but learning the mindset can help you earn for a lifetime! The focus is on the mindset, grasping the trend, and planning the layout and position of the market. What I can do is to provide help based on my practical experience, guiding your investment decisions and management in the right direction.
Drafting time: (2024-09-23, 20:05)

(By - Da Xian Shuo Bi) Disclaimer: The publication on the internet has a delay, and the above suggestions are for reference only. The author is committed to research and analysis in the investment fields of Bitcoin, Ethereum, altcoins, foreign exchange, stocks, etc., and has been involved in the financial markets for many years, with rich experience in actual trading operations. Investment involves risks, so caution is needed when entering the market. For more real-time market analysis, please follow Da Xian Shuo Bi for discussion and exchange.
免责声明:本文章仅代表作者个人观点,不代表本平台的立场和观点。本文章仅供信息分享,不构成对任何人的任何投资建议。用户与作者之间的任何争议,与本平台无关。如网页中刊载的文章或图片涉及侵权,请提供相关的权利证明和身份证明发送邮件到support@aicoin.com,本平台相关工作人员将会进行核查。


