Daily Sharing
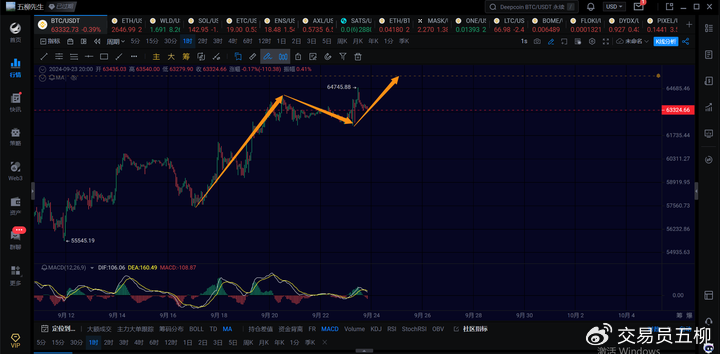
Bitcoin (BTC) once again retraced to around 62350 last night, and then instead of continuing to decline, it quickly rebounded, reaching a high of around 64745 today. This indicates that BTC is currently undergoing a 1-hour rebound. In the short term, we will see if the 65000~65500 range is broken. If it is, there may be further upward momentum.
After retracing to 2524 in the early morning, Ethereum (ETH) surged again, currently reaching a high of 2687. The retracement structure of the 1-hour ETH is not standard, so we will have to see how it progresses. In the short term, ETH's performance is slightly stronger, and we will observe whether the 4-hour range will break through 2800.
BTC
Due to the rapid changes in the market, this article can only make predictions based on the market conditions at the time of publication. Short-term traders should pay attention to the latest market changes and use this information as a reference only.
1H:
On the 1-hour chart, the current rebound is likely to be followed by a 15-minute level rebound. If it holds above 63000, there may be another upward surge. If it falls below, pay attention to the possibility of the rebound ending.
15M:
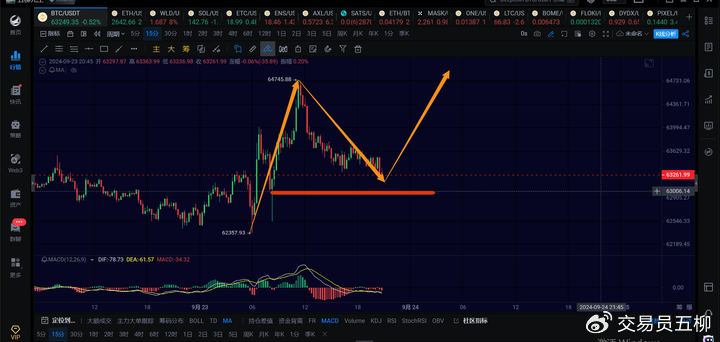
On the 15-minute chart, if the current 15-minute retracement does not effectively fall below 63000, there should be another 15-minute rebound to challenge the vicinity of 65000. If it falls below, there is uncertainty.
ETH
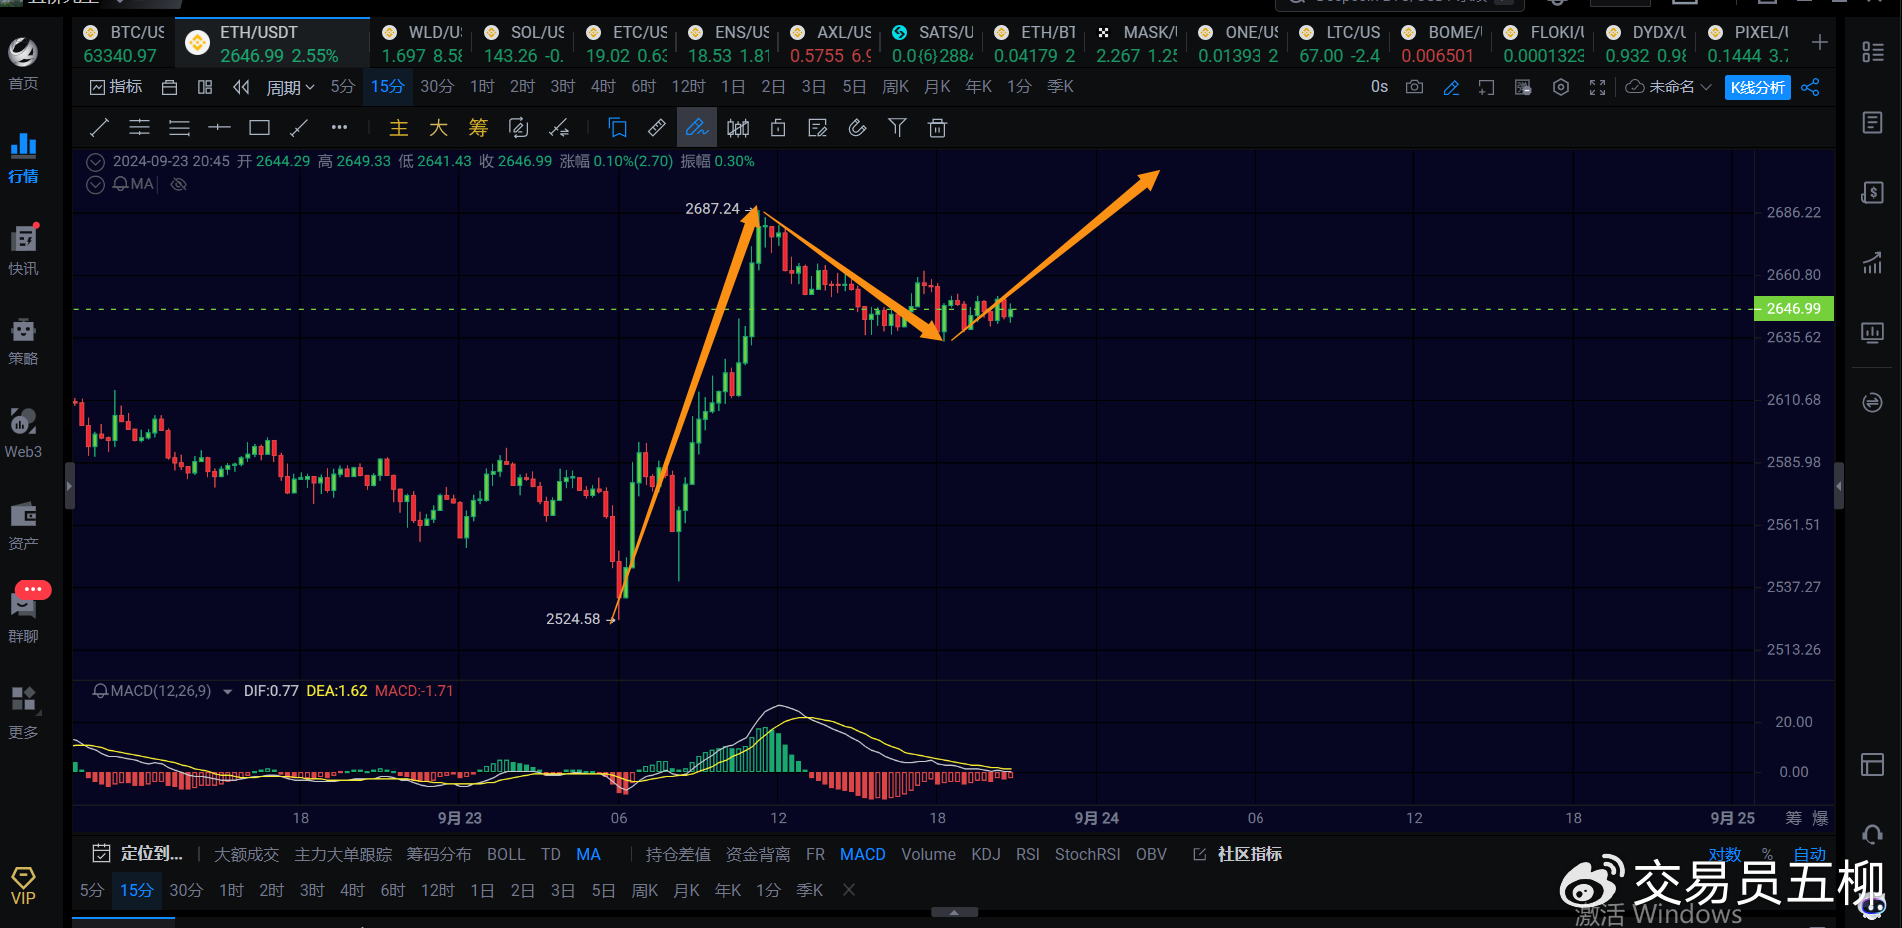
The situation for Ethereum is similar. There should be a 15-minute level rebound to challenge around 2700. The main resistance above is at 2750~2800. If it does not effectively break through 2800, there may be a 4-hour retracement this week.
Trend Direction
Weekly Chart: Downward direction, the extension of the weekly decline. The theoretical bottom is around 49000, with a possible range of 45000~48000. Whether it has ended needs further observation.
Daily Chart: Upward direction, in the short term, we should continue to look at the range of 67000~70000.
4-hour Chart: Upward direction, the 4-hour rebound has not ended. In the short term, we will observe whether 65500 will be broken, which may extend to 66500 if it does.
1-hour Chart: Upward direction, the current 1-hour rebound is likely to surge to 65000 again.
15-minute Chart: Upward direction, holding above 63000, there should be another 15-minute level rebound.
Feel free to follow my public account for further discussion and exchange:

This article is time-sensitive. Pay attention to the risks. The views in the article are personal opinions and are for reference only!
免责声明:本文章仅代表作者个人观点,不代表本平台的立场和观点。本文章仅供信息分享,不构成对任何人的任何投资建议。用户与作者之间的任何争议,与本平台无关。如网页中刊载的文章或图片涉及侵权,请提供相关的权利证明和身份证明发送邮件到support@aicoin.com,本平台相关工作人员将会进行核查。


