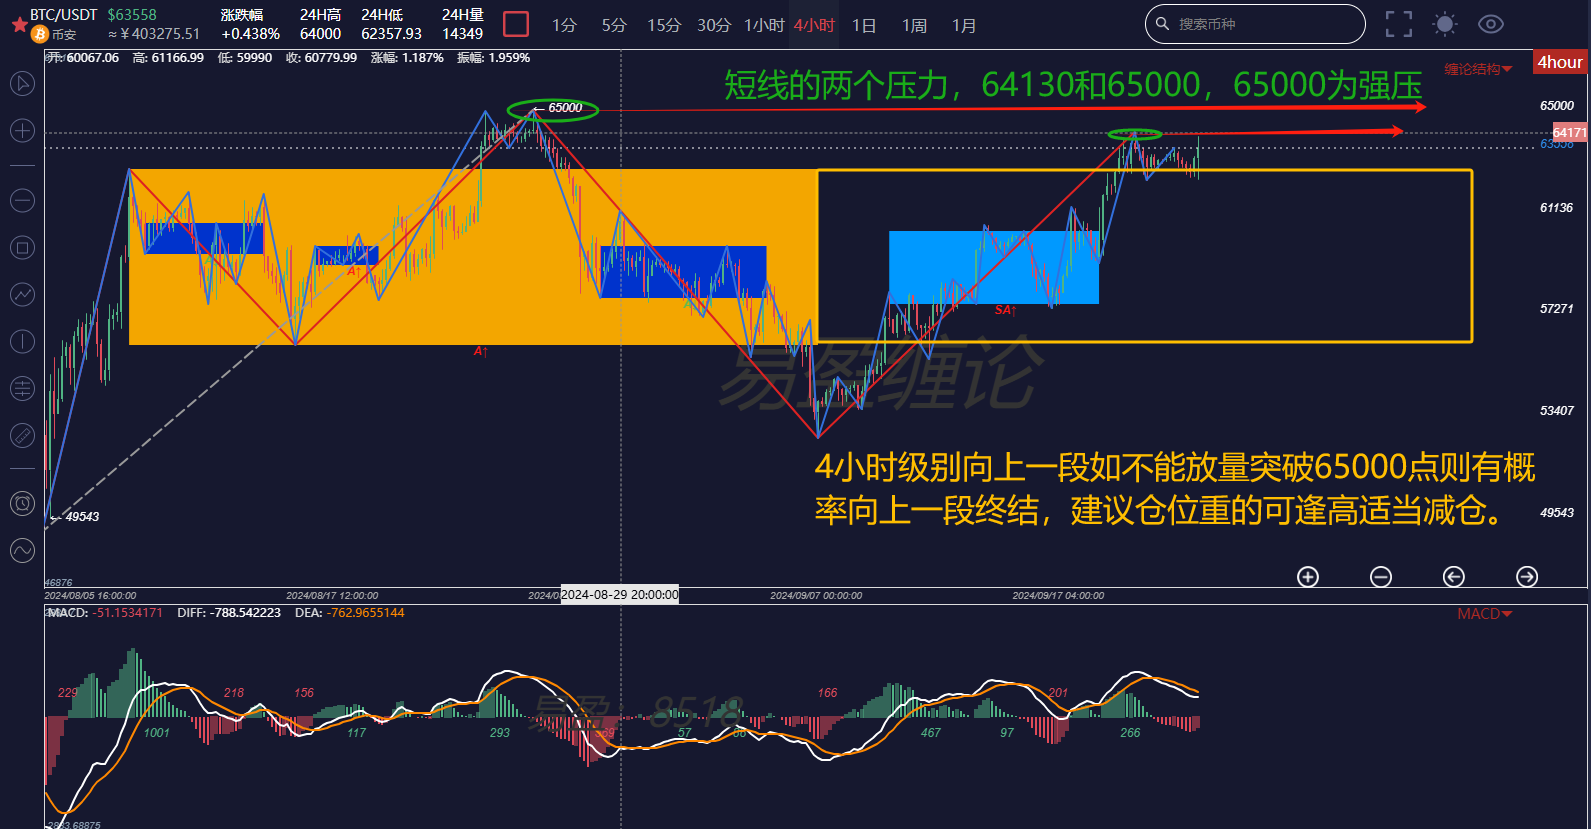
Since the early hours of September 19th, the Federal Reserve announced a 50 basis point rate cut. After BTC broke through the 60,000 integer mark from below, it is currently once again testing the pressure zone of the 65,000 mark. Over the weekend, it has been oscillating narrowly between 62,400 and 64,000, and the current price is 63,580.
The 65,000 mark is the GG point of the 4-hour level central axis of Bitcoin, and it is also the place where the previous 4-hour level upward line segment ended. At the same time, it also has symbolic significance as an integer mark. Whether it can break through the 65,000 mark in the next two days is an important reference for the medium-term trend reversal of Bitcoin. If it can break through the 65,000 mark with volume in the short term, it indicates the strength of the bulls. After breaking through 65,000, there is hope for a new all-time high. If it cannot break through with volume, it is just a probe or cannot even reach 65,000, then there is a need for a short-term bull power exhaustion and a rebound to regain strength. The way the trend will choose will be revealed this week!

Looking directly at the 4-hour level K-line structure diagram, in the article "The Third Opportunity to Get Onboard is Emerging!" on September 5th, it was mentioned that the third buy point of the 4-hour level central axis has completely emerged. It can be seen from the chart that the third buy point of the central axis is a big counterattack launched after piercing the central axis to create a bear trap, which has been running for more than half a month since September 7th, and the price has returned from below the central axis to above the central axis.
Those who have studied K-line theory know that without three buys above the central axis, one should not go long, and above the central axis, one should only consider selling, not buying. As mentioned in the first half of the article, if Bitcoin cannot break through the 65,000 mark with volume in the short term, then reducing positions is the main focus in the medium term. From a time perspective, this upward segment at the 4-hour level has been running for more than half a month, and both time and space are sufficient, and it has reached a strong pressure zone, so it is recommended to reduce positions for those with heavy positions, and consider replenishing when the downward segment at the 4-hour level appears at a lower level.
Yesterday, a friend asked me a classic question, he asked if he had been short all along, can he buy now? I replied, how could you have been short all along? Why didn't you buy at the three buy points that were mentioned before the decline? Now that it has risen, you want to chase the rise, isn't this a typical case of chasing the rise and killing the fall?
Chasing the rise and killing the fall is human nature in any investment market, but it is also a major taboo in trading. It is impossible to achieve stable profits in the investment market, including the currency circle, if this mentality cannot be completely reversed. To reverse this mentality, continuous learning and improving cognitive and trading skills are needed, and there are no shortcuts.
The above analysis is for reference only and does not constitute any investment advice!
If you are interested in K-line theory and want to obtain K-line learning materials for free, watch public live broadcasts, participate in offline K-line training camps, improve your trading skills, build your own trading system to achieve stable profit goals, and use K-line technology to timely escape the peak and bottom. You can scan the code to follow the public account and add the WeChat of this account to obtain and add the following public account!

免责声明:本文章仅代表作者个人观点,不代表本平台的立场和观点。本文章仅供信息分享,不构成对任何人的任何投资建议。用户与作者之间的任何争议,与本平台无关。如网页中刊载的文章或图片涉及侵权,请提供相关的权利证明和身份证明发送邮件到support@aicoin.com,本平台相关工作人员将会进行核查。


