On the afternoon of September 2nd, AICoin researchers conducted a text and image sharing of the "EMA Resonance Signal (with Membership)" in the AICoin PC-end Group Chat Live. Here is a summary of the live content.
I. Overview of EMA Resonance Signal
The EMA resonance signal is a commonly used strategy in practical trading, simple yet effective.
Resonance implies the unification of trends across multiple time dimensions, which can be understood as the consistency of technical indicators. The Exponential Moving Average (EMA) is a technical analysis tool used to smooth time series data (such as prices) to help traders identify and track market trends. Unlike the Simple Moving Average (SMA), EMA assigns greater weight to more recent data, making it more responsive to price changes. In short, EMA tracks recent price levels. Its advantage lies in filtering out market "noise" through smoothing price fluctuations, allowing traders to see price trends more clearly. EMA weights recent prices, making it highly sensitive and reducing lag, enabling traders to receive buy and sell signals more promptly.
EMA is mainly used in three areas: trend identification, crossover signals, and support and resistance.
Trend identification: In an uptrend, the short-term EMA is usually above the long-term EMA; in a downtrend, it is below.
Crossover signals: Crossovers between short-term and long-term EMAs (such as golden cross, death cross) are common buy and sell signals. A golden cross occurs when the short-term EMA crosses above the long-term EMA, typically seen as a buy signal; a death cross occurs when the short-term EMA crosses below the long-term EMA, typically seen as a sell signal. In simple terms, it involves observing the crossover of moving averages or the crossover with price.
Support and resistance: EMA can also be used as dynamic support and resistance levels to help traders determine entry and exit points. When comparing moving averages with prices, they also act as support and resistance lines.
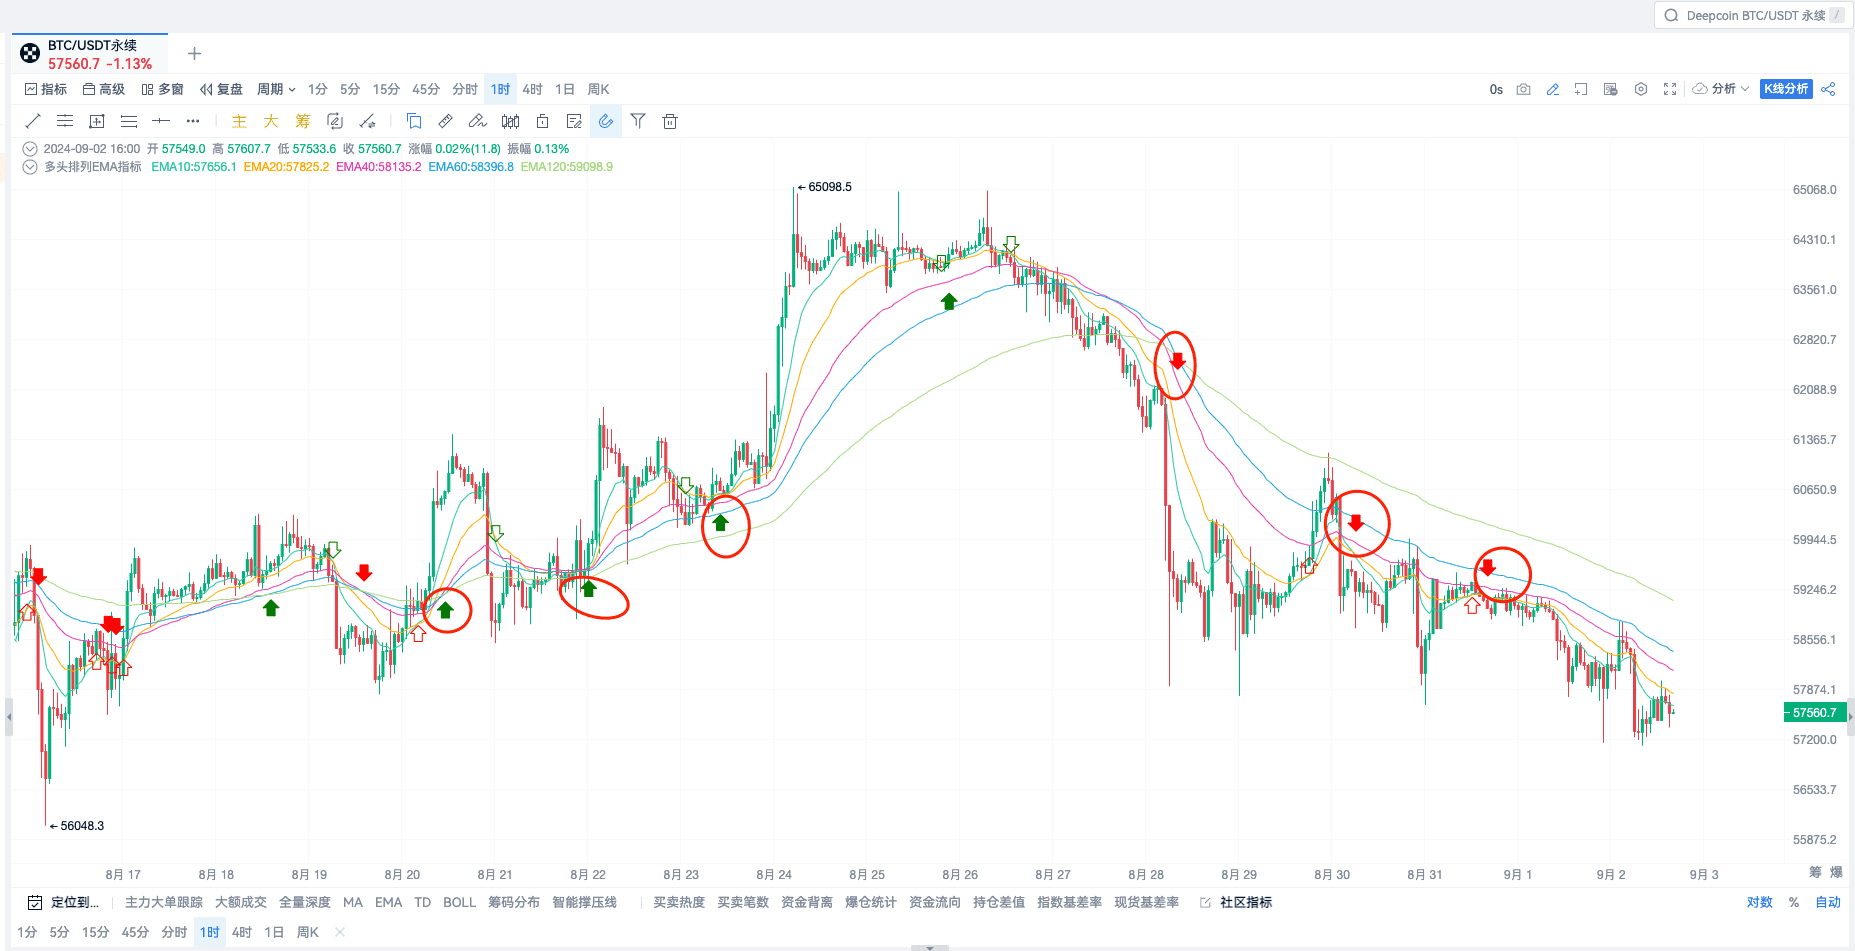
(The figure shows the recent performance of the EMA resonance strategy signal)
Common periods for EMA settings include 10, 20, 50, 100, and 200. Short periods (e.g., 10, 20) are suitable for short-term trading, while long periods (e.g., 50, 100, 200) are suitable for medium to long-term trading.
The parameters most studied by our research institute are 10, 40, 120, 250, and 300.
EMA is highly suitable for use in conjunction with other indicators, either as a trend direction or as support and resistance lines. We will also share pairing methods in future live broadcasts.
In summary, the Exponential Moving Average (EMA) is a powerful technical analysis tool suitable for all types of traders. Whether for short-term, medium-term, or long-term trading, it enables traders to grasp trends and optimize strategies. Our research institute is also a proponent of EMA and uses it in various technical analyses.
II. EMA Strategy Parameters
The main advantage of EMA is capturing major market trends and providing ample profit opportunities for investors. However, its drawbacks are also apparent, as it is more prone to incurring transaction fees during high-frequency oscillating crossovers. Therefore, we have incorporated the concept of resonance to increase the accuracy and frequency of signals.
First, the research institute shares the first set of EMA strategy parameters: 10, 20, 40, 60, 120.
In terms of BTC's performance, it can capture trends quite effectively: 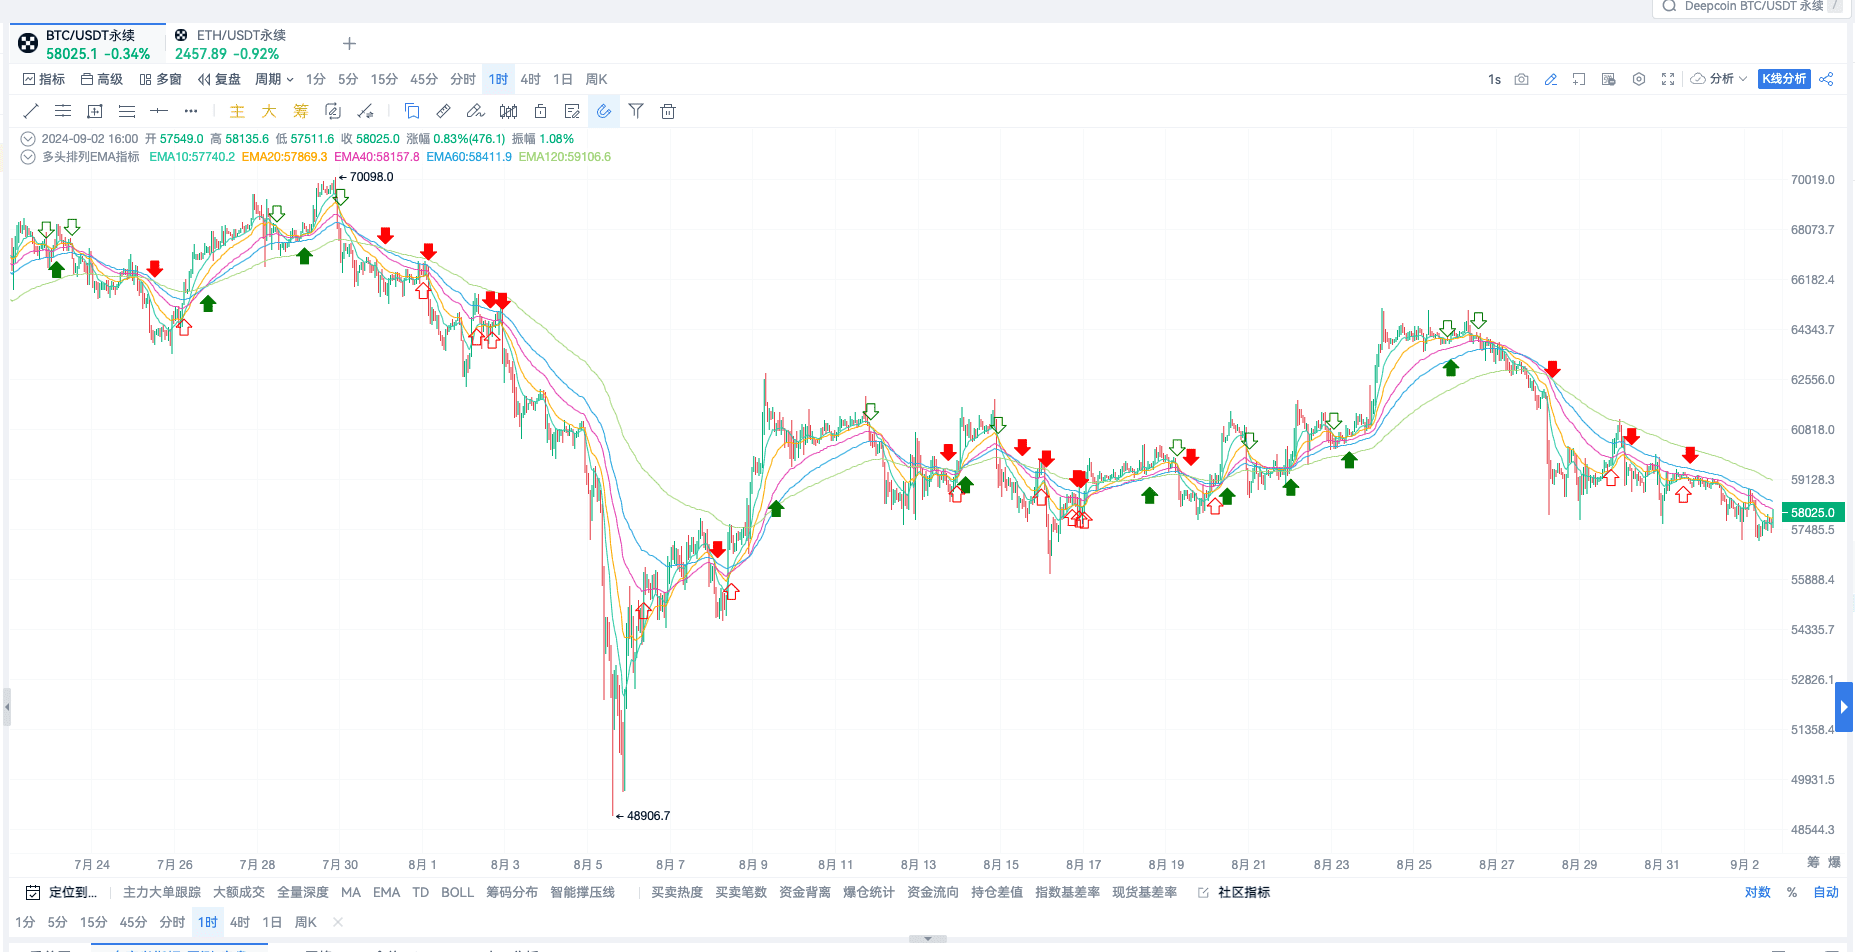
(Red downward arrow indicates EMA short resonance; red upward arrow indicates the end of resonance. Green upward arrow indicates EMA long resonance; green downward arrow indicates the end of resonance)
This is the most basic algorithm, and everyone can evolve it based on their own practical experience with these parameters. Evolution can involve adding take-profit and stop-loss criteria. Use this basic resonance signal as the entry standard, and for the exit, you can directly refer to this set or set your own take-profit signal.
The EMA resonance signal also performs well in the 1-hour ETH chart: 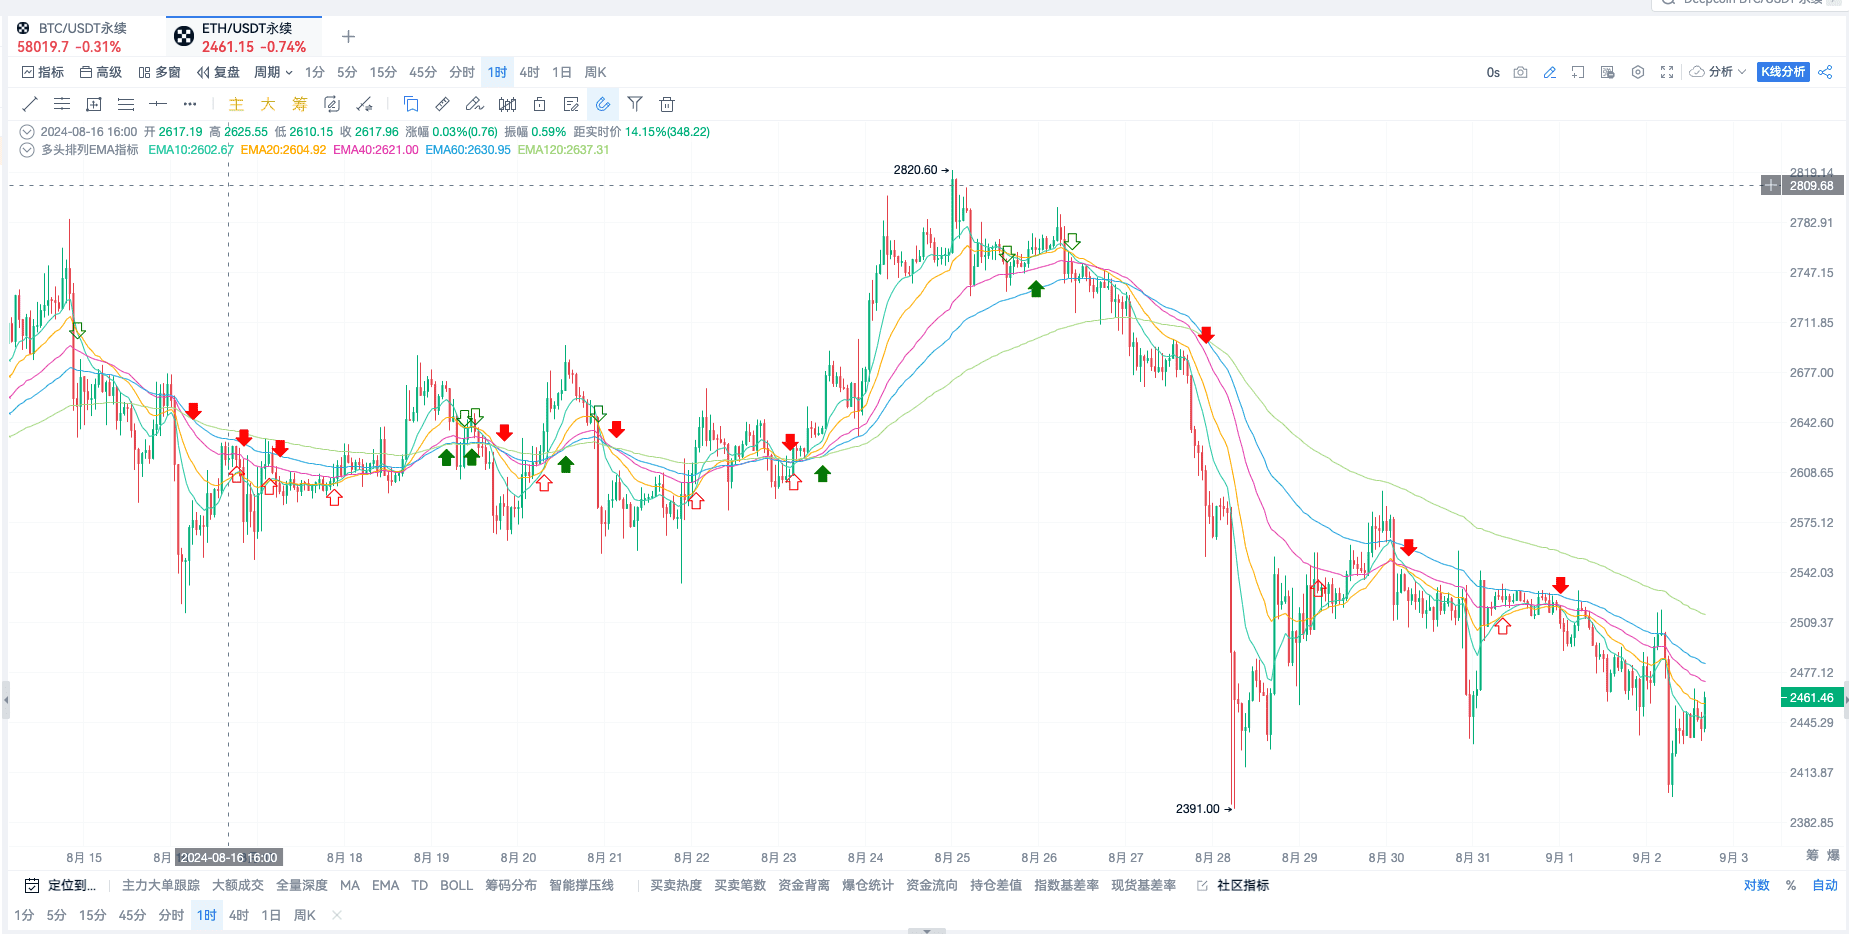
The strategy source code is shared with everyone (including alerts, automatic trading, and signal marking):
// @version=2

// Code example

//

ma1 = ema(close, 10)

ma2 = ema(close, 20)

ma3 = ema(close, 40)

ma4 = ema(close, 60)

ma5 = ema(close, 120)

// ma6 = ema(close, 250)

// Calculate EMA long arrangement

maLong = ma1 > ma2 && ma2 > ma3 && ma3 > ma4 && ma4 > ma5

// && ma5 > ma6

// Start of long arrangement

longStart = maLong && (not maLong[1])

// End of long arrangement

longEnd = (not maLong) && maLong[1]

// Define alert conditions for use in the alert window

alertcondition(longStart, title='EMA Long Arrangement Start', direction="buy")

alertcondition(longEnd, title='EMA Long Arrangement End', direction="sell")

// Plot on the chart

plot(ma1, title ="EMA10")

plot(ma2, title ="EMA20")

plot(ma3, title ="EMA40")

plot(ma4, title ="EMA60")

plot(ma5, title ="EMA120")

// plot(ma6, title ="EMA250")

plotShape(longStart, title="EMA Long Arrangement Start", shape='arrowUp', color='green', refSeries=ma3, placement='bottom', fill=true)

plotShape(longEnd, title="EMA Long Arrangement End", shape='arrowDown', color='green', refSeries=ma3, placement='top', fill=false)

// Calculate EMA short arrangement

maShort = ma1 < ma2 && ma2 < ma3 && ma3 < ma4 && ma4 < ma5

// && ma5 < ma6

// Start of short arrangement

shortStart = maShort && (not maShort[1])

shortEnd = (not maShort) && maShort[1]

// Define alert conditions for use in the alert window

alertcondition(shortStart, title='EMA Short Arrangement Start', direction="sell")
alertcondition(shortEnd, title='EMA Short Arrangement End', direction="buy")
// Plot on the chart
plotShape(shortStart, title="EMA Short Arrangement Start", shape='arrowDown', color='red', refSeries=ma3, placement='top', fill=true)
plotShape(shortEnd, title="EMA Short Arrangement End", shape='arrowUp', color='red', refSeries=ma3, placement='bottom', fill=false)
// Enter long and exit long
enterLong(longStart, price='market', amount=1)
exitLong(longEnd, price='market', amount=1)
// Enter short and exit short
enterShort(shortStart, price='market', amount=1)
exitShort(shortEnd, price='market', amount=1)
This strategy has been published to the community indicators for subscription and reference: 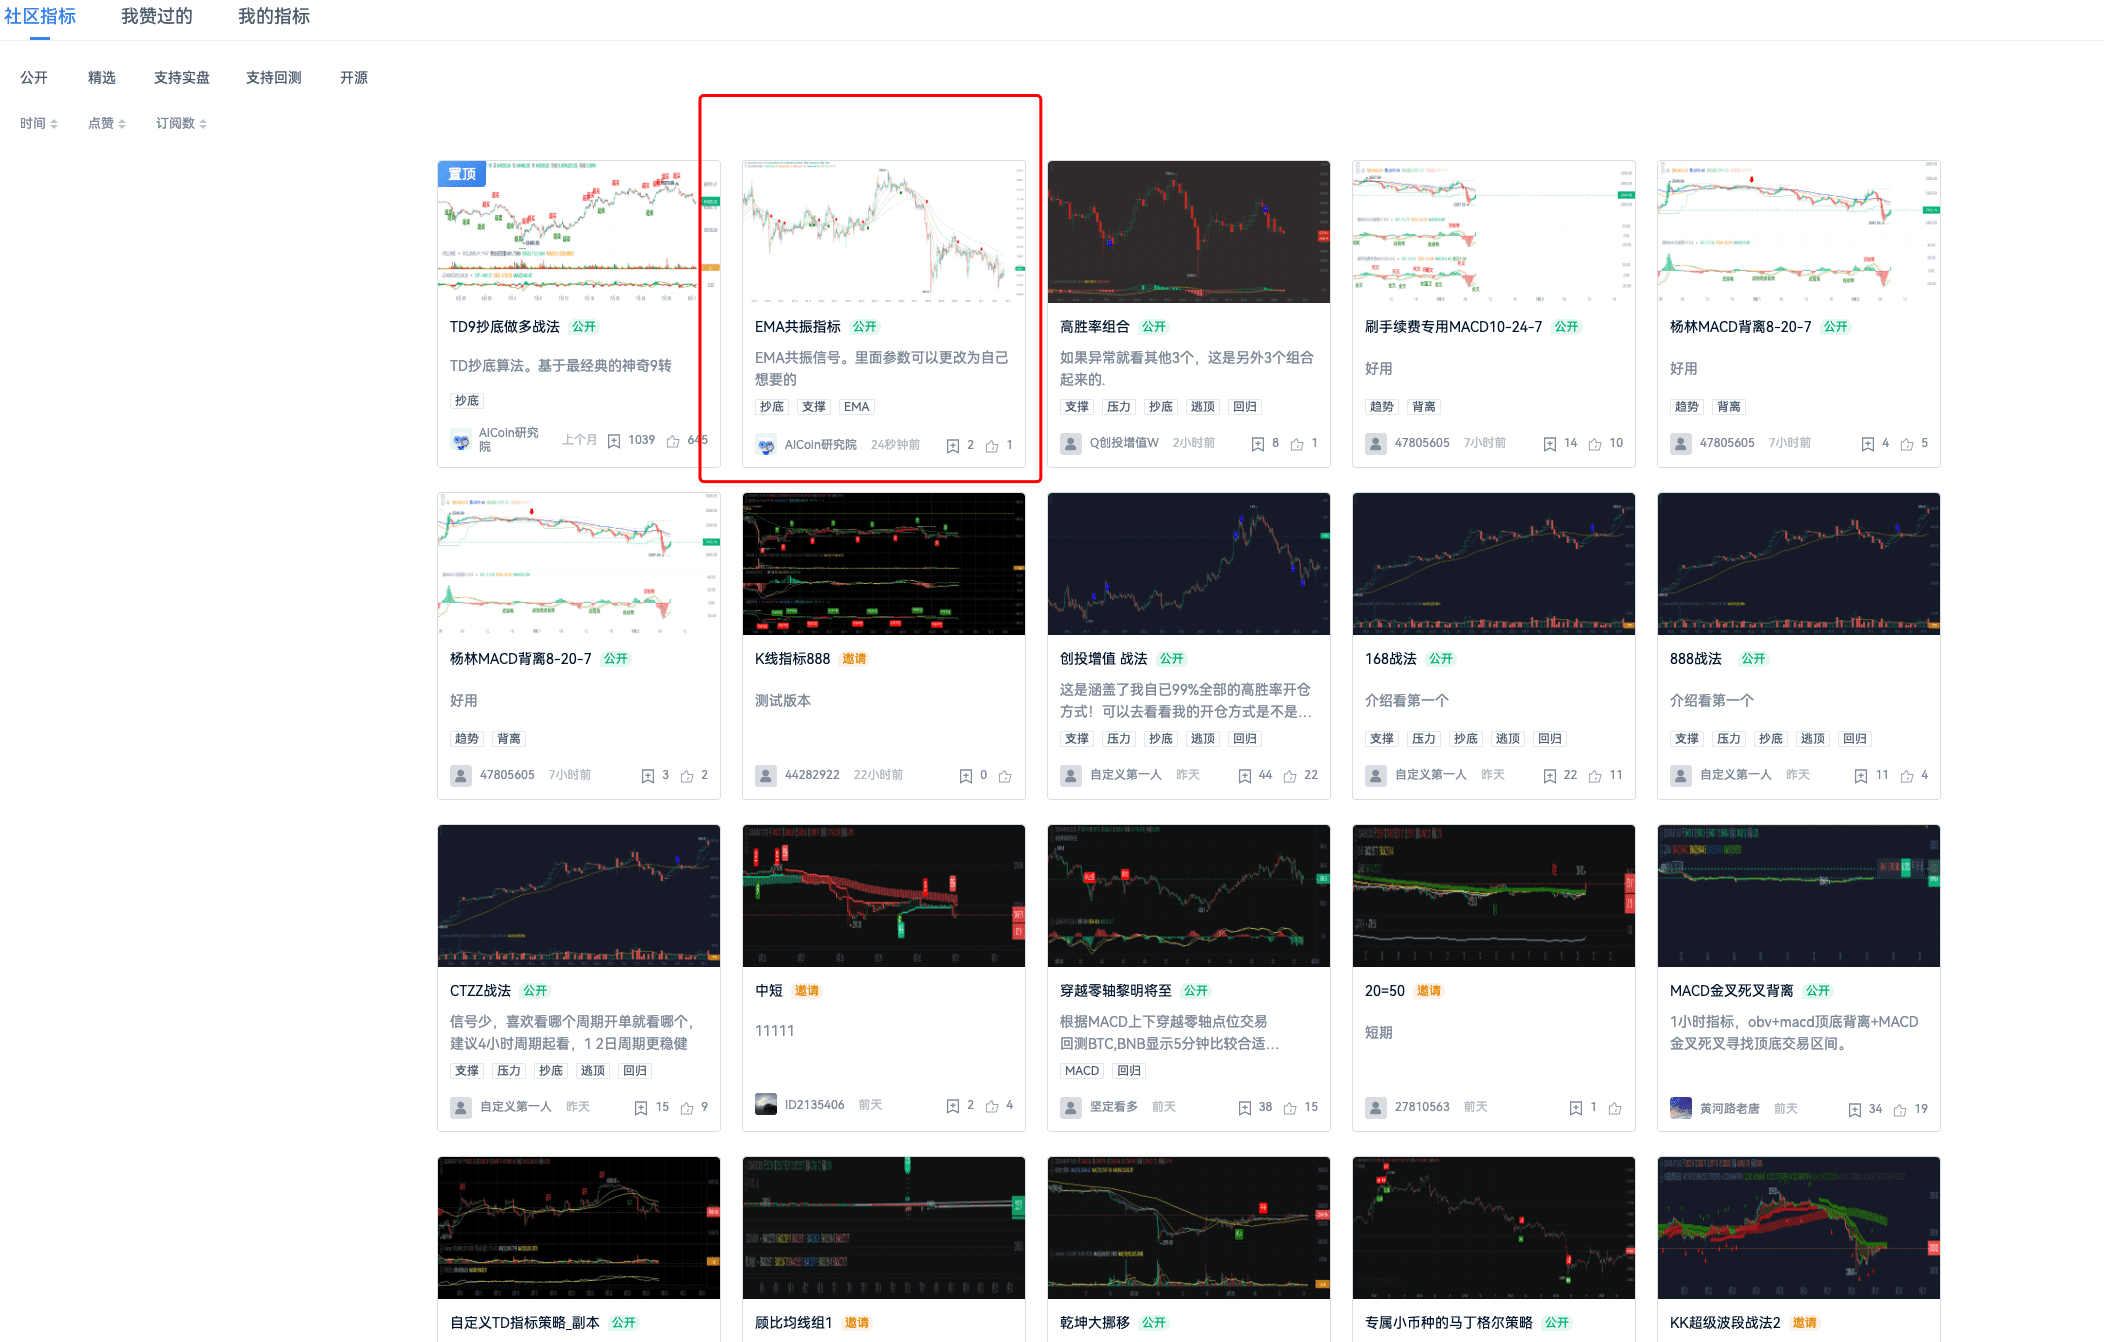
III. How to Rewrite Indicator Code According to Your Own Needs
Explained in four parts.
Part One, Write the Desired EMA Parameters at the Beginning:
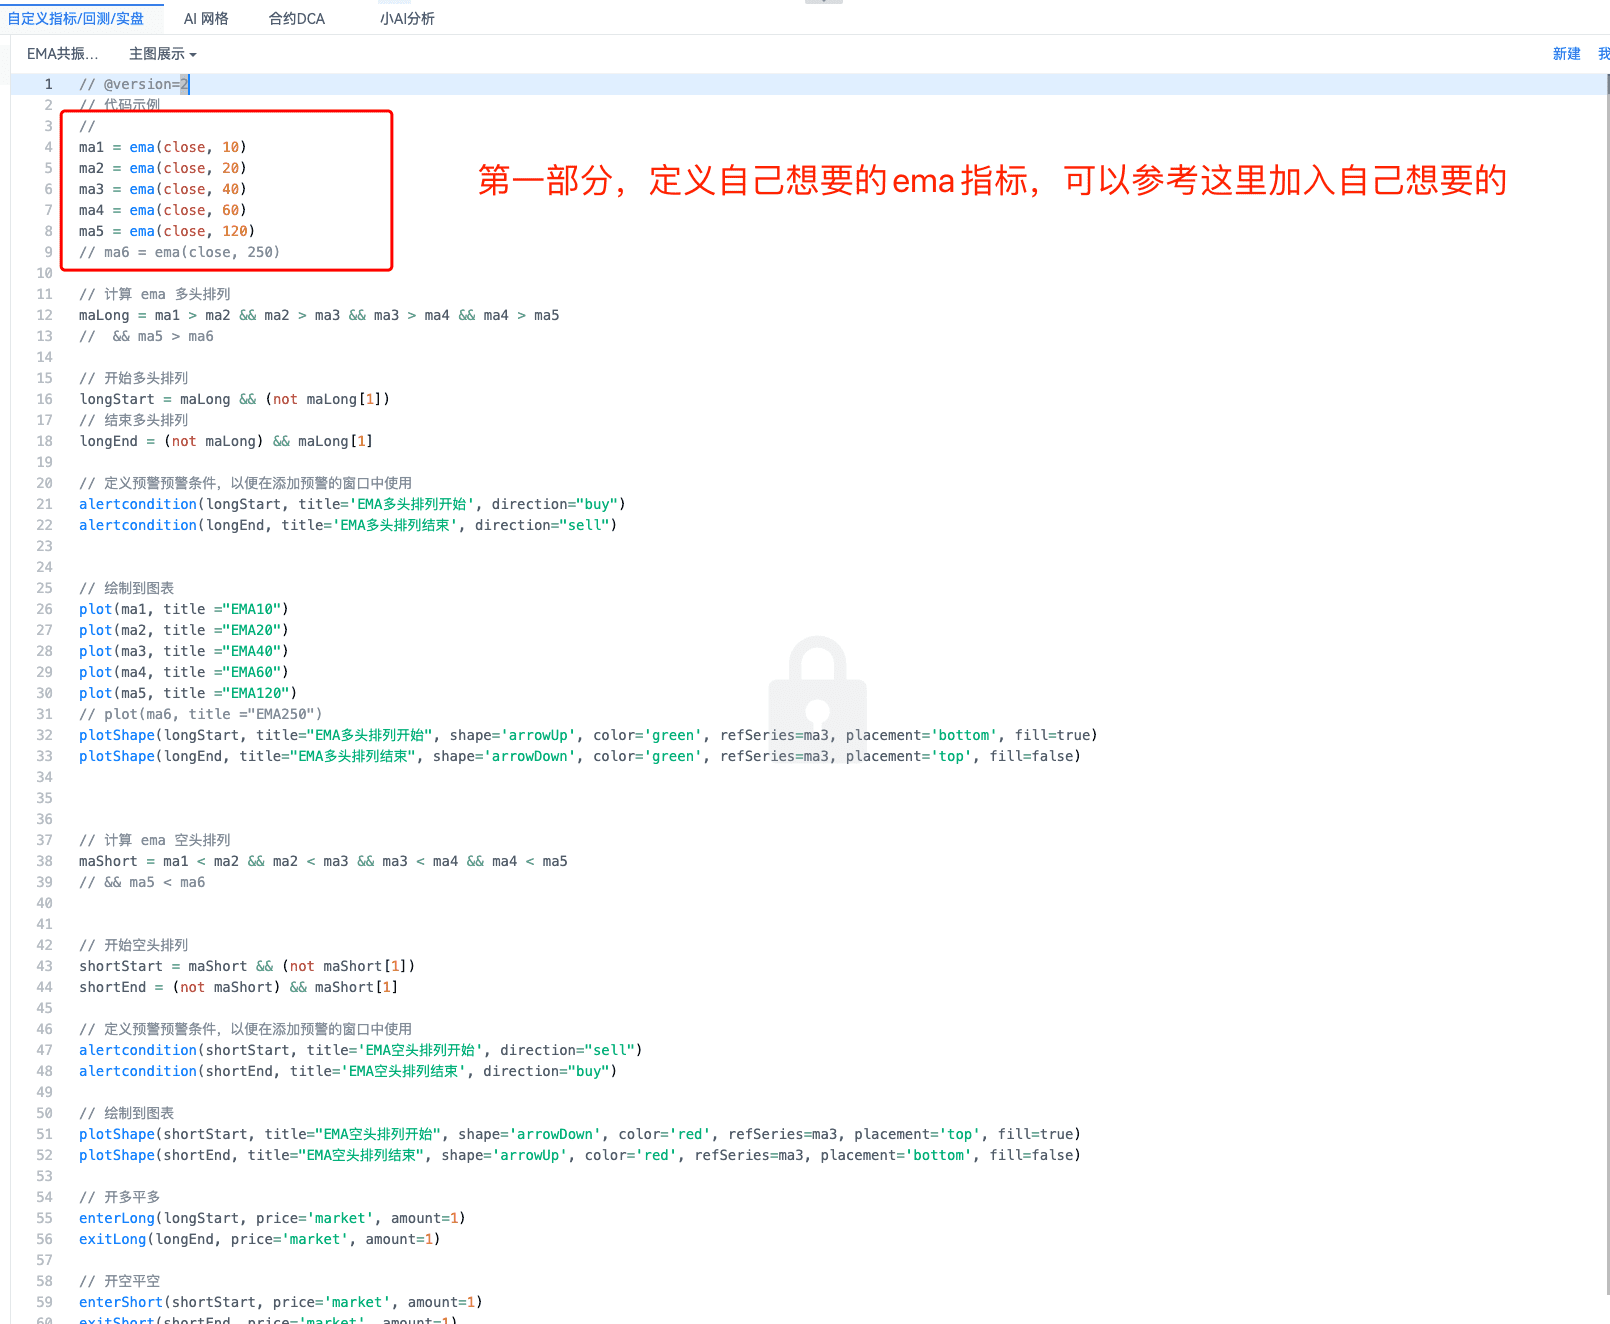
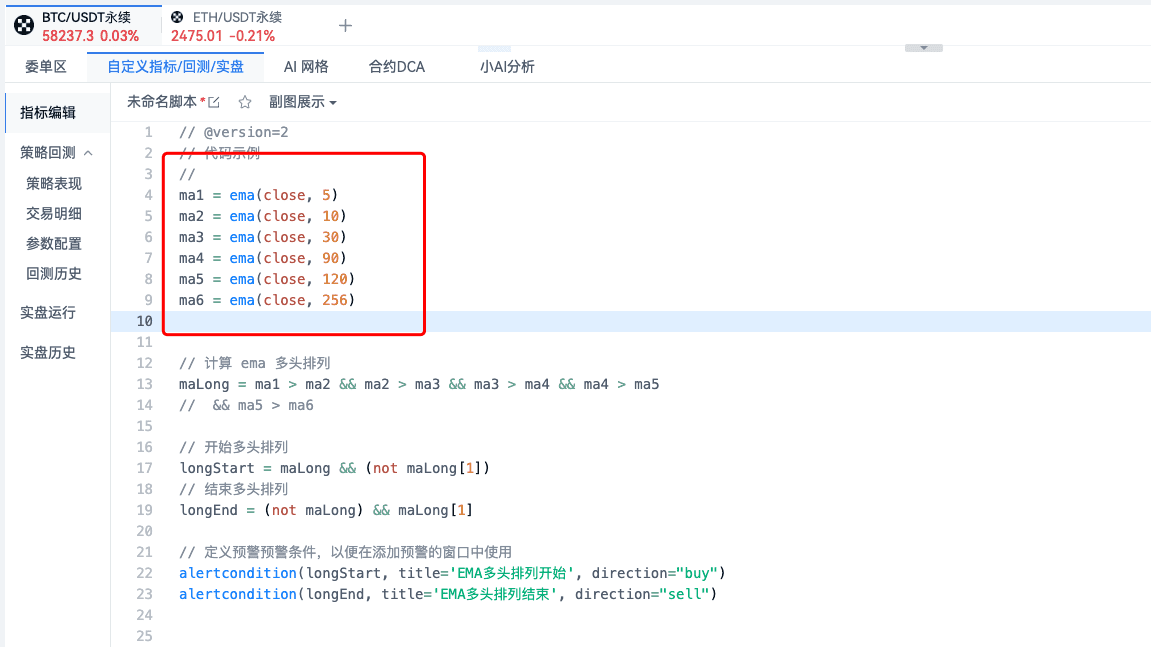
If this set is not sufficient, you can add your own parameters. For example, we add 5, 10, 30, 90, 120, 256:
You can see that the signals for this set of EMA indicators are quite frequent:
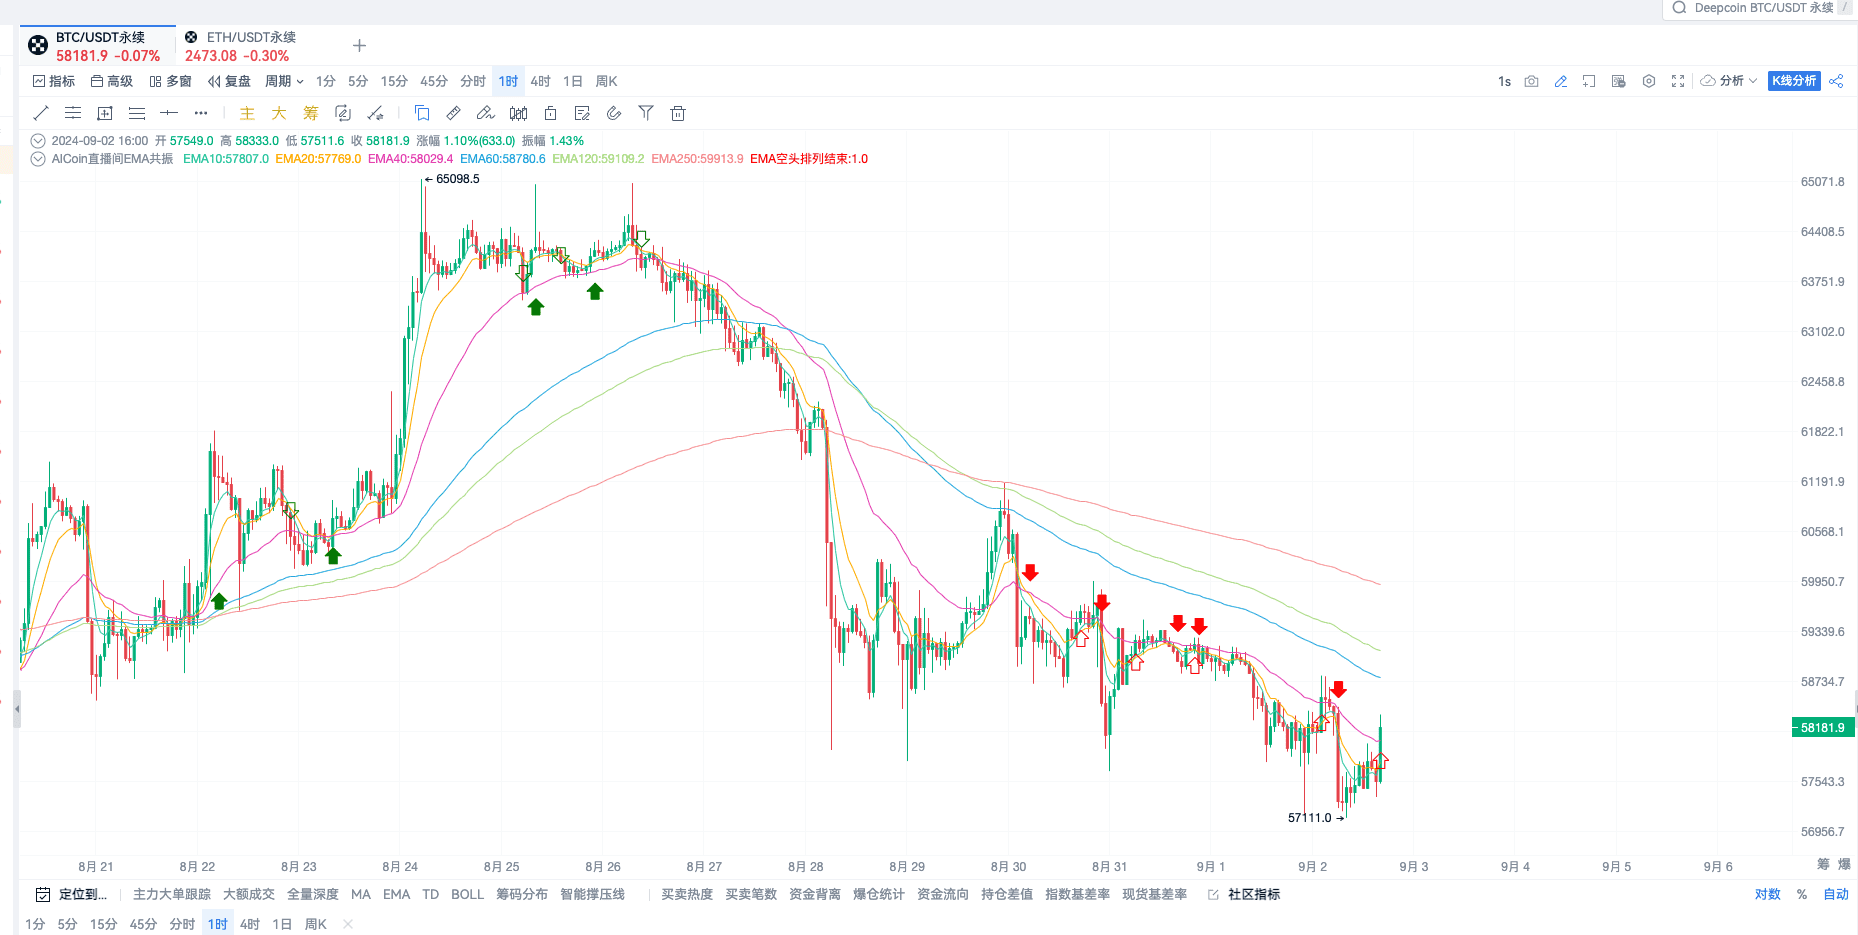
Currently, its signal is in the phase of the end of the short arrangement. The method of modification is simple, just fill in your parameters in the selected box in the following image: 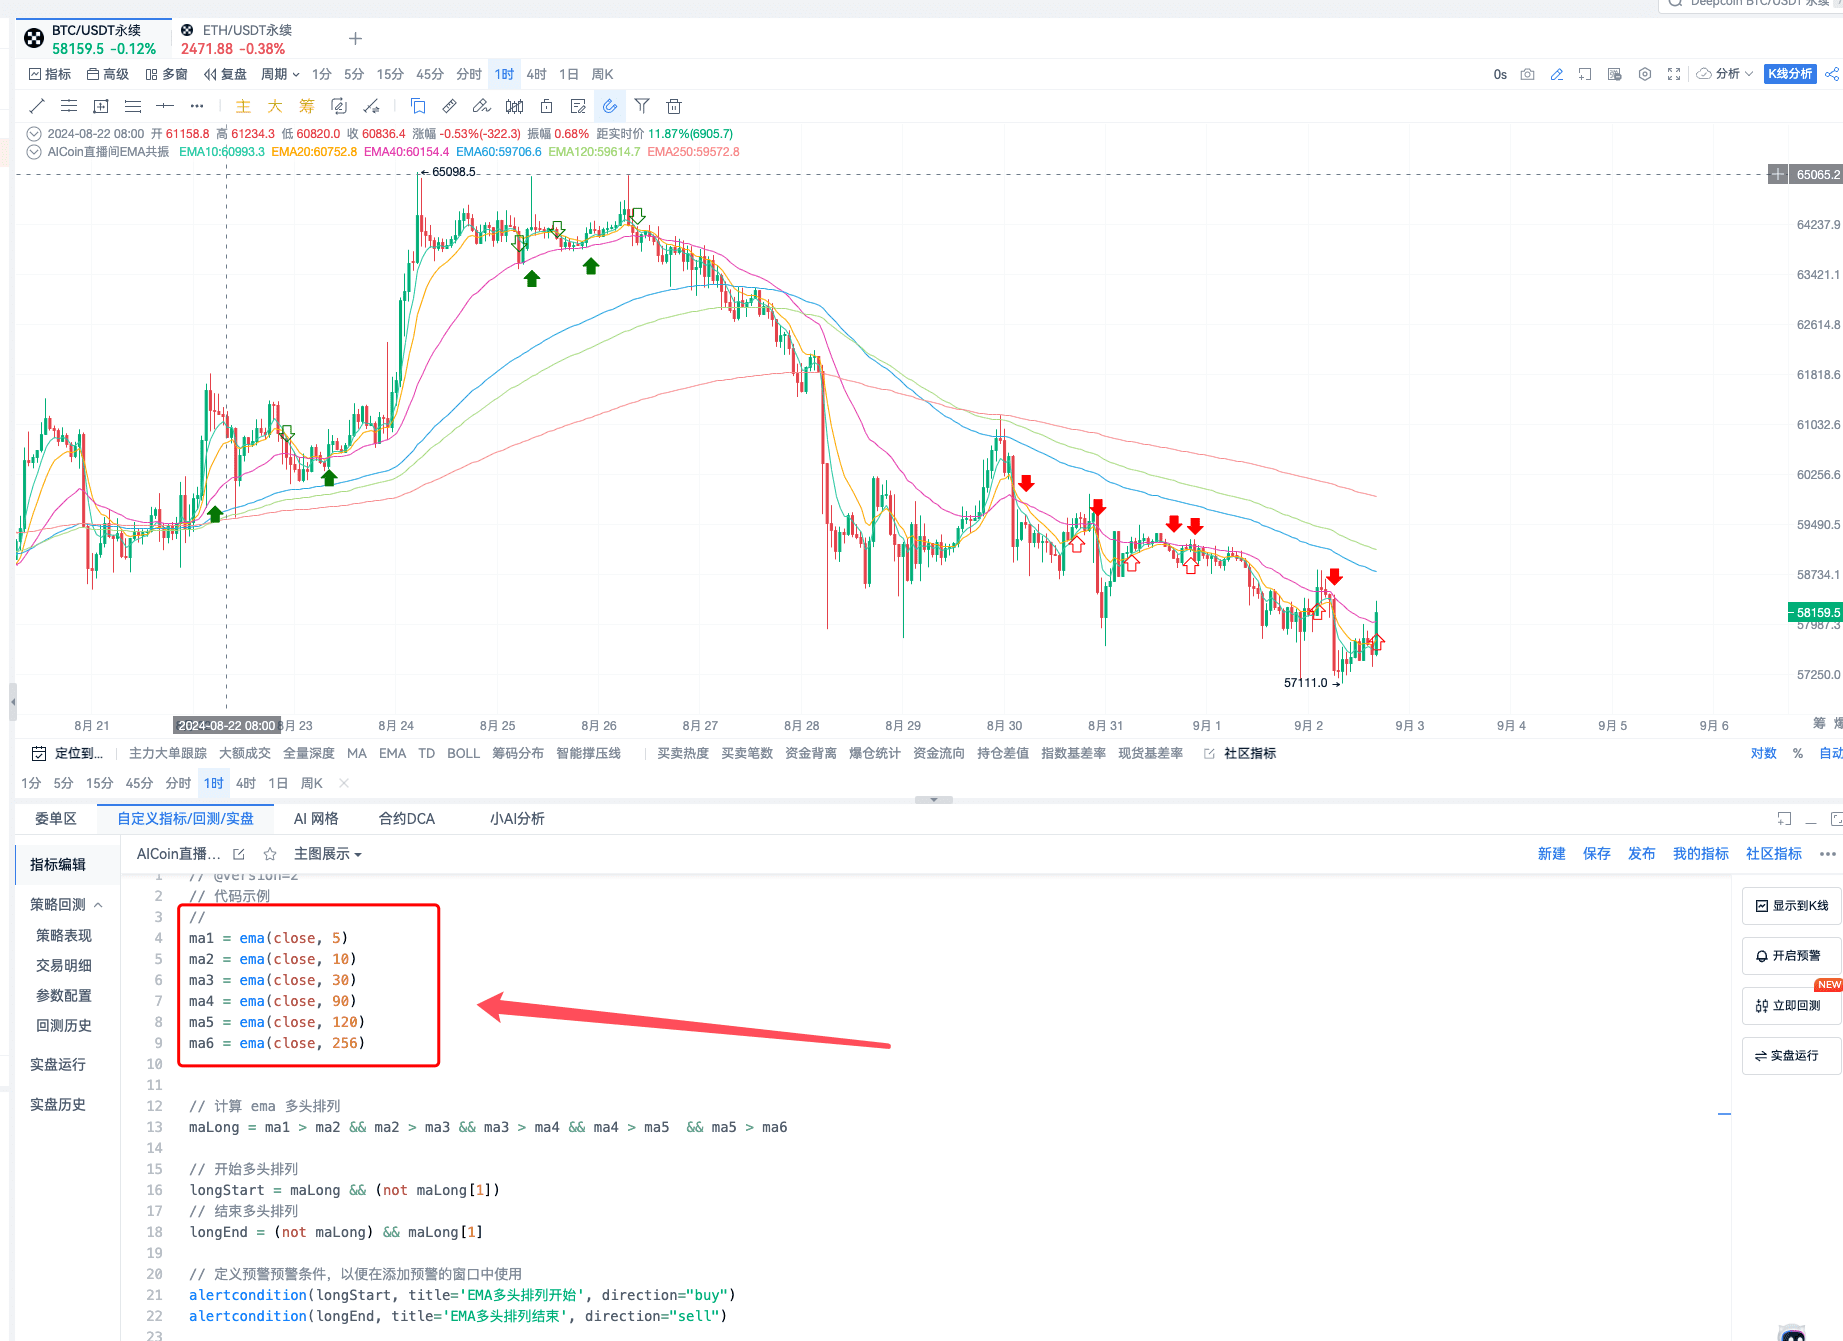
Part Two:
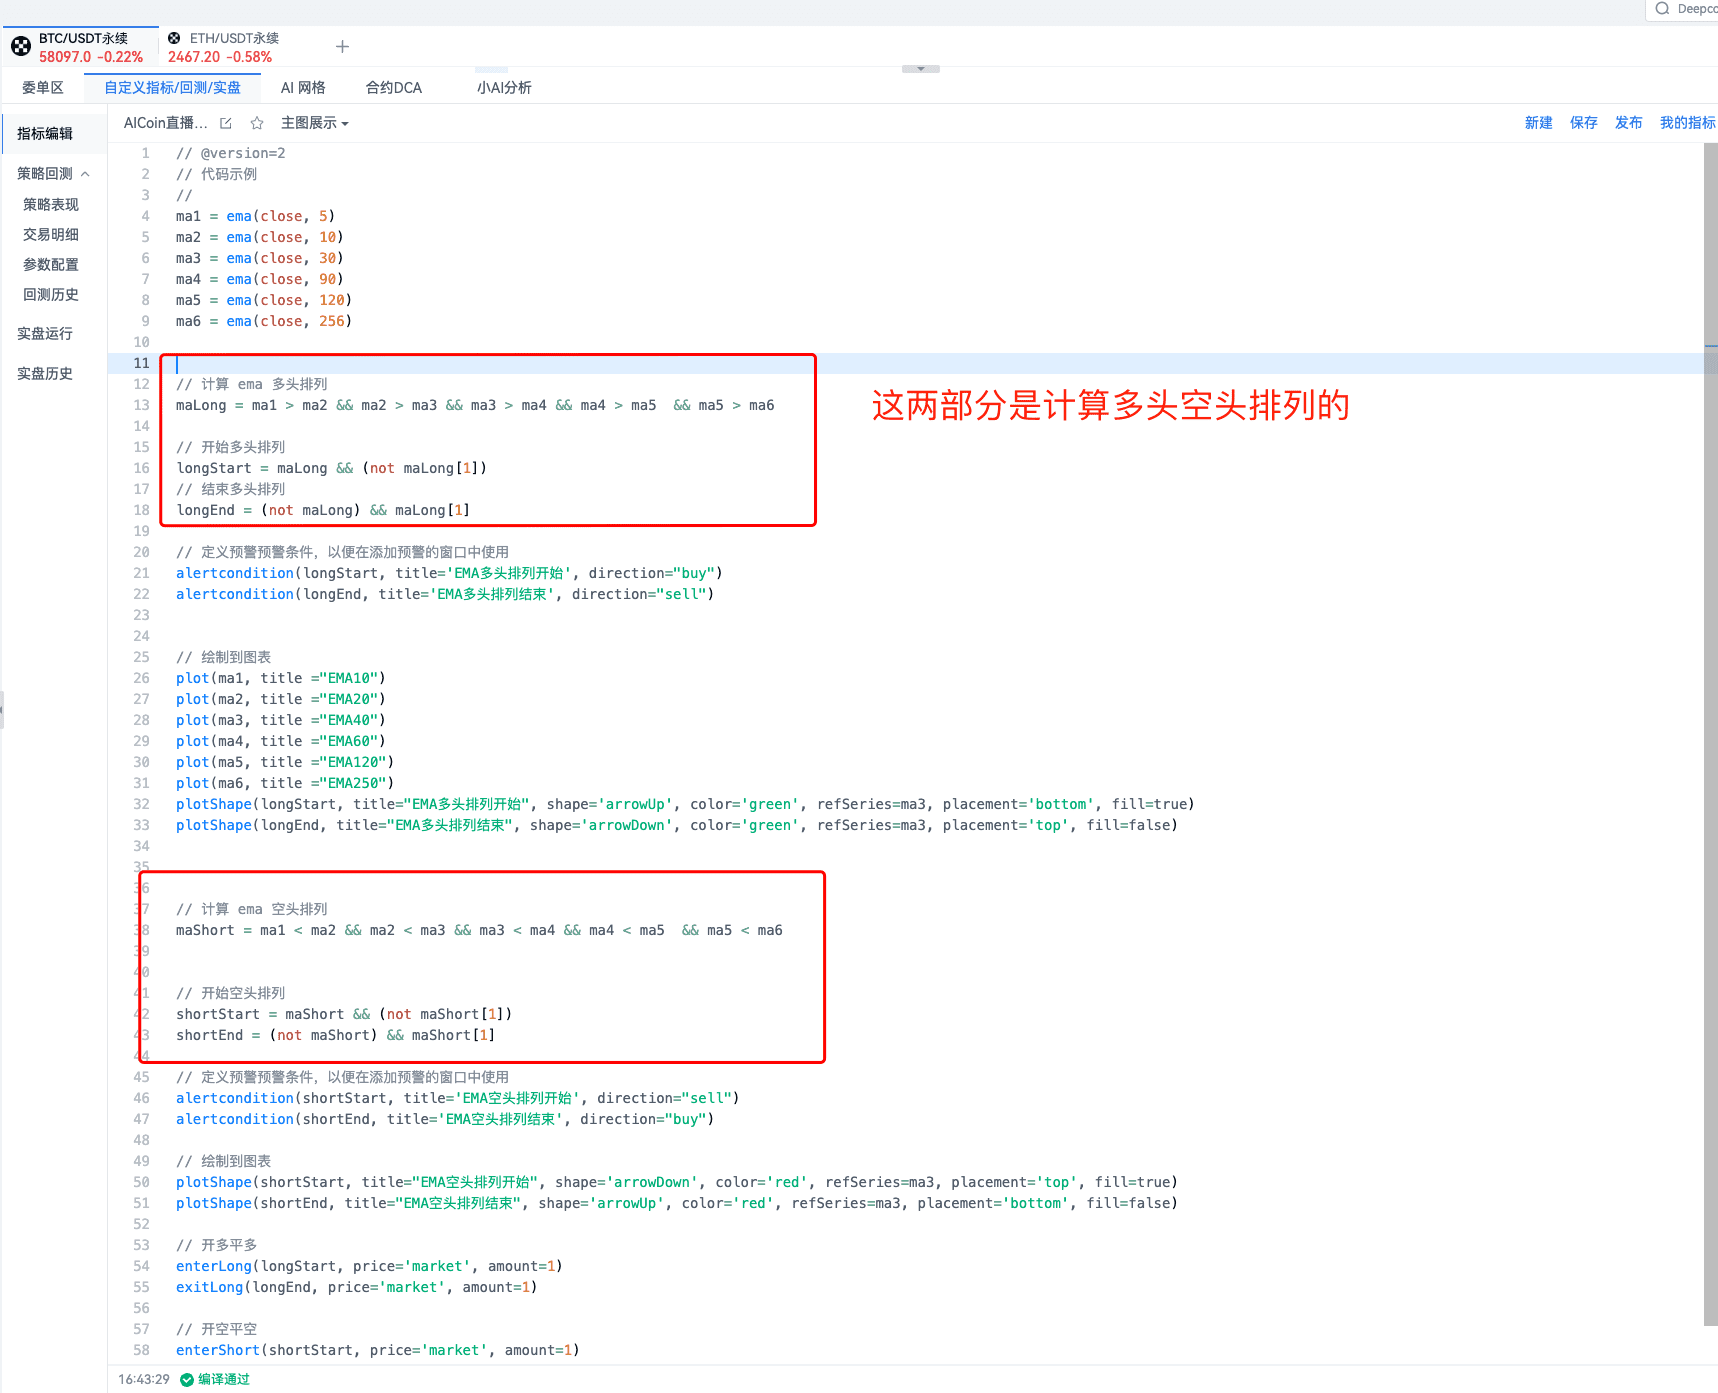
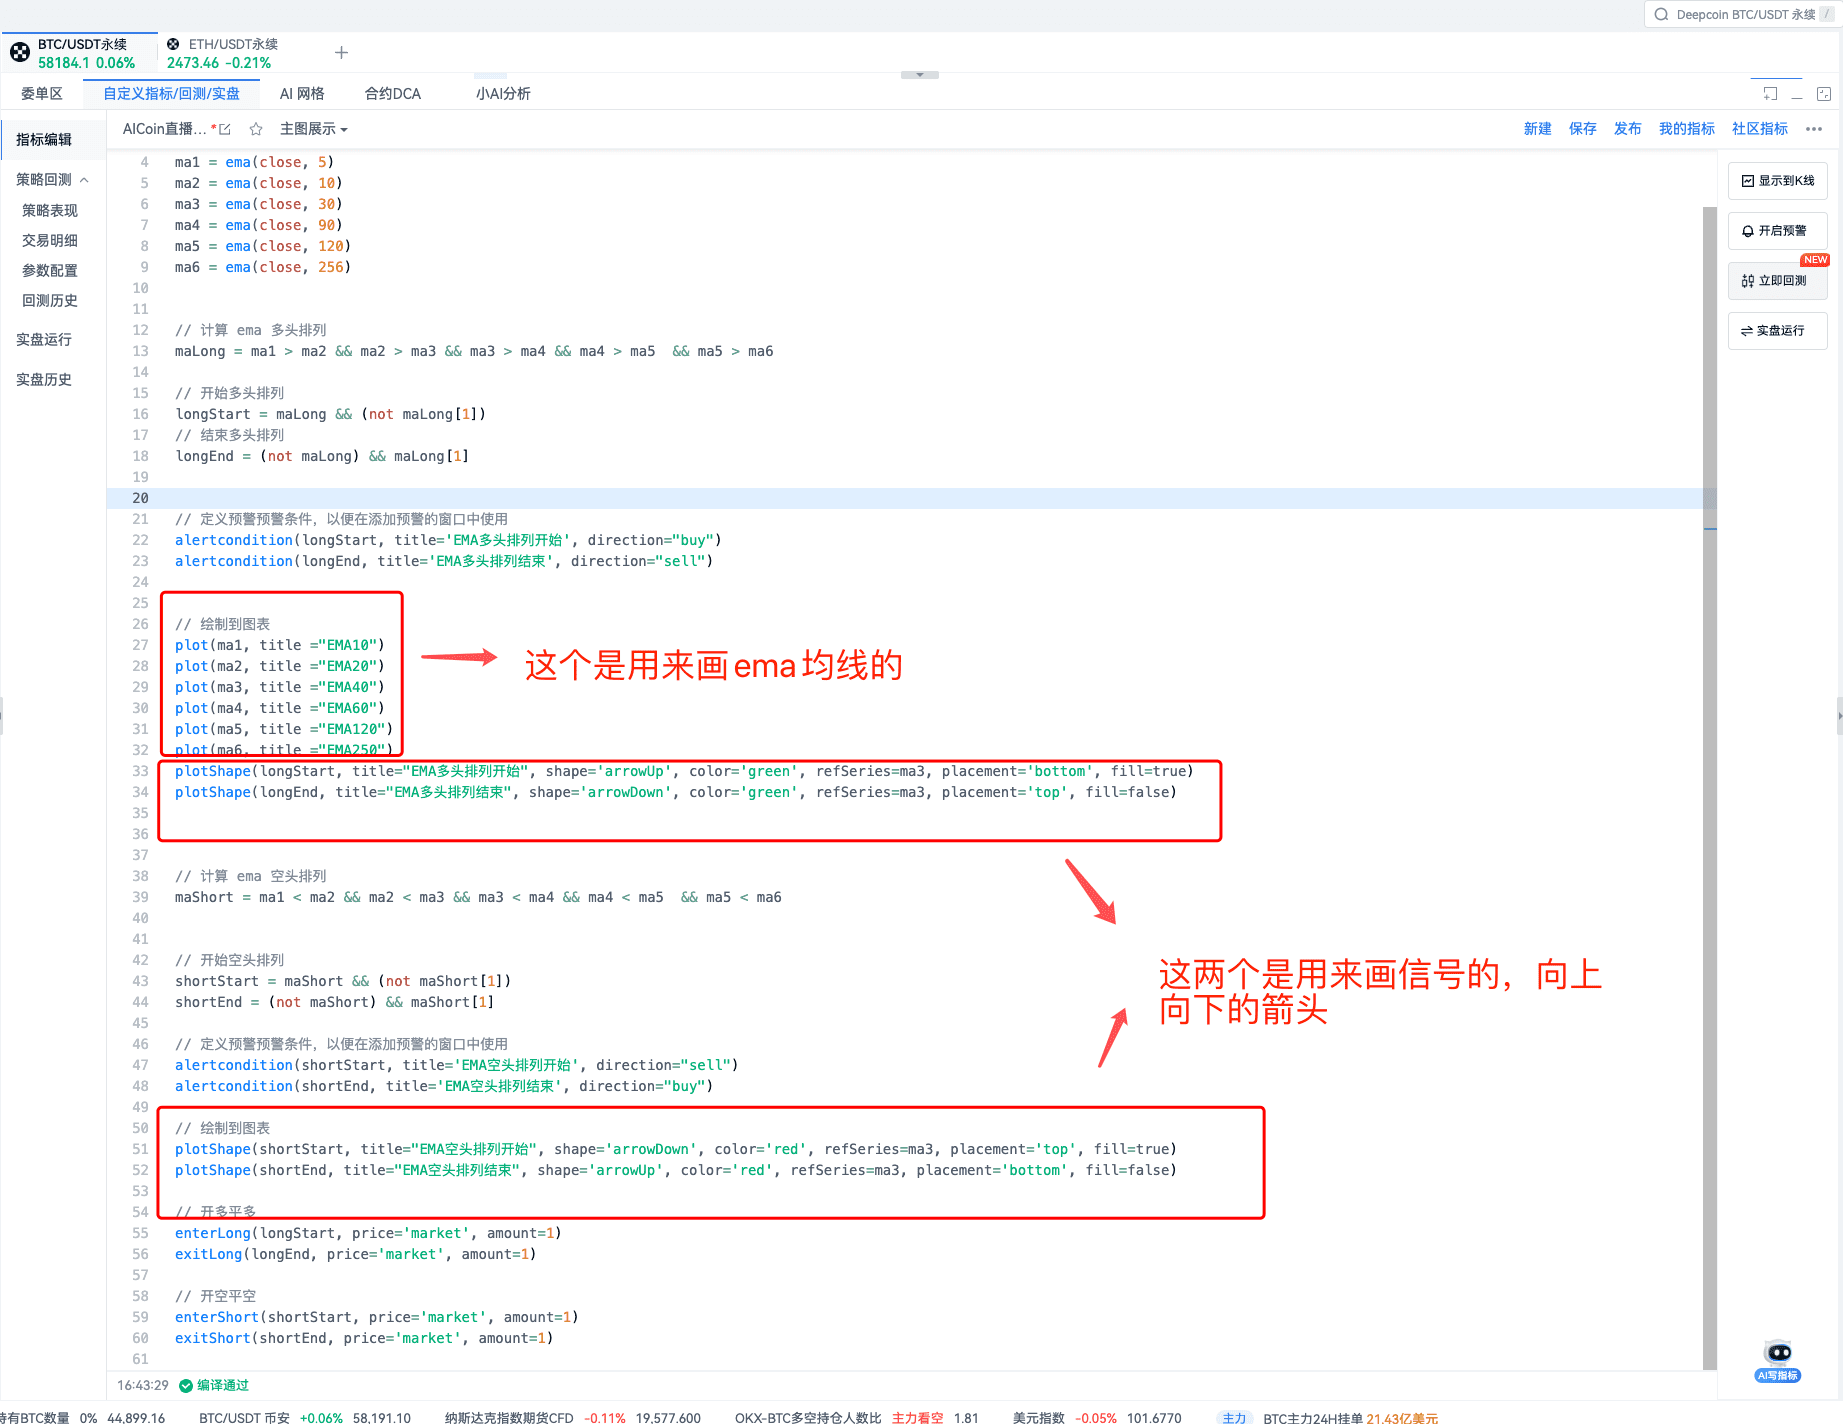
These two parts are used to send alerts:
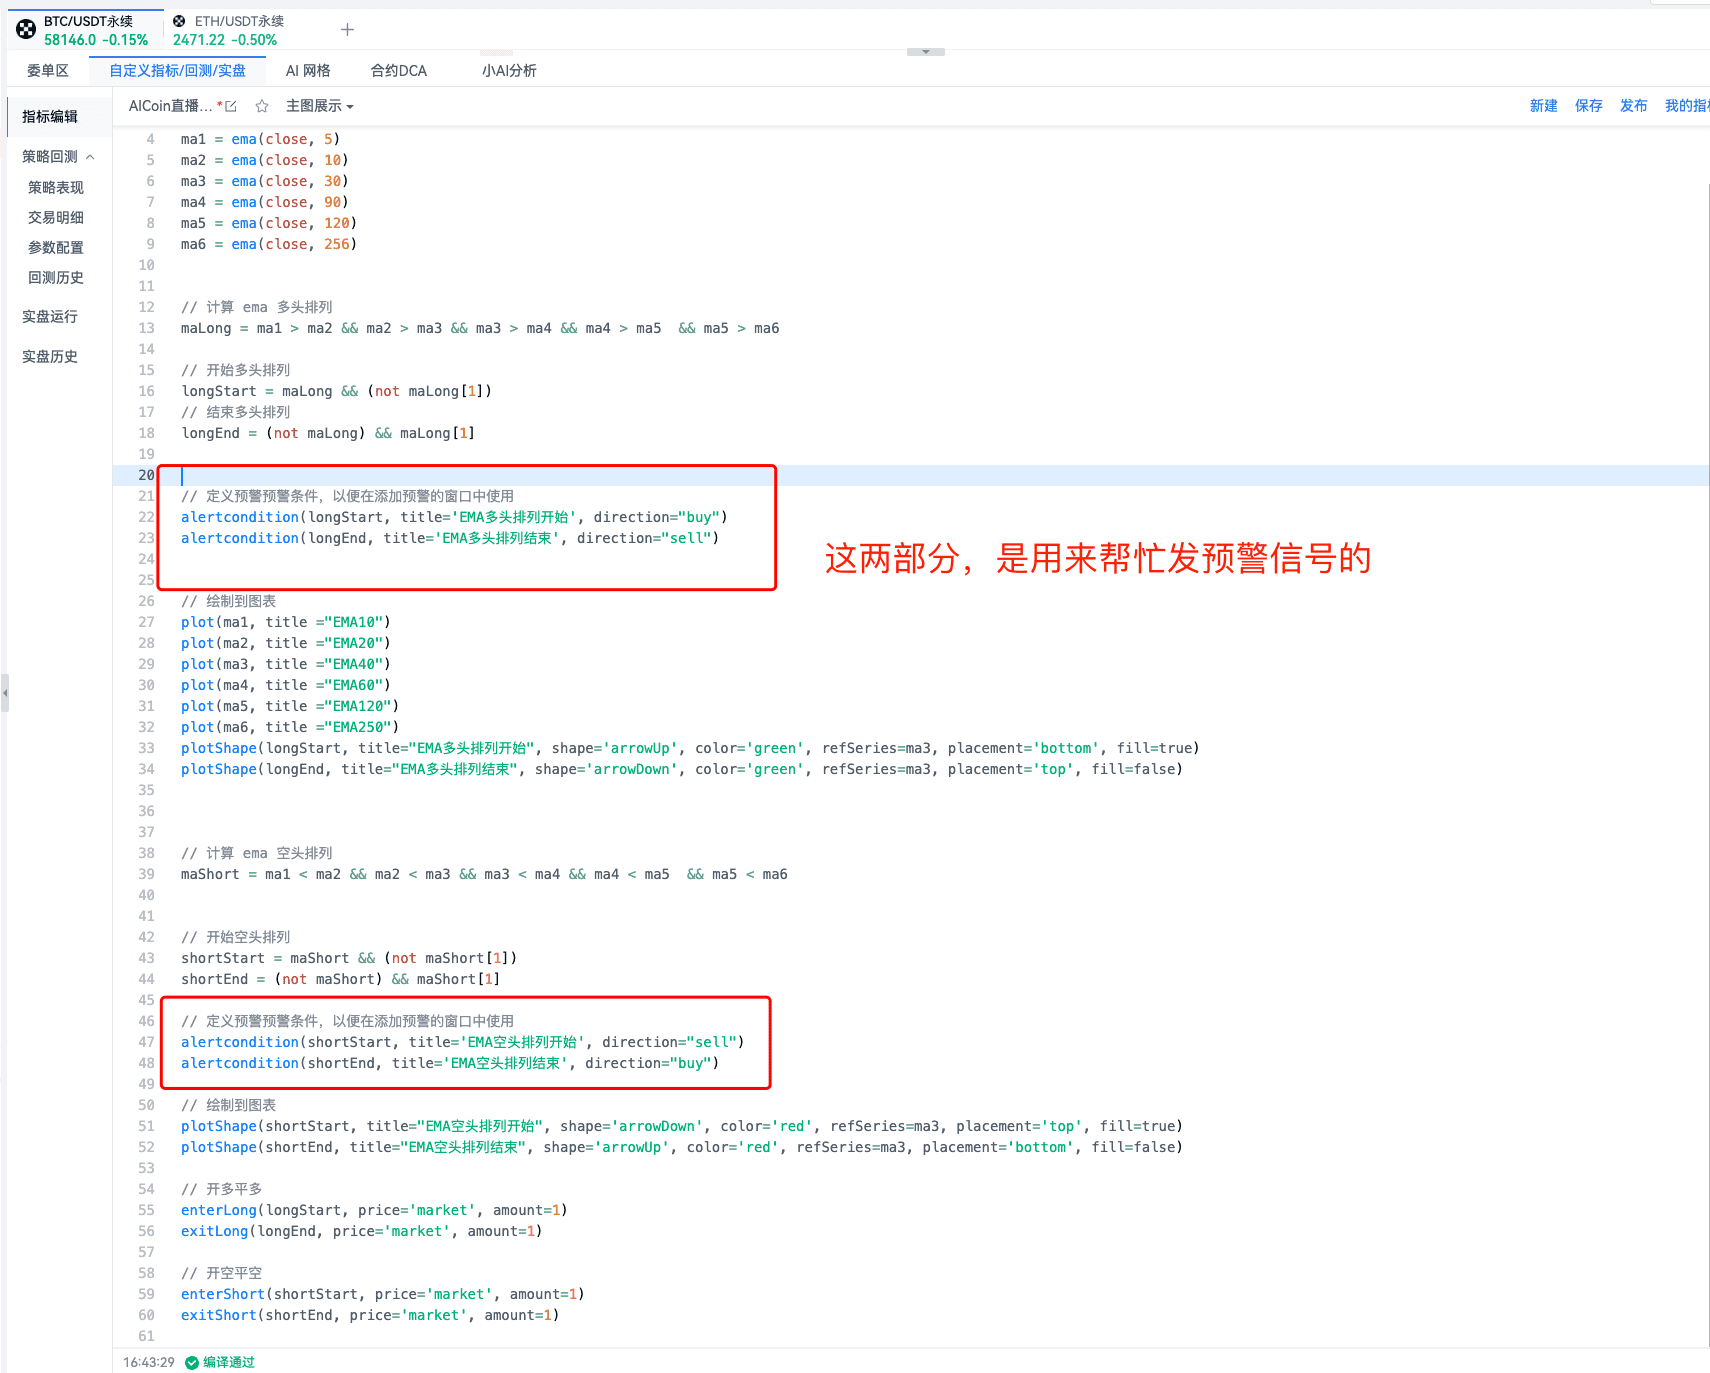
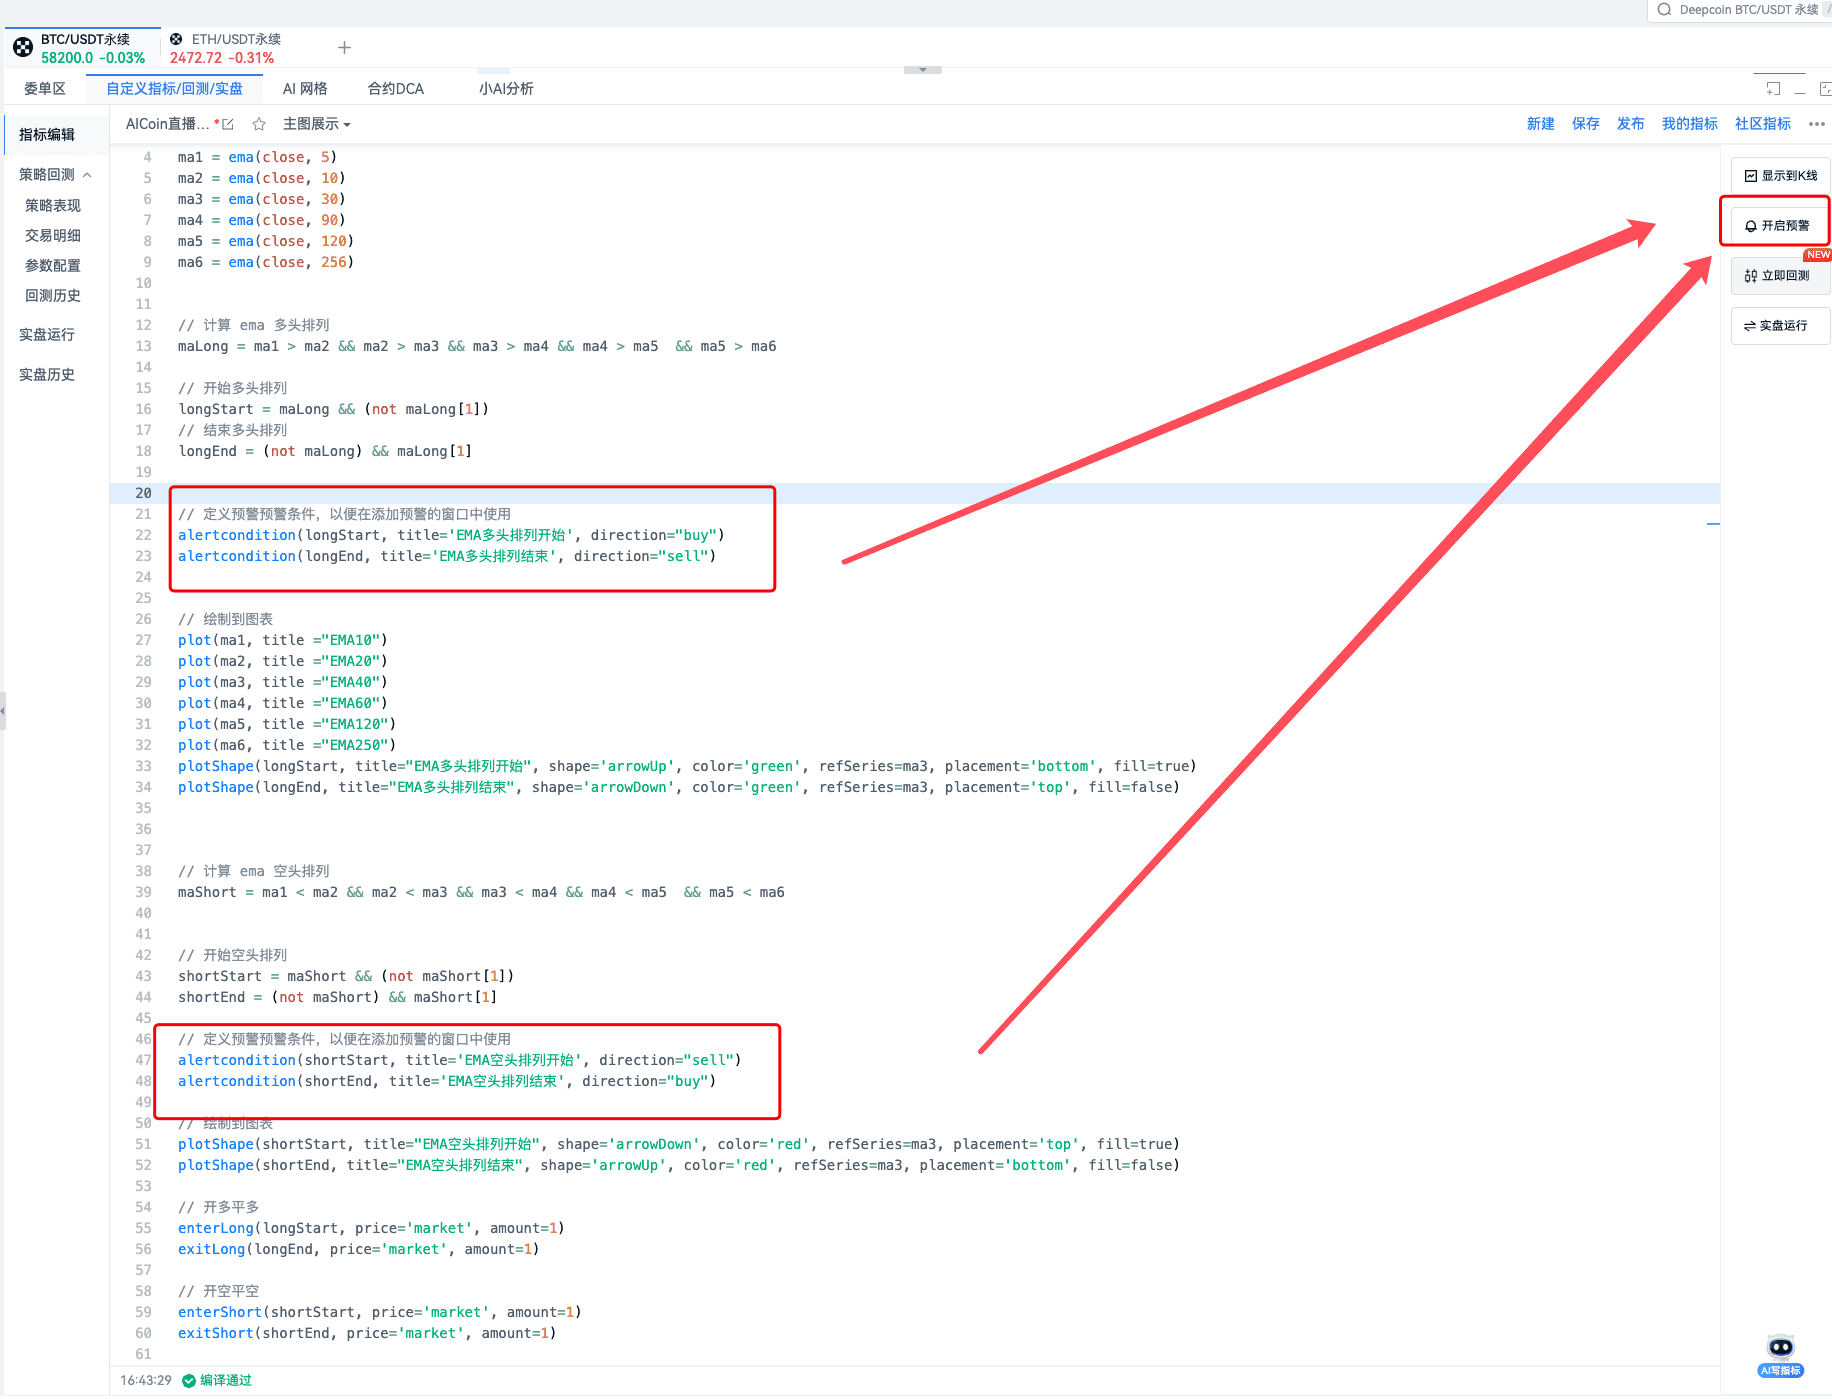
If you find it difficult, you can use the "AI Help to Write Indicators" at the bottom of the software. 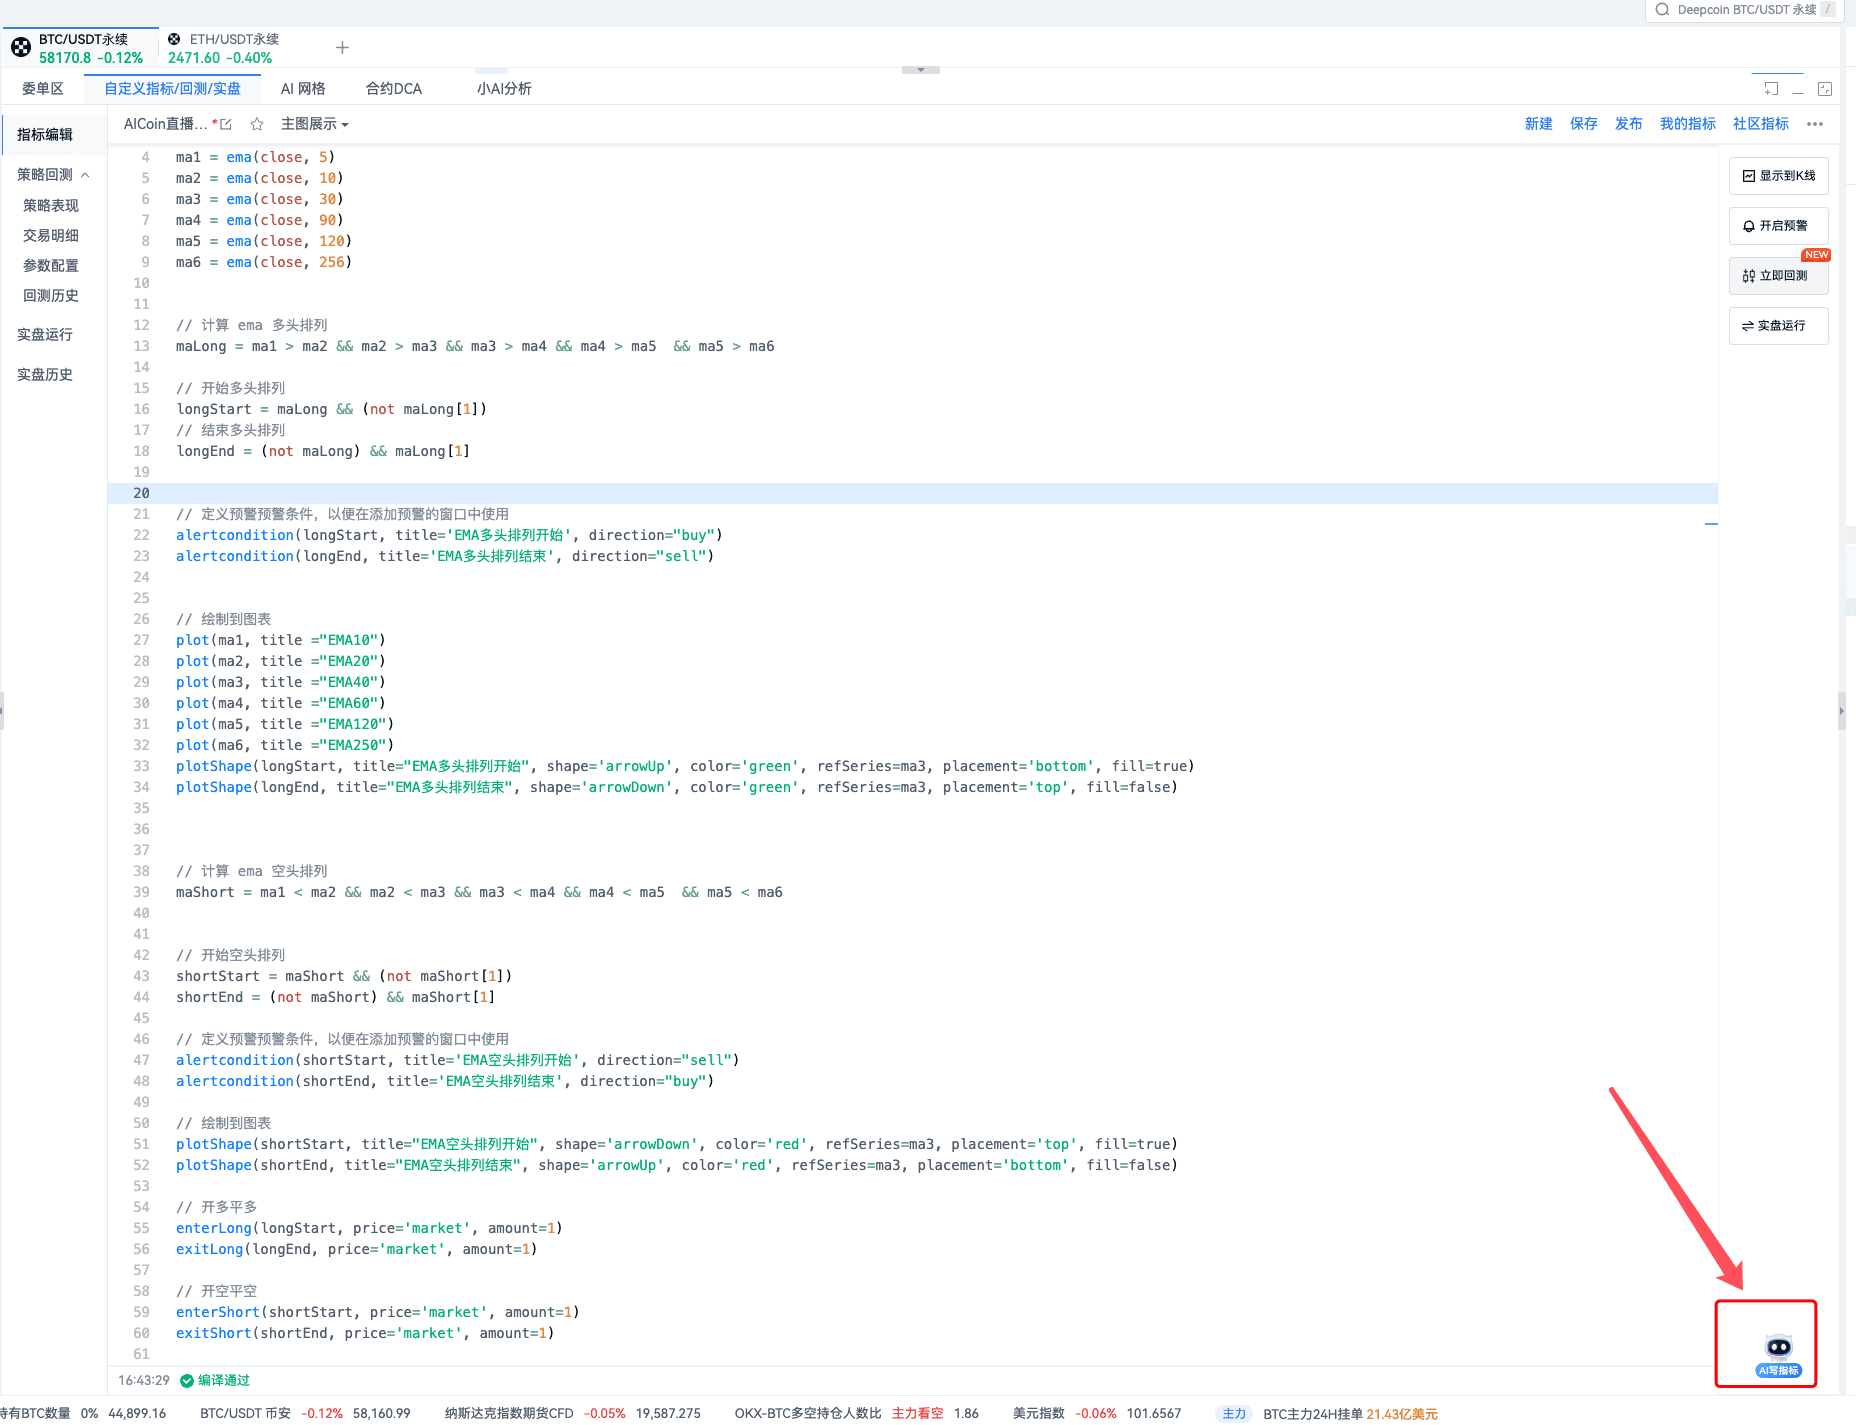
Part Three, Drawing Signals on Candlestick Charts.
Drawing signals on candlestick charts not only makes it easier for you to identify them and see the market more clearly, but also allows you to share them in the community indicators for your friends to subscribe to, so they can receive the same signals as you.
This part is for drawing:
If you find the above operations difficult to complete, you can become a VIP member and have us do customizations for you~
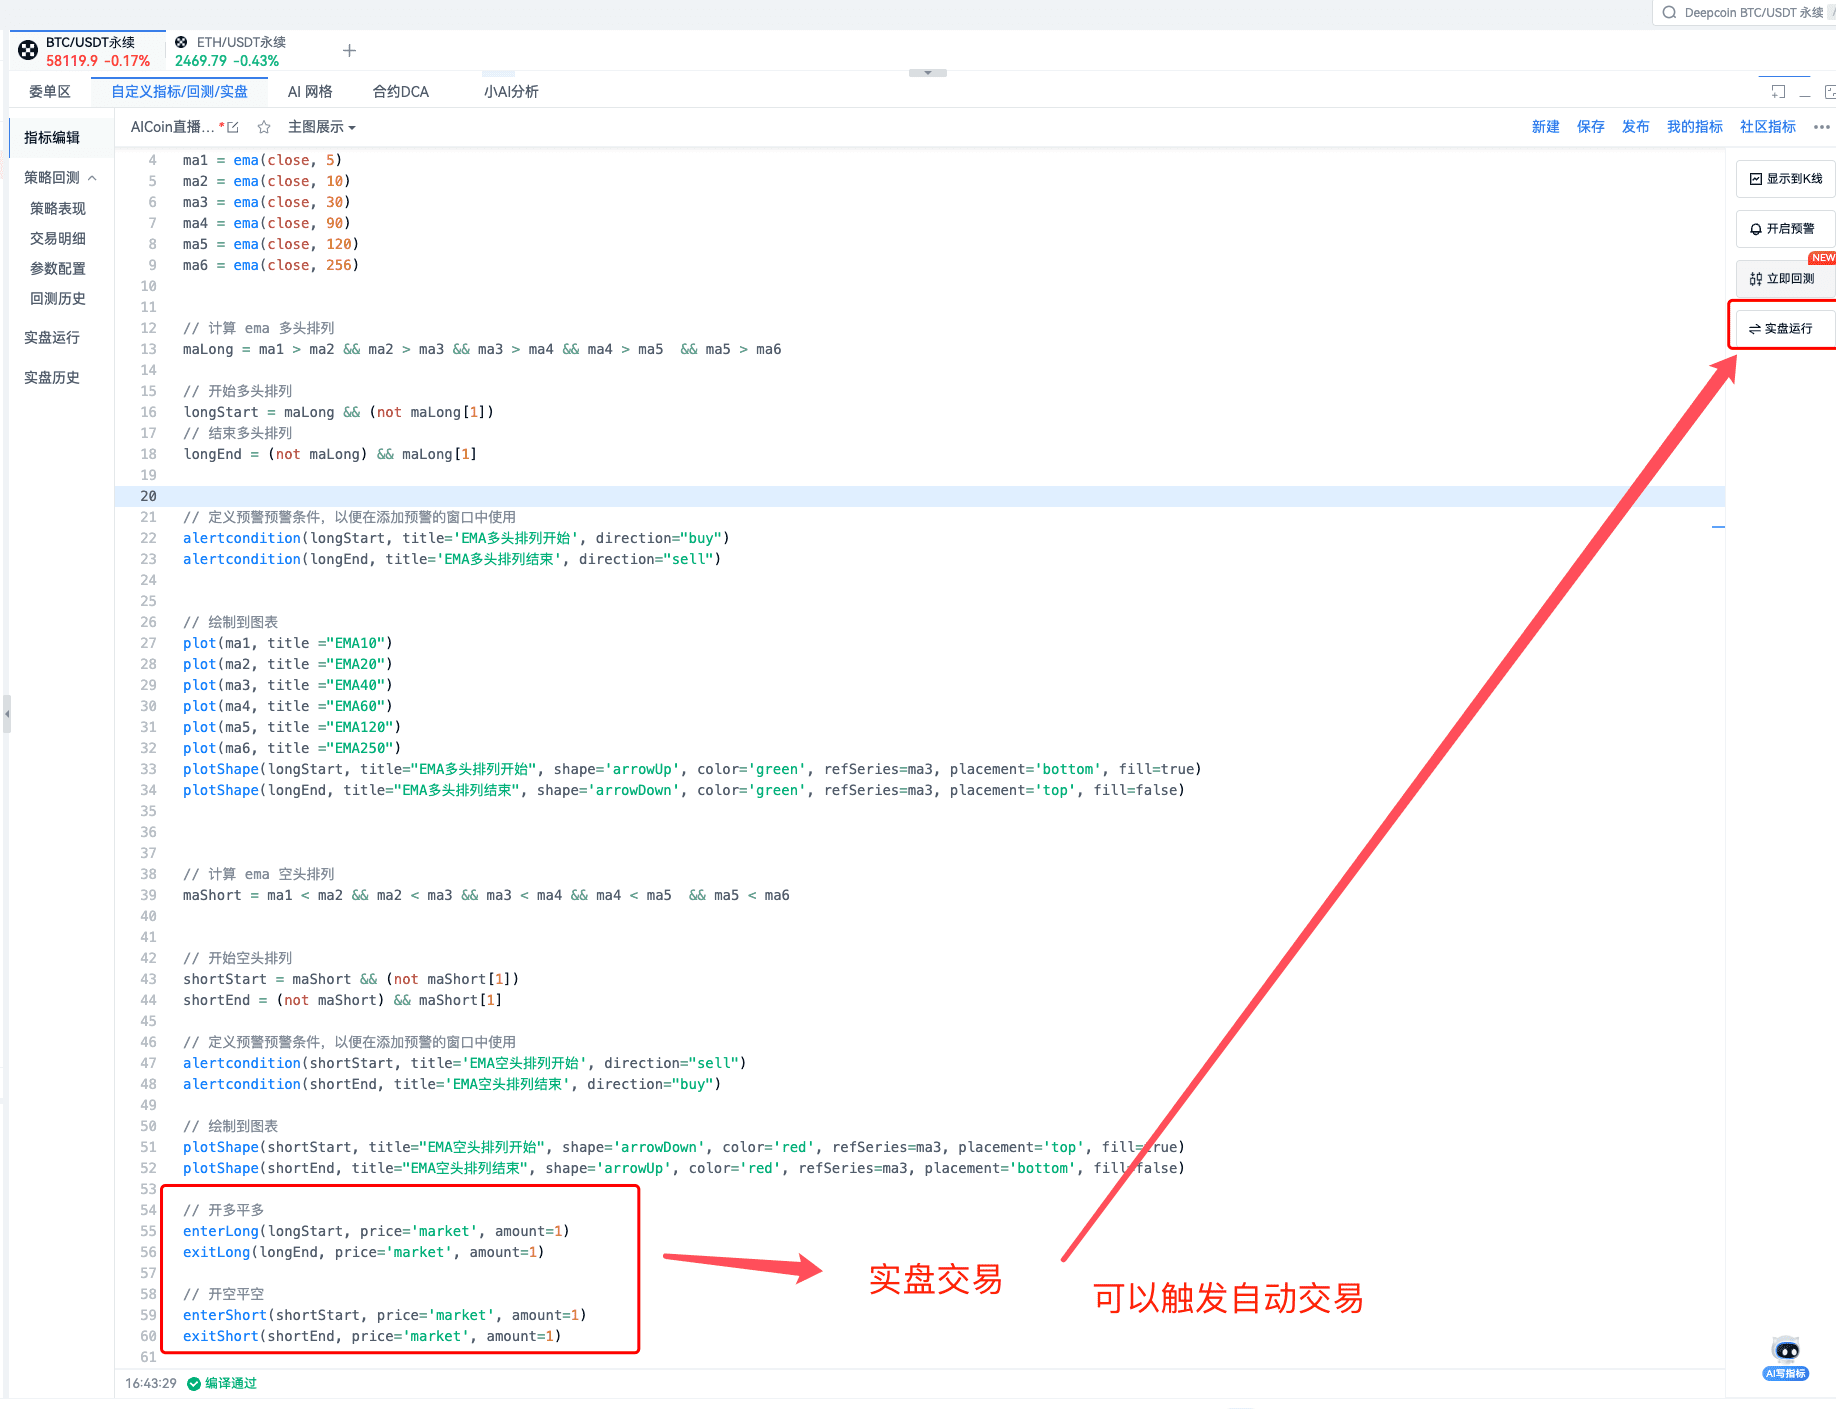
Part Four, Live Trading.
You can conduct live trading through scripts, as shown in the following image:
免责声明:本文章仅代表作者个人观点,不代表本平台的立场和观点。本文章仅供信息分享,不构成对任何人的任何投资建议。用户与作者之间的任何争议,与本平台无关。如网页中刊载的文章或图片涉及侵权,请提供相关的权利证明和身份证明发送邮件到support@aicoin.com,本平台相关工作人员将会进行核查。


