Trading philosophy: Look at the trend in the long term, and find the position in the short term.
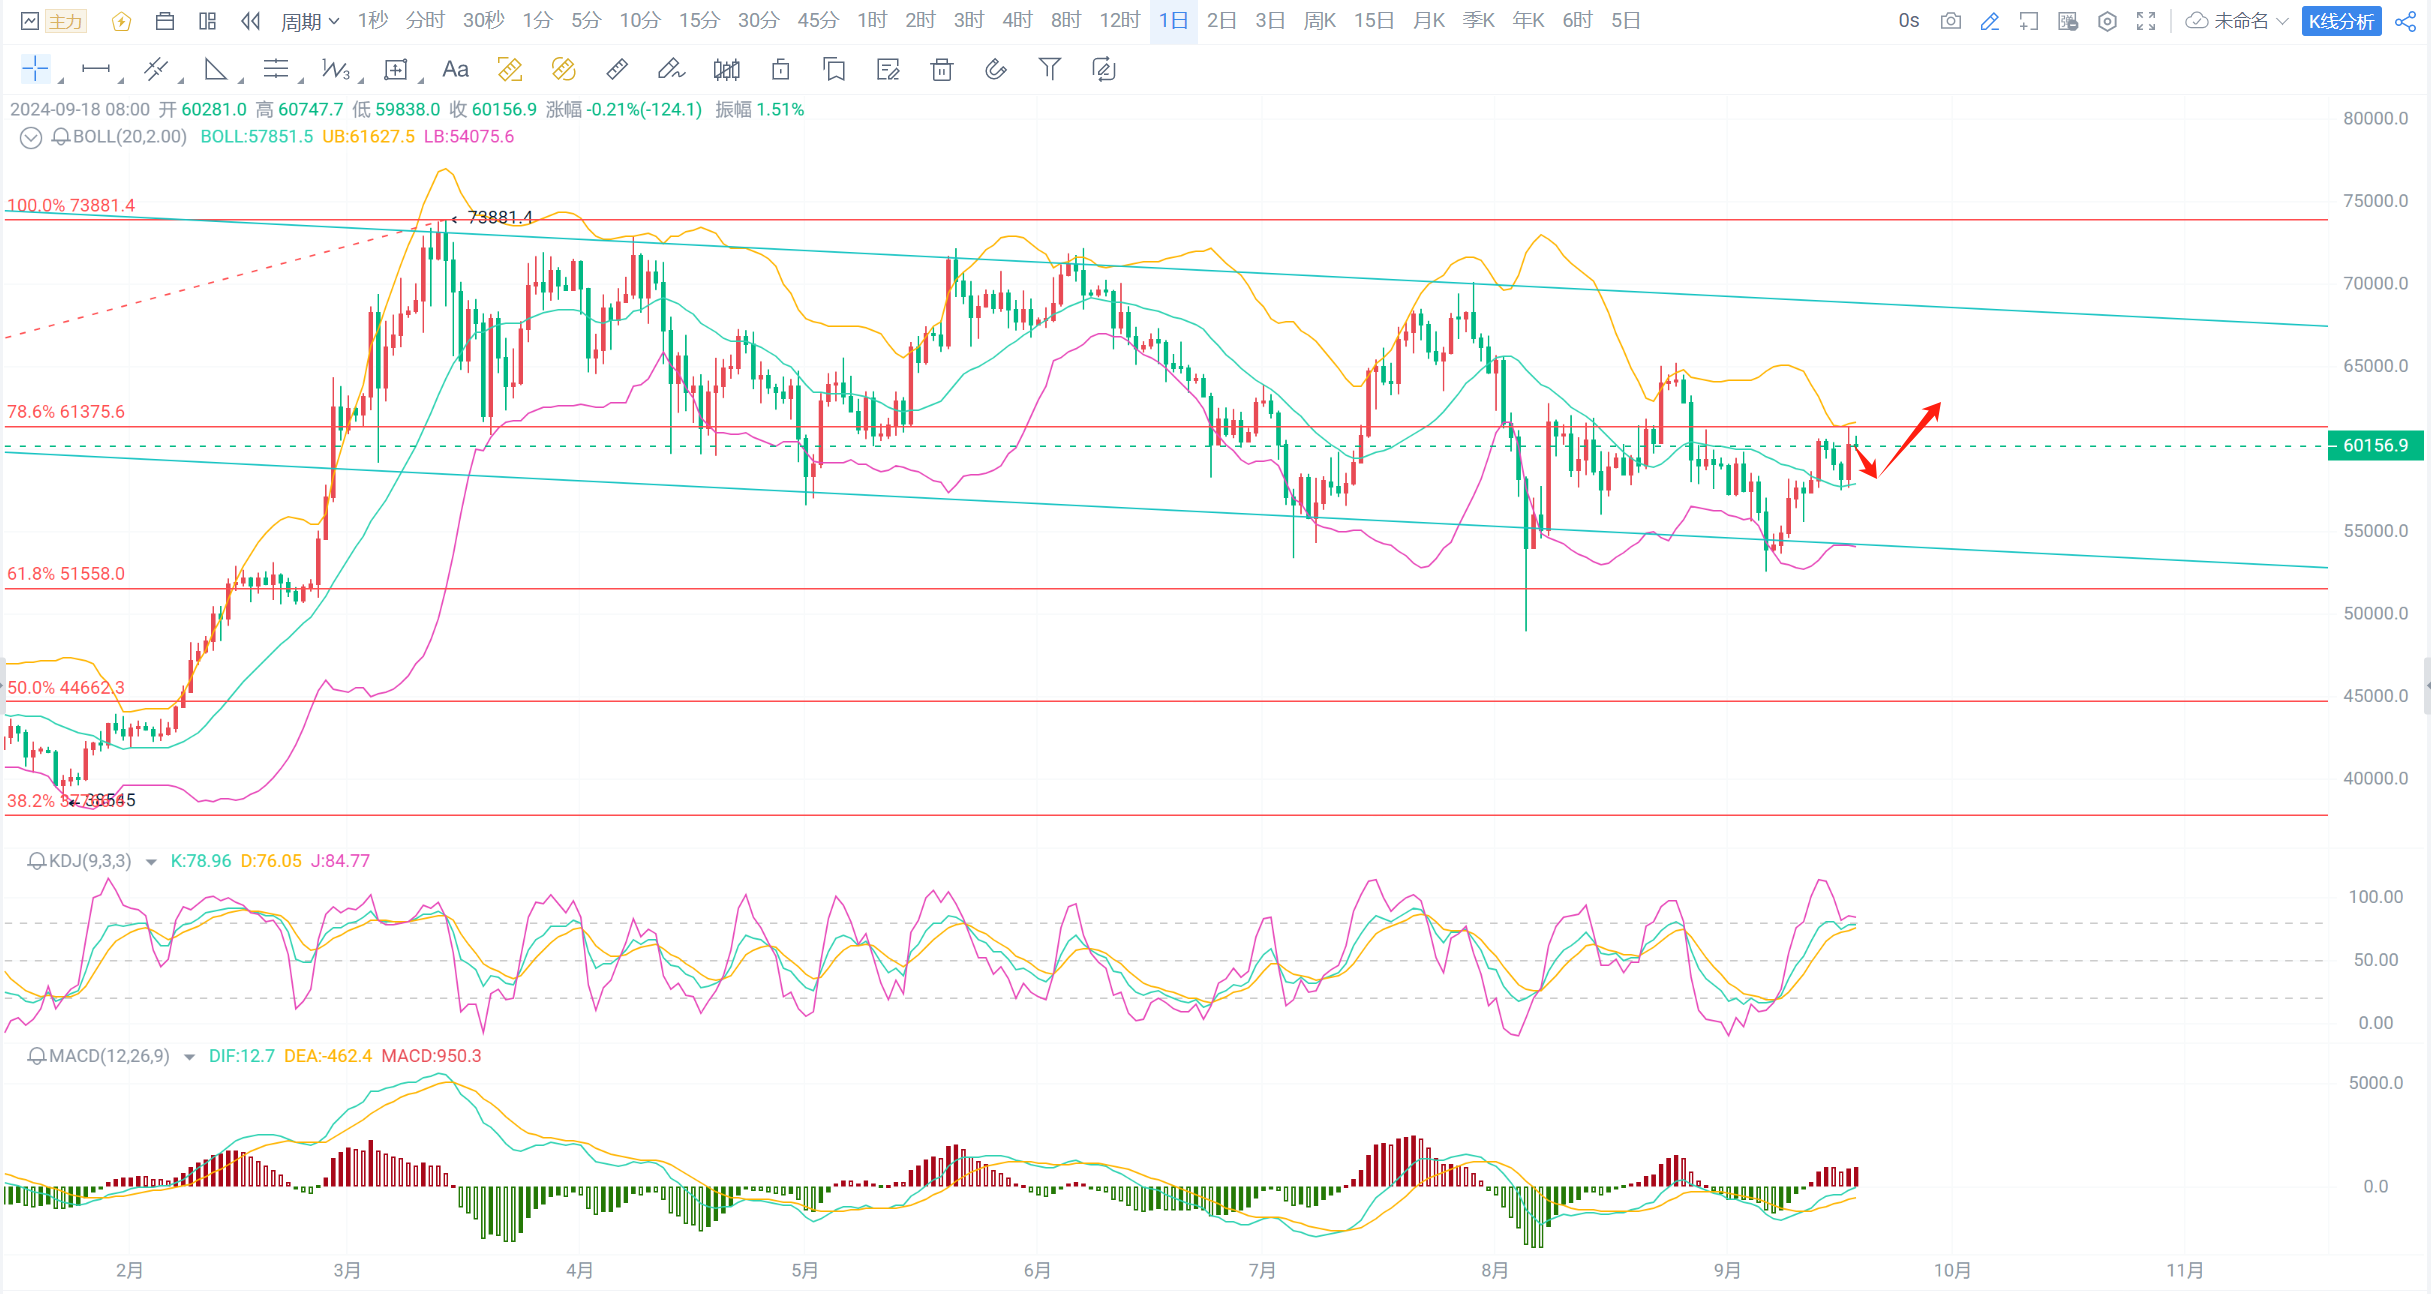
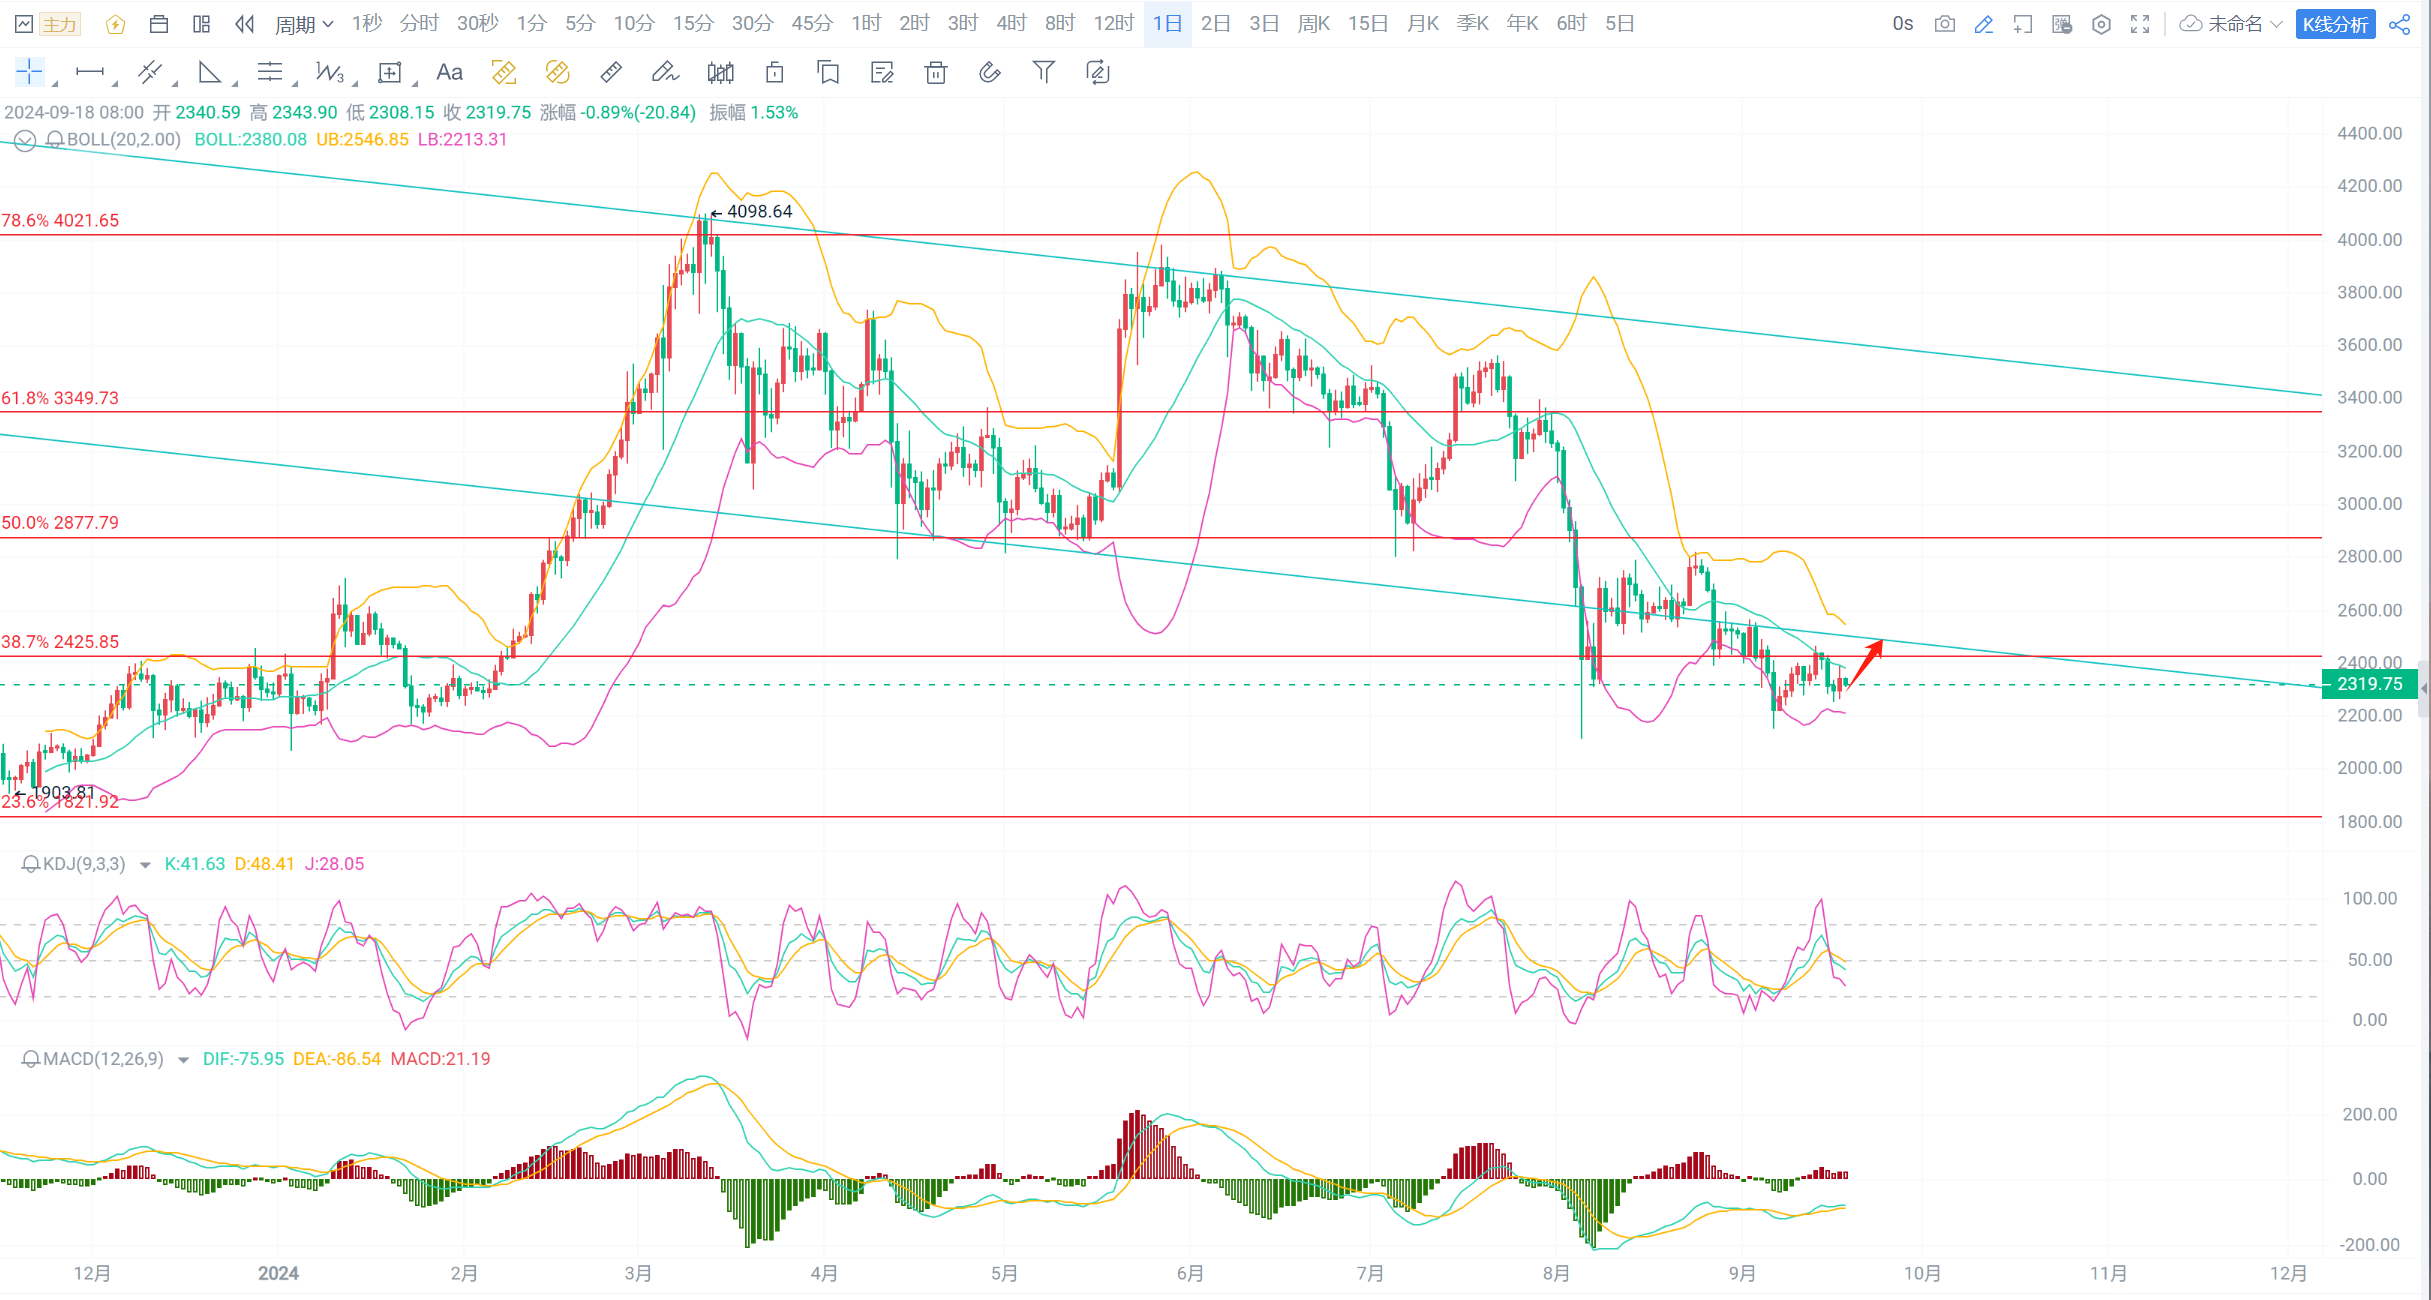
Technical analysis: Regarding Bitcoin, the daily chart retraced to the middle track of the Bollinger Bands and closed with a bullish engulfing pattern, the Bollinger Bands started to expand, the MACD moving average trended upwards, the bullish volume continued to increase, and the KDJ line moved flatly upwards. On the 4-hour chart, the MACD moving average and KDJ line continued to trend upwards, and the bullish volume continued to increase. As for Ethereum, the technical indicators at all levels are basically synchronized with Bitcoin.
Currently, the market has reached the important resistance level of around 61,300 for Bitcoin and around 2,420 for Ethereum. It has tested the pressure and fallen back once, but the probability of the early morning announcement of the US Federal Reserve interest rate being in line with expectations is high, so there may be positive news. Therefore, the bulls may take advantage of this data to break through the upward trend, so we can prepare in advance to enter the market with long positions!
Operational advice: Go long!
Reference:
Long position for Bitcoin at 59,000-59,500, target 60,500-61,500, defend at 58,500;
Long position for Ethereum at 2,280-2,300, target 2,400-2,450, defend at 2,240;
The strategy is time-sensitive, and specific guidance in real time is subject to private instruction!
Follow WeChat public account "允彦"!

免责声明:本文章仅代表作者个人观点,不代表本平台的立场和观点。本文章仅供信息分享,不构成对任何人的任何投资建议。用户与作者之间的任何争议,与本平台无关。如网页中刊载的文章或图片涉及侵权,请提供相关的权利证明和身份证明发送邮件到support@aicoin.com,本平台相关工作人员将会进行核查。


