Spreading the Way of Trading, Enjoying a Wise Life.
The Federal Reserve cut interest rates by 50 basis points, of course, favorable for the cryptocurrency market. Yesterday, after a brief dip to $59,500, Bitcoin quickly rebounded to reach a recent high of $62,500. So far, the price of Bitcoin has reached $62,500 and has since experienced a slight pullback. Can Bitcoin stand firm at the weekly turning point, and have altcoins already started to bottom out?

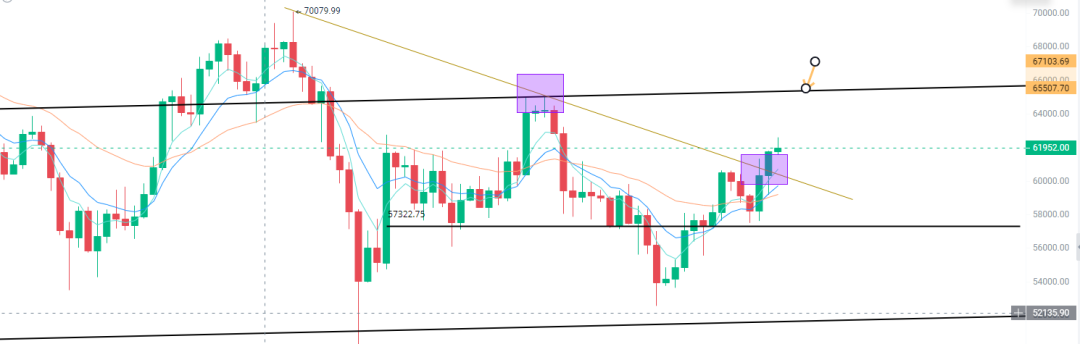
Today, let's discuss these two topics. Regarding the price trend of Bitcoin, the day before yesterday, Bitcoin saw a long bullish candlestick with a significant upper shadow, indicating selling pressure above, and forming a bullish piercing pattern, along with the previous four days' candlesticks forming a Three Advancing White Soldiers pattern. In my opinion, it was highly likely that yesterday would form a large volatility range or a consolidation range, and of course, it cannot be ruled out that it may continue to be driven upward by favorable news. After a minimum retracement to the 10-day moving average of $59,200, Bitcoin surged upward again, and the daily moving average showed divergence to the upside, which is the first point.
Secondly, Bitcoin also broke through the downtrend line from $70,000 to the present, so if it retraces to the $60,600 level, it may receive some support. As for the resistance above, in the short term, we should look for the area near $65,000, which is the upper boundary of the channel and the relative horizontal resistance of the previous downtrend line. For support to the downside, everyone should refer to the 5-day moving average and the 10-day moving average, and for resistance to the upside, we should refer to the upper boundary of the channel and the position of the previous horizontal trend line near $65,000.
If you didn't enter the market at $59,500 yesterday, is there still a chance to speculate on a rebound? If you don't have a position at $60,600, you can consider taking a position here!

The short-term opportunity for Bitcoin is to look at it from the daily chart level, and from the weekly chart level, if Bitcoin shows an exceptional breakthrough, we will be optimistic about its future price trend in the coming months.
I have repeatedly emphasized that our standard for Bitcoin on the weekly chart must form a Three White Soldiers pattern between 5 weeks, 10 weeks, and 30 weeks, and secondly, its MACD indicator is best to form a golden cross above the 0 axis. If a golden cross resonance is formed here, it means the establishment of a new upward trend for Bitcoin. However, it is still slightly lacking at the moment. The price trend of Bitcoin seems to be moving in the direction we expected, with the 5-week moving average already starting to turn upward. So, today is Thursday, and we will see if it can close with a medium to long bullish candlestick by next Monday, and it would be best if the 5-week and 10-week moving averages can form a golden cross, at which point we can further increase our position.
Patiently wait for this exciting moment to arrive. Before it is confirmed, we cannot be aggressive in our operations. Considering the uncertainty of Bitcoin and the entire trading market, we must adhere to the trading philosophy of not predicting or speculating, and wait for further confirmation of the market. Of course, as mentioned earlier, if you are out of the market, then if Bitcoin retraces to the $60,600 to $60,700 level on the daily chart, you can consider entering a portion of your position. If you think Bitcoin's price is expensive, it may become even more expensive in the future. In addition, the fast line of the MACD indicator on the daily chart has started to rise above the 0 axis, which is a good sign. Looking back at the price of Ethereum, it is still consolidating below the 30-day moving average of $2,450 on the daily chart, showing weakness. From the weekly chart level, does Ethereum have a chance? The MACD indicator is gradually starting to turn upward, so at this point, Ethereum may stabilize here and then experience a upward surge.
What is the reason? The exchange rate between Ethereum and Bitcoin has reached a very critical position, so let's see if Ethereum will make an upward push under favorable conditions.
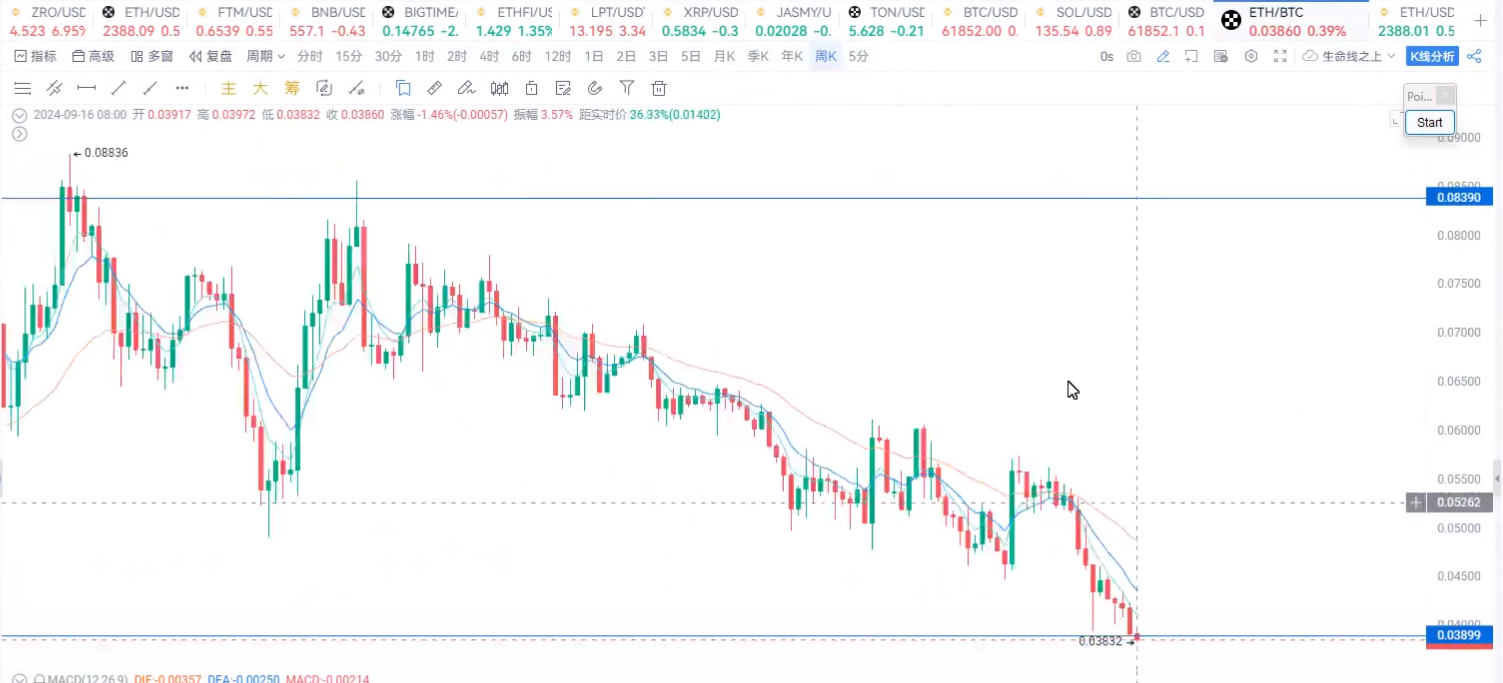
The trend of altcoins is what we need to focus on. The overall market share of altcoins has once again come to a very critical support trend line.

From the monthly chart level, the market share of altcoins in 2017, as well as in 2020 and 2021, just fell on the upward trend line, and in June 2023 and September 2024, it once again fell on the trend line. From a technical perspective, there is no reason for the market share of altcoins not to rebound. Some clues can also be seen from the weekly chart level, where it is also consolidating at this position, and there is also a possibility of a golden cross in the MACD indicator. In this situation, the overall performance of the altcoin market will present a new situation, and we must patiently wait for Bitcoin to break through the turning point on the weekly chart and form the standard we mentioned.
For those who are on the sidelines or have no position, I want to emphasize that if you still feel anxious, it should be a problem with your mindset. You might as well review the trading principles that I have shared with you in the class, whether it is the price fluctuating, the waves fluctuating, or our minds fluctuating? If the fluctuation of candlesticks and prices affects your emotions, it means that your cultivation is not yet sufficient. If Bitcoin can stand firm and open a new upward trend, do you think opportunities will still be lacking?
The key is whether Bitcoin can stand firm! This is our top priority!
免责声明:本文章仅代表作者个人观点,不代表本平台的立场和观点。本文章仅供信息分享,不构成对任何人的任何投资建议。用户与作者之间的任何争议,与本平台无关。如网页中刊载的文章或图片涉及侵权,请提供相关的权利证明和身份证明发送邮件到support@aicoin.com,本平台相关工作人员将会进行核查。


