Coin Circle Liying: 9.19 CKB/Byte Price Trend Analysis: Be Careful When Sailing for a Long Time!
Recently, the K-line chart of CKB has been dancing joyfully, showing waves of upward trends. After the large bullish candle on the 13th, the price continued to soar like a rocket, but on the 18th and 19th, we saw some "long upper shadows", like a dancer gracefully dancing at a high place, implying that there is some selling pressure quietly climbing.
Technical Indicator MACD Revealed: Both DIF and DEA are held high, showing a positive posture, and the MACD histogram repeatedly emits red lights, indicating that the market is in a state of jubilation! However, the histogram on the 19th has shortened slightly, possibly indicating that the momentum is quietly weakening, so everyone please be careful.
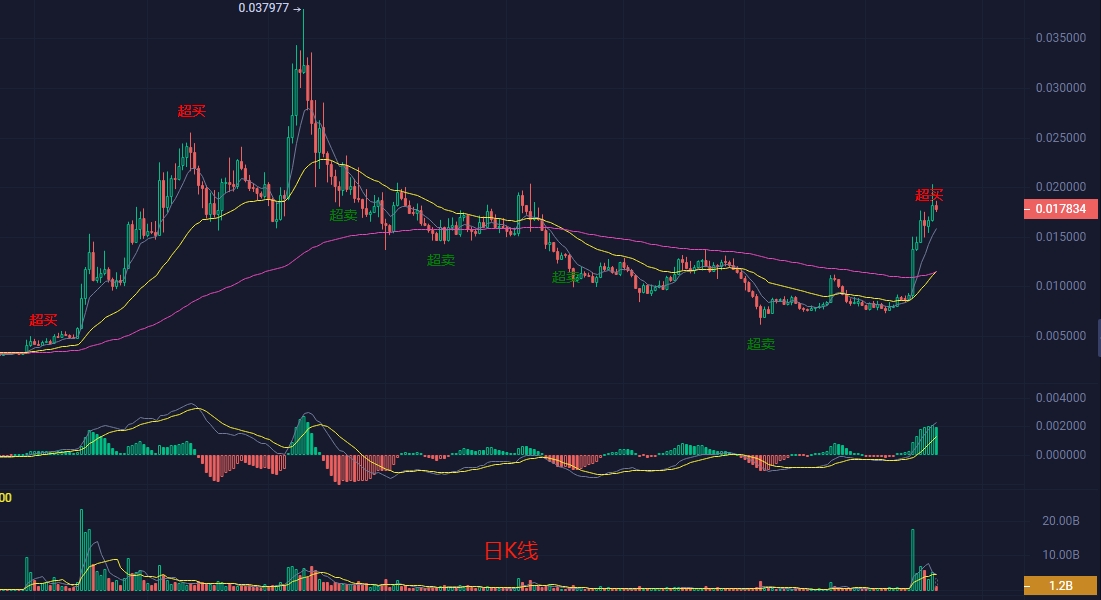
RSI: This buddy is not willing to be lonely. The RSI value for the past 14 days has mostly remained above 70, and sometimes even surged to the overbought zone close to 80, reminding us that we may face a "small crisis" of a pullback.
EMA: The short-term, medium-term, and long-term moving averages are lined up in a lovely bullish formation, supporting the overall upward trend. The current price is slightly higher than EMA7, indicating the possibility of a short-term pullback to near EMA7. Get ready to embrace some small fluctuations!
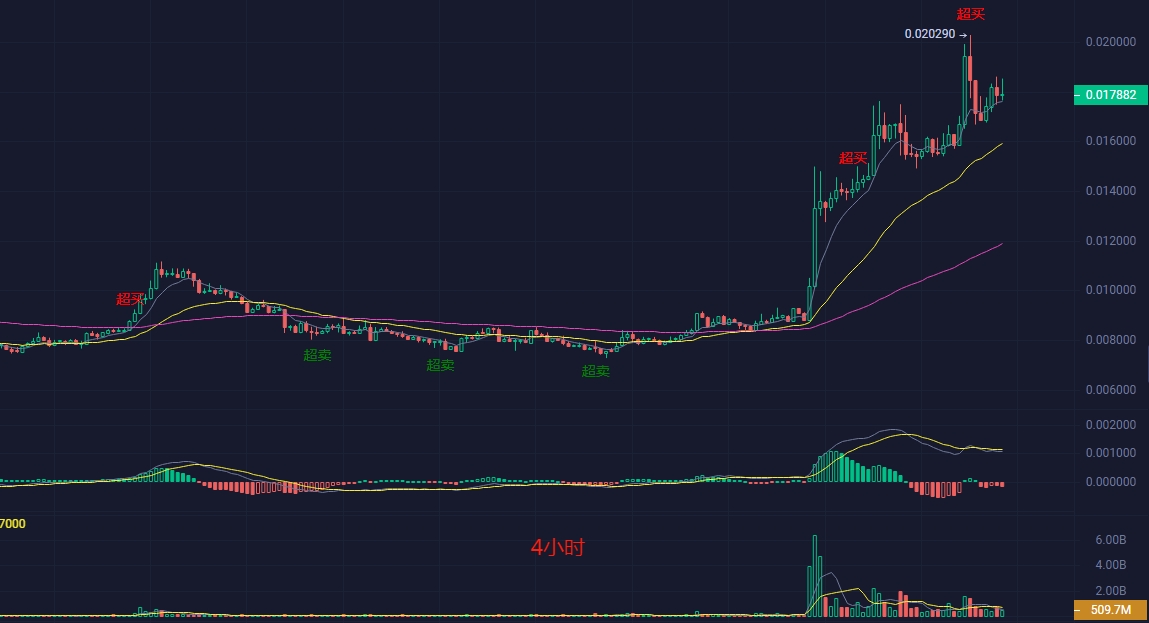
Short-term Trend Exploration:
On the four-hour K-line chart, we see a lovely small oscillating consolidation pattern, and the selling pressure above still appears somewhat strong. The four-hour MACD is also slightly tilting downwards, with DIF and DEA approaching each other, and the MACD histogram showing a bit of negative value, indicating that the market is in a state of oscillation, and the risk of a bearish trend is slowly approaching. The short-term RSI also shows the need for a pullback, so everyone needs to be cautious. Nevertheless, the EMA formation still presents a vibrant bullish alignment, and the overall trend still leans towards the bullish side.
Liying's Insights:
After experiencing a wave of sideways upward movement, the market is clearly making small profit-taking, so everyone should take note!
Overall, CKB is still in a strong upward trend, but due to RSI entering the overbought zone, the MACD momentum appearing somewhat weak, and the signal of selling pressure at high levels, it is recommended to pay attention to the integer point of 0.0175 as a potential support level! If the price falls below this level, it may further pull back to 0.0165 (previous low point).
Stop-loss for long positions: It is recommended to set below 0.0164
Stop-loss for short positions: Consider setting above 0.0185

As long as you remain vigilant, UC's investment boat can sail through the wind and waves and move forward all the way!
免责声明:本文章仅代表作者个人观点,不代表本平台的立场和观点。本文章仅供信息分享,不构成对任何人的任何投资建议。用户与作者之间的任何争议,与本平台无关。如网页中刊载的文章或图片涉及侵权,请提供相关的权利证明和身份证明发送邮件到support@aicoin.com,本平台相关工作人员将会进行核查。


