Comprehensive analysis of the changes in Ethereum's transaction fees, Blob fees, and Layer2 demand changes, as well as changes in Ethereum's staking and lock-up amounts.
Author: Carol, PANews
For a long time, Ethereum's transition to the PoS mechanism has been considered to help achieve currency deflation and meet the needs of larger-scale applications, which is beneficial for the upward trend of ETH price. However, on the occasion of the second anniversary of the transition, Ethereum is facing many doubts. On the surface, these doubts have arisen mainly because ETH has performed poorly in the recent market cycle, especially compared to BTC and SOL during the same period, with a lower-than-expected price increase.
However, at a deeper level, these doubts reflect two main challenges in Ethereum's development: one is the competition between Layer1 and Layer2, where the core issue is how to position the role of Layer2 and its relationship with Ethereum, and the other is the contradiction between staking and liquidity, where the core issue is how to position the attributes of ETH.
In order to further demonstrate the current development status of Ethereum and the challenges behind the doubts, PANews' data column PAData has comprehensively analyzed the changes in Ethereum's transaction fees, Blob fees, and Layer2 demand changes, as well as changes in Ethereum's staking and lock-up amounts, and found that: First, Ethereum has reduced the transaction fee prices, but Layer2 has diverted the on-chain activity demand and interacted with Ethereum at a lower price, leading to challenges in the value feedback and accumulation of ETH. Second, if ETH is positioned as a settlement currency, expecting long-term sustainable high demand for Ethereum to achieve long-term stable appreciation of ETH, but in the face of fierce competition, the market's willingness to pay for this long-term expectation may be shaken.
The main findings of this article include:
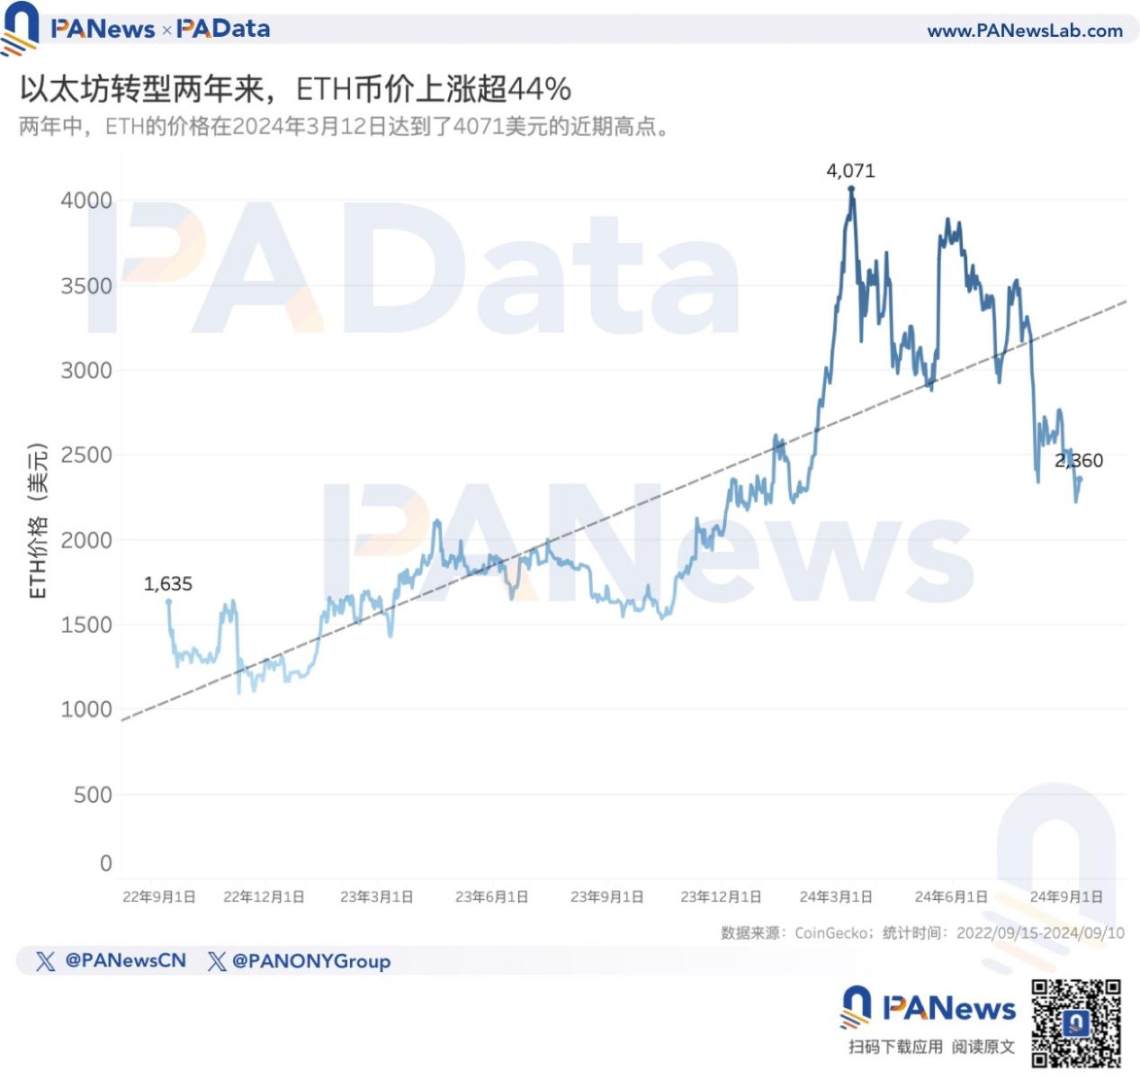
- In the past 2 years, the increase in ETH to USD is about 44.28%, but the decrease in ETH to BTC is about 48.70%, and the decrease in ETH to SOL is about 63.55%.
- In the past 2 years, Ethereum's monthly transaction fee income (considering only Tip fees) has shown a clear overall increasing trend, with an average monthly fee income of about 32.8156 million USD. However, starting from August this year, the monthly fee income started to decline.
- After the introduction of Blob, the daily average TPS of Arbitrum One, Base, and OP Mainnet increased by 122.00%, 694.69%, and 54.94% respectively. Arbitrum One and Base have TPS that are 60.24% and 158.85% higher than Ethereum's daily average TPS.
- The top 20 contributors in Blob payment costs have submitted a total of 263.93 Blobs, paying a total of 5.9914 million USD, with an average cost of about 2.27 USD per Blob. Among them, Base, which has the fastest TPS growth, has only paid a total of 0.1093 million USD.
- Ethereum's total staking amount has increased by about 150.18% in 2 years, but the marginal growth of the staking amount is slow. The daily average growth rate in the first 9 months of this year is 0.06%, which is more than 0.1 percentage point lower than the daily average growth rate of 0.17% for the whole of last year.
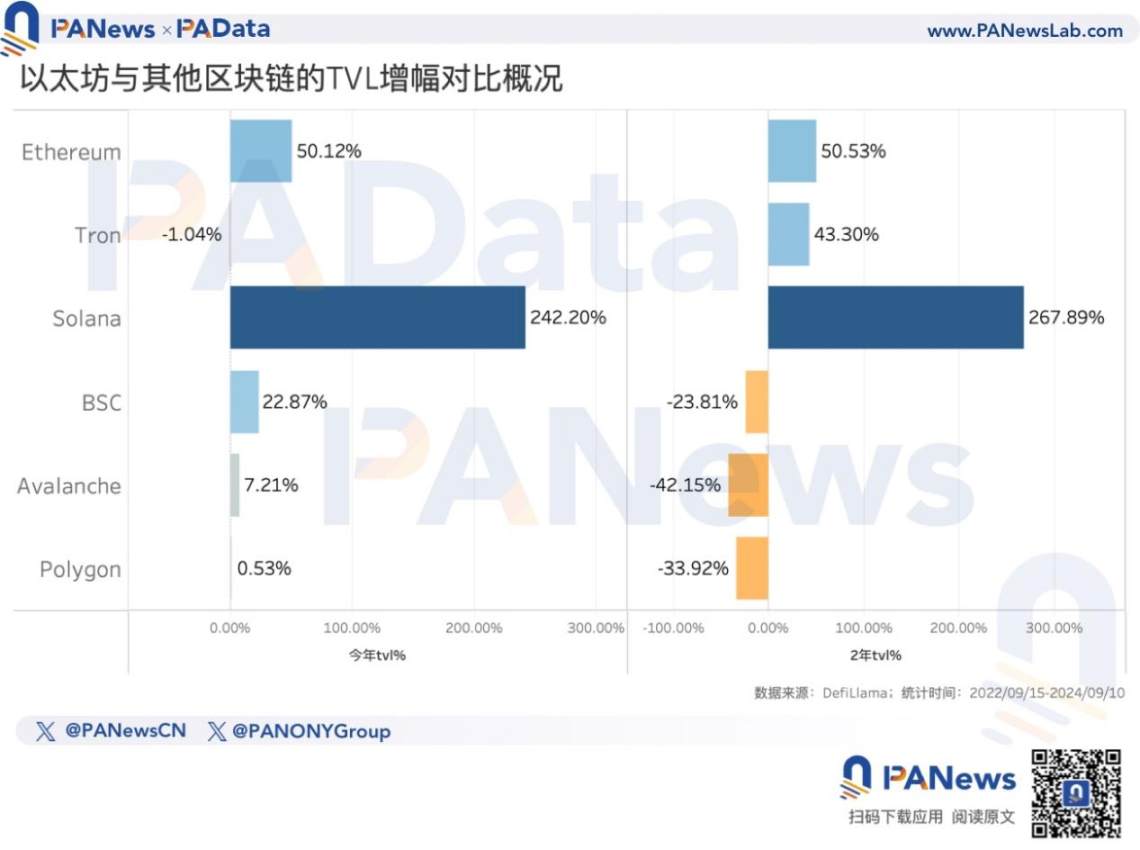
- The amount of DeFi lock-ups on Ethereum has increased by 50.12% this year, but Solana has increased by 242.20% this year. Based on the monthly average growth rate this year, it is estimated that in another 12 months, Solana's lock-up amount will surpass Ethereum's.
01. ETH and BTC and SOL exchange rates fall together, Ethereum's transaction fee income shifts from increase to decrease
The direct reason for the doubts about Ethereum is the poor performance of ETH, but in terms of its own trend, ETH has maintained a significant upward trend after the transition. According to CoinGecko's data, in the past 2 years, the increase in ETH is about 44.28%, reaching a high of 4071 USD at one point, and the current price of over 2300 USD is still at a high level in nearly two years.
However, when compared with BTC and SOL during the same period, the performance of ETH is not satisfactory. Looking at the trend of these two ratios, in the two years since Ethereum's official transition, BTC's performance has always been better than ETH, and SOL's performance has experienced a process of initially worse and then better compared to ETH.
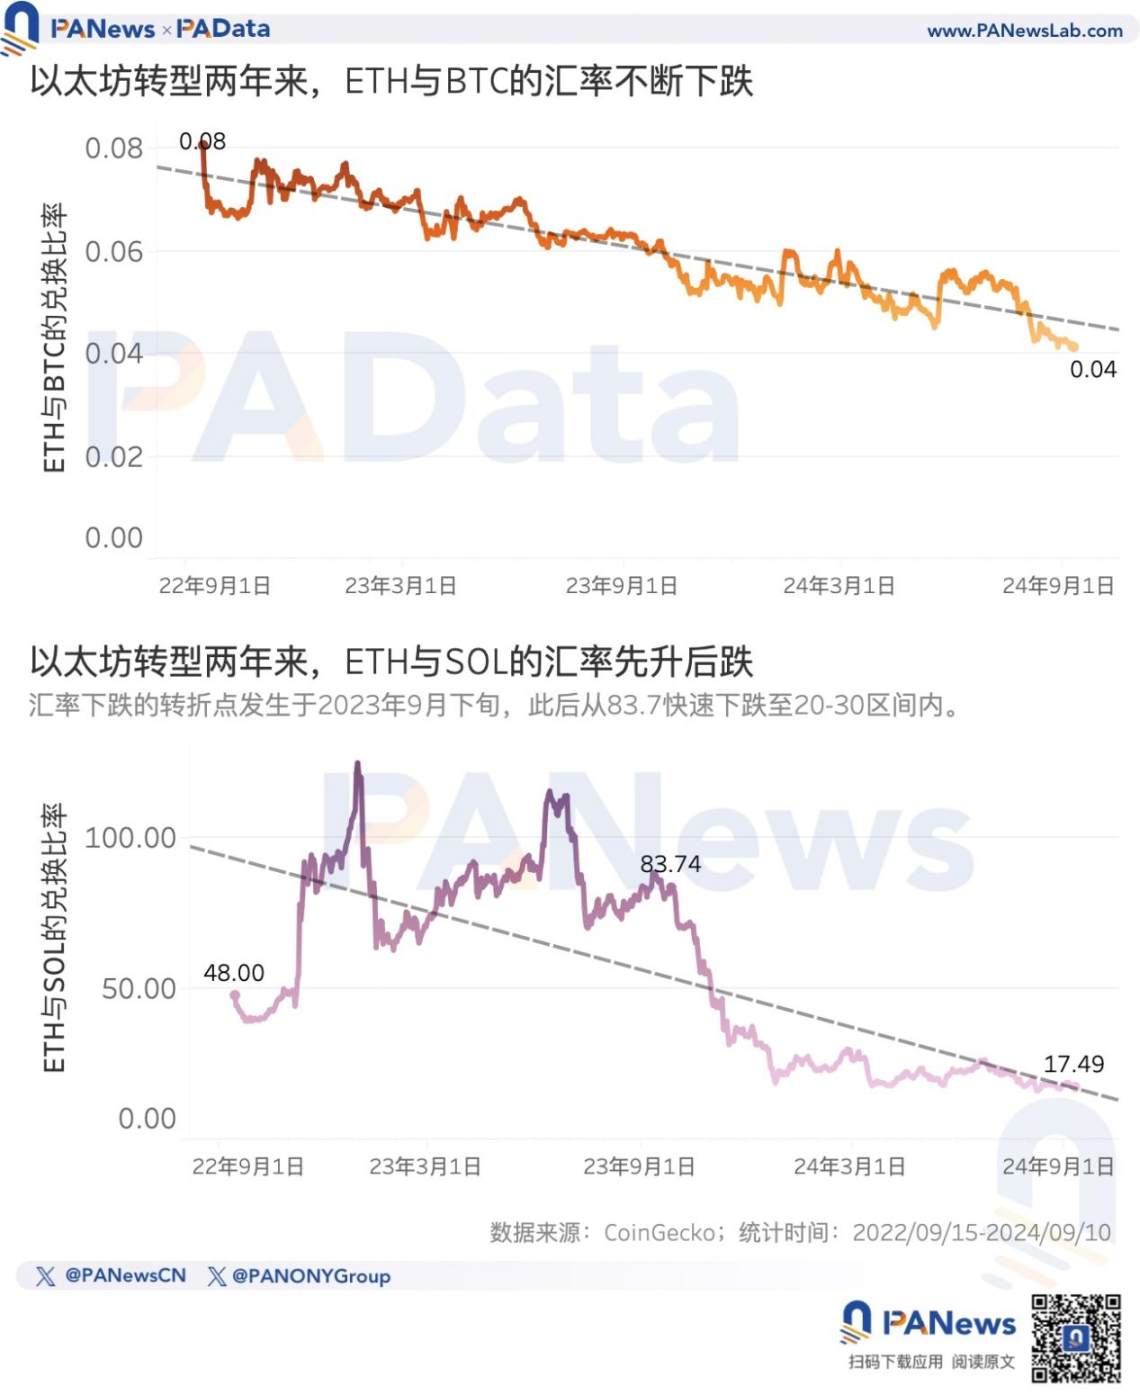
According to statistics, in the past two years, compared with BTC, the amount of BTC that 1ETH can exchange for has dropped from 0.0807 to 0.0414, a decrease of about 48.70%, and overall, the downward trend of the ETH/BTC exchange rate is obvious.
Compared with SOL, before September 2023, 1ETH could basically exchange for more than 50 SOL, and the overall trend was increasing, reaching a high of 125.1895 SOL. However, after September 2023, the exchange rate quickly declined, dragging down the overall exchange rate in the past 2 years. Currently, 1ETH can only exchange for 17.4939 SOL, with an overall decrease of about 63.55%.
Some doubts believe that the direct reason for the poor performance of ETH is the decrease in transaction fee income, although this is one of the main purposes of a series of upgrades after the transition, it has hindered the accumulation of value for ETH. However, according to the trend of data statistics from CryptoQuant, in the past two years, Ethereum's monthly transaction fee income (considering only Tip fees) has shown a clear overall increasing trend.
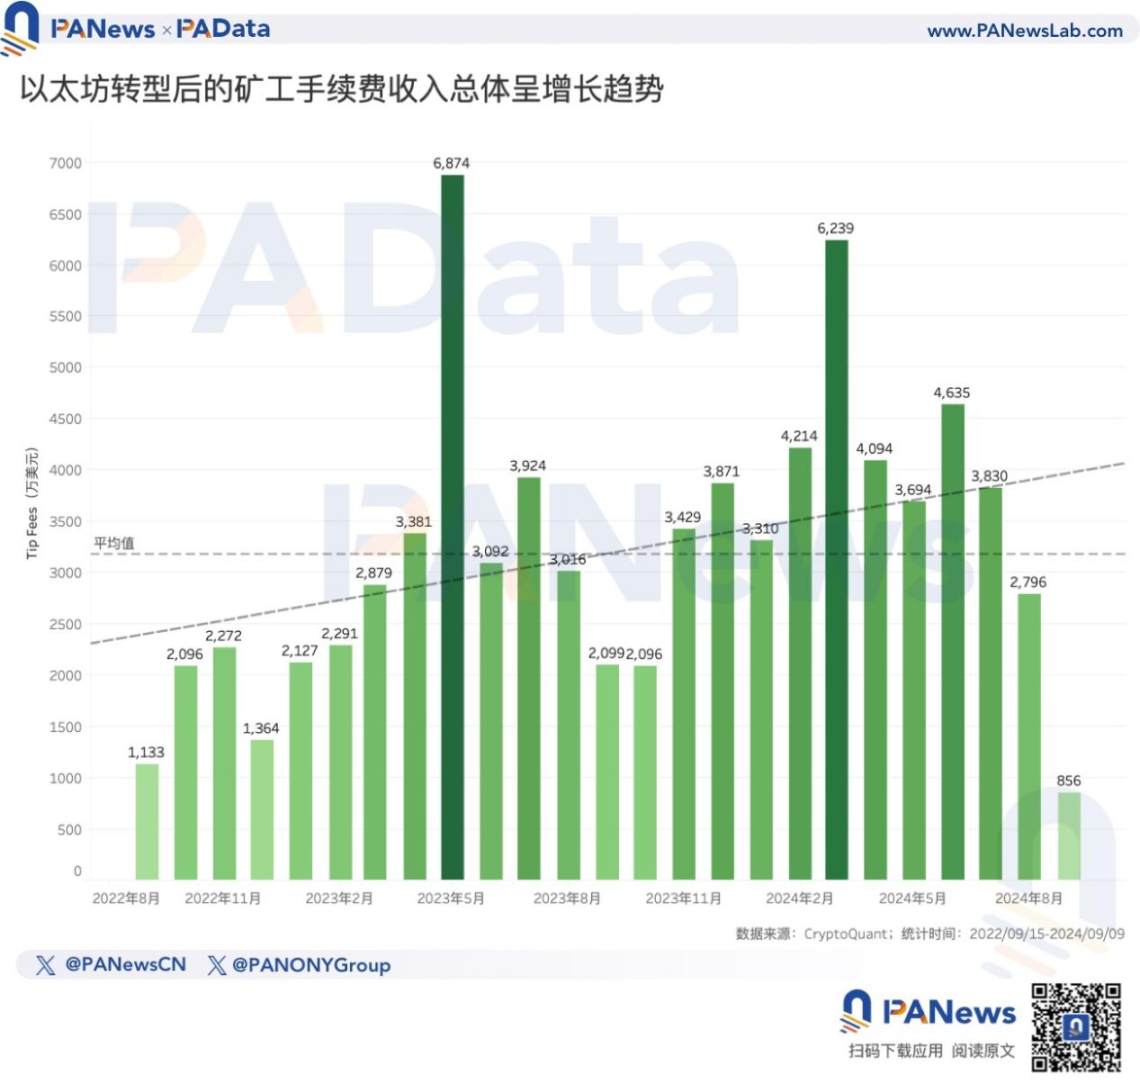
As of September this year, the average monthly fee income of Ethereum over the past 25 months is 3184.45 million USD. If September is not considered, then the average monthly fee income of Ethereum over the past 24 months would increase to 3281.56 million USD. From November 2023 to July 2024, the monthly fee income was higher than 3300 million USD, significantly higher than most of the previous time, and even exceeded 6000 million USD at one point.
However, in August this year, Ethereum's monthly fee income decreased to 2796 million USD. If estimated based on the average fee income for the first 10 days of September, the monthly fee income for September may further decrease to 2568.47 million USD. This indirectly confirms the market's concerns about the future value accumulation of ETH.
02. After the introduction of Blob, the TPS of the top 3 Layer2s has increased significantly, and the top 20 Blob contributors have only paid a total of 5.99 million USD
The continuous decrease in Ethereum's transaction fees should have been an expected occurrence, but why have recent doubts revolved around this? The possible reason is that the balance between on-chain activity demand and transaction fee prices has not been established.
The ideal expectation is that Ethereum, through Layer2 and other upgrades, has reduced transaction fee prices, which will directly boost or be conducive to long-term boosting of on-chain activity demand, so that the two can achieve a balance, and ETH can still accumulate value from it. However, the current problem is that the total demand for on-chain activity is insufficient, coupled with Layer2 taking on more direct on-chain activity and interacting with Ethereum at a lower price. In this situation, the continuous decrease in transaction fees has led to challenges in the value feedback and accumulation of ETH. In simpler terms, Ethereum's fee optimization plan designed for high demand periods is facing untimely difficulties in low demand periods.
From the data provided by Dune (@hildobby), it can be seen that after the introduction of Blob transactions, the TPS of the top three Layer2 networks with the highest lock-up amounts has significantly increased, and two of them have surpassed Ethereum in terms of TPS. Ethereum's series of optimizations in transaction fees have objectively promoted the development of Layer2, especially the development of Base.
From the beginning of this year to March 14th, the daily average TPS of Arbitrum One, Base, and OP Mainnet were 9.68, 4.33, and 4.15 respectively. However, from March 14th to the present, the daily average TPS of these three has increased to 21.49, 34.41, and 6.43, representing increases of 122.00%, 694.69%, and 54.94% respectively.
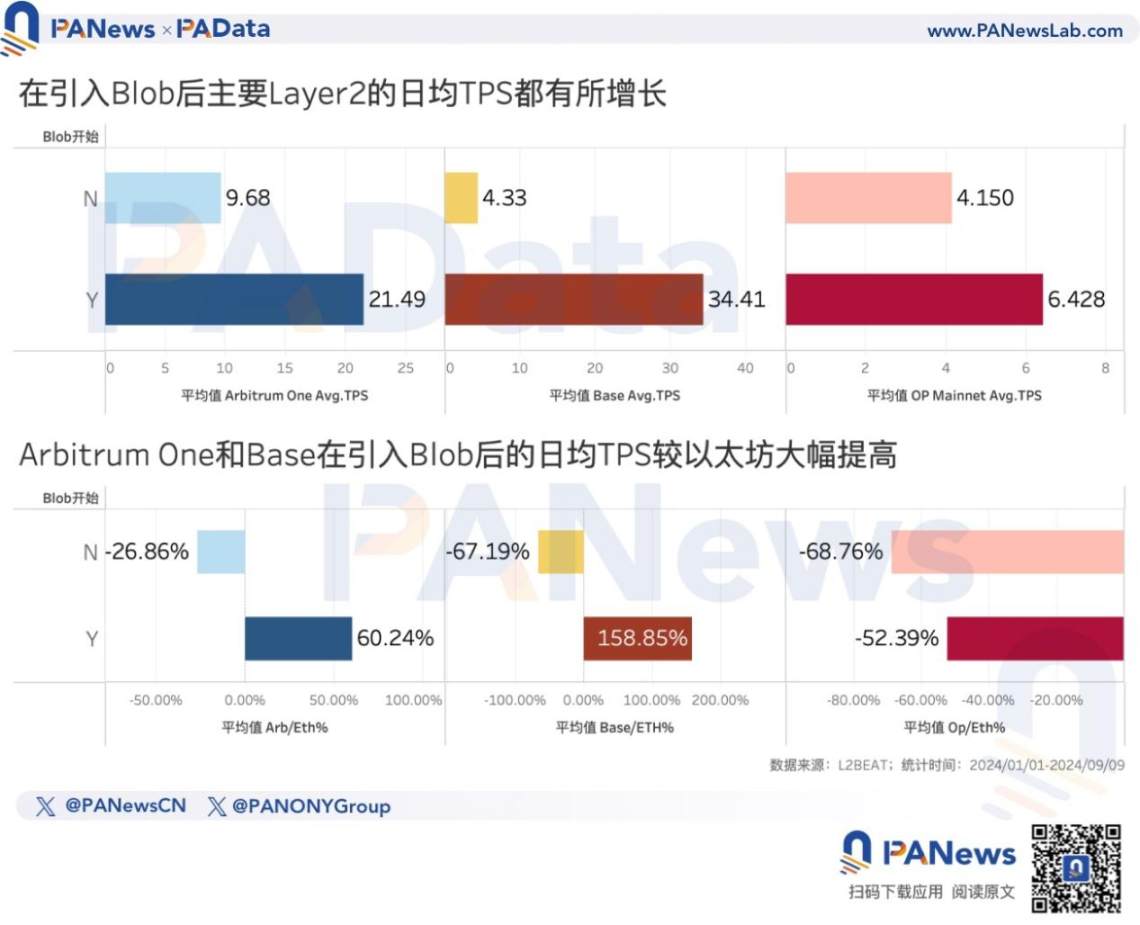
Moreover, from the beginning of this year to March 14th, the daily average TPS of Arbitrum One, Base, and OP Mainnet were all lower than Ethereum's daily average TPS during the same period, averaging 26.86%, 67.19%, and 68.76% lower, respectively. However, after the introduction of Blob, the daily average TPS of Arbitrum One and Base has exceeded Ethereum by 60.24% and 158.85%, respectively. Although OP Mainnet's daily average TPS is still lower than Ethereum's, the gap between the two is narrowing.
The growth in demand for Layer2 has benefited from the introduction of Blob transaction type, but the fees paid by Layer2 for Blob are very low. In other words, the improvement in Ethereum's transaction fees currently cannot be reflected in the accumulation of value for ETH.
According to Dune (@hildobby)'s statistics, as of now, the top 20 contributors in Blob payment costs have collectively paid over 5.9914 million USD, accounting for over 99% of the total fees. Among them, Base, which has the fastest TPS growth, has only paid a total of 0.1093 million USD, Arbitrum has paid 0.6435 million USD, and OP Mainnet has paid 0.494 million USD. Even Taiko, who has paid the highest amount, has only paid 2.4079 million USD.
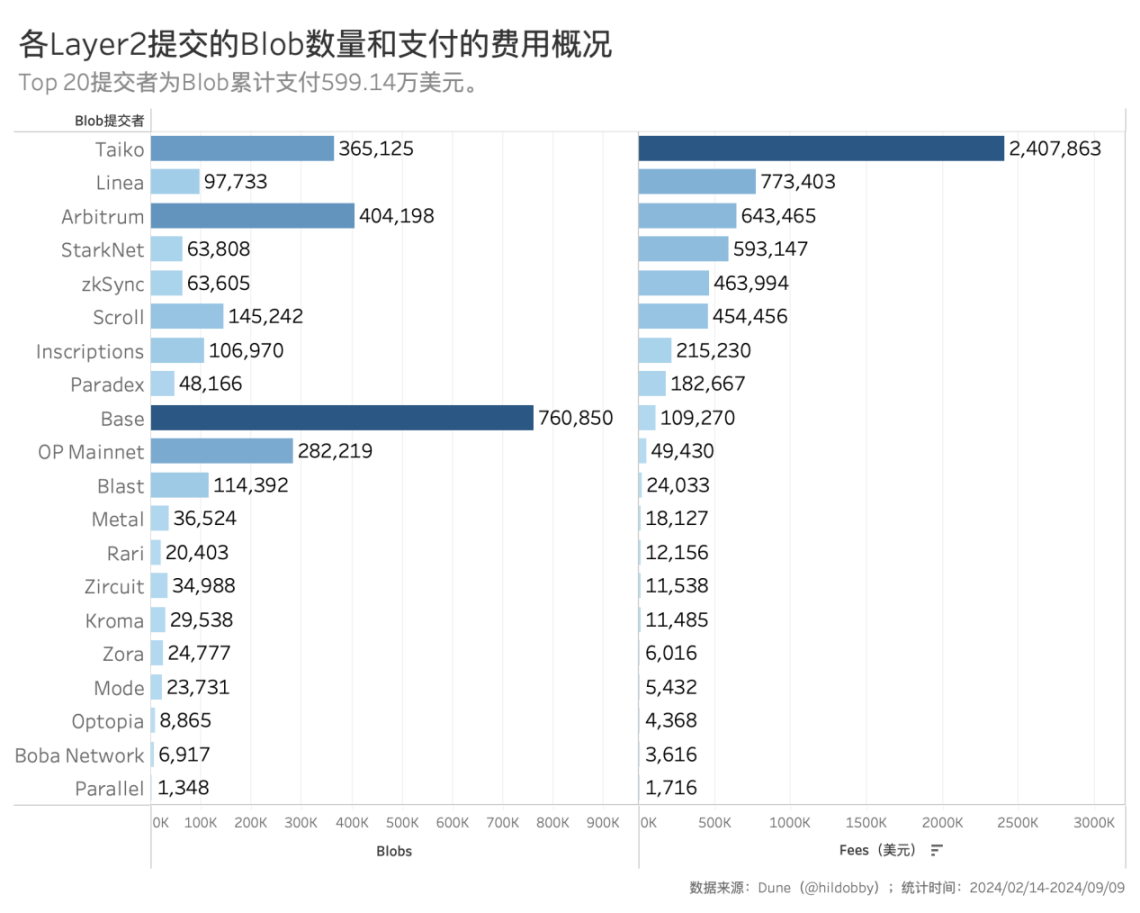
These contributors have submitted a total of 263.93 Blobs, with an average cost of about 2.27 USD per Blob. However, this fee data is based on the current situation of insufficient total on-chain demand. If there is a significant increase in on-chain activity demand on Ethereum in the future, leading to network congestion, the price of Blob will also rise, and Layer2 will naturally have to pay more fees to Ethereum. At that time, whether Blob can compensate for the portion of transaction fee income that Ethereum has relinquished remains to be further observed.
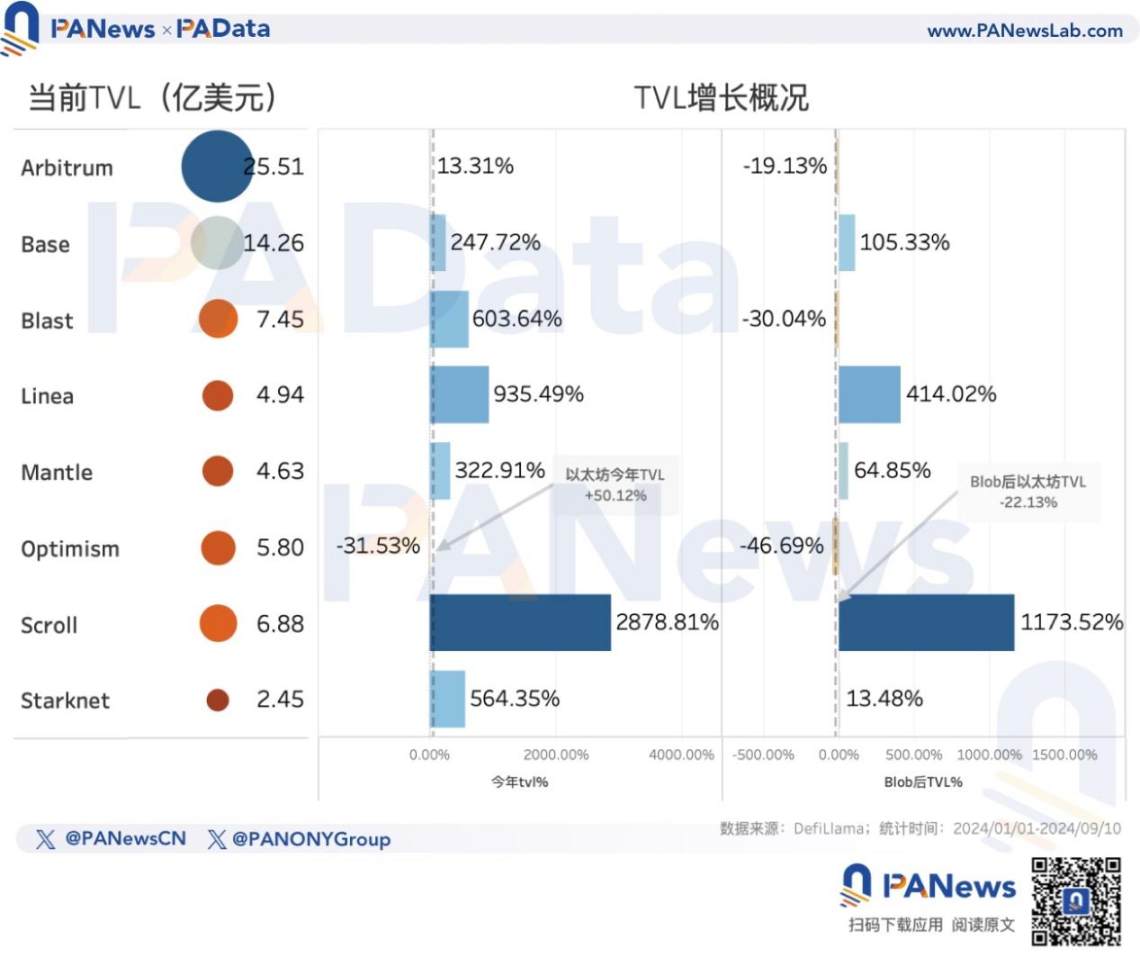
The growth in demand for Layer2 is partly reflected in the changes in lock-up amounts. According to DefiLlama's statistics, after the introduction of Blob, Ethereum's lock-up amount has decreased by 22.13%, with only Blast and Optimism experiencing larger decreases. Base, which has the fastest TPS growth, has seen a 105.33% increase in lock-up amount, while Linea, which ranks second in paying Blob fees, has seen a 414.02% increase. Additionally, although Arbitrum's lock-up amount has also decreased by 19.13%, the decrease is smaller than Ethereum's.
03. Ethereum's staking growth rate declines, TVL increases but lags behind Solana
Another challenge for Ethereum after the transition is how to achieve a balance between staking amounts and lock-up amounts to ensure that on-chain activity on Ethereum remains at a certain level of security. The mutual changes in ETH price and staking interest rates will be key to achieving this balance. Essentially, this will determine whether ETH has sufficient liquidity and demand, which is an important requirement for ETH to become a settlement currency. Another requirement is for ETH to maintain its value over time, which means that sharp fluctuations or large short-term increases in ETH value are not expected.
If ETH is positioned as a settlement currency, it is expected that Ethereum will have long-term sustainable high demand to achieve long-term stable appreciation of ETH. The question is whether the market is willing to support this long-term expectation. When this long-term expectation is lacking, the appearance of doubts is natural.
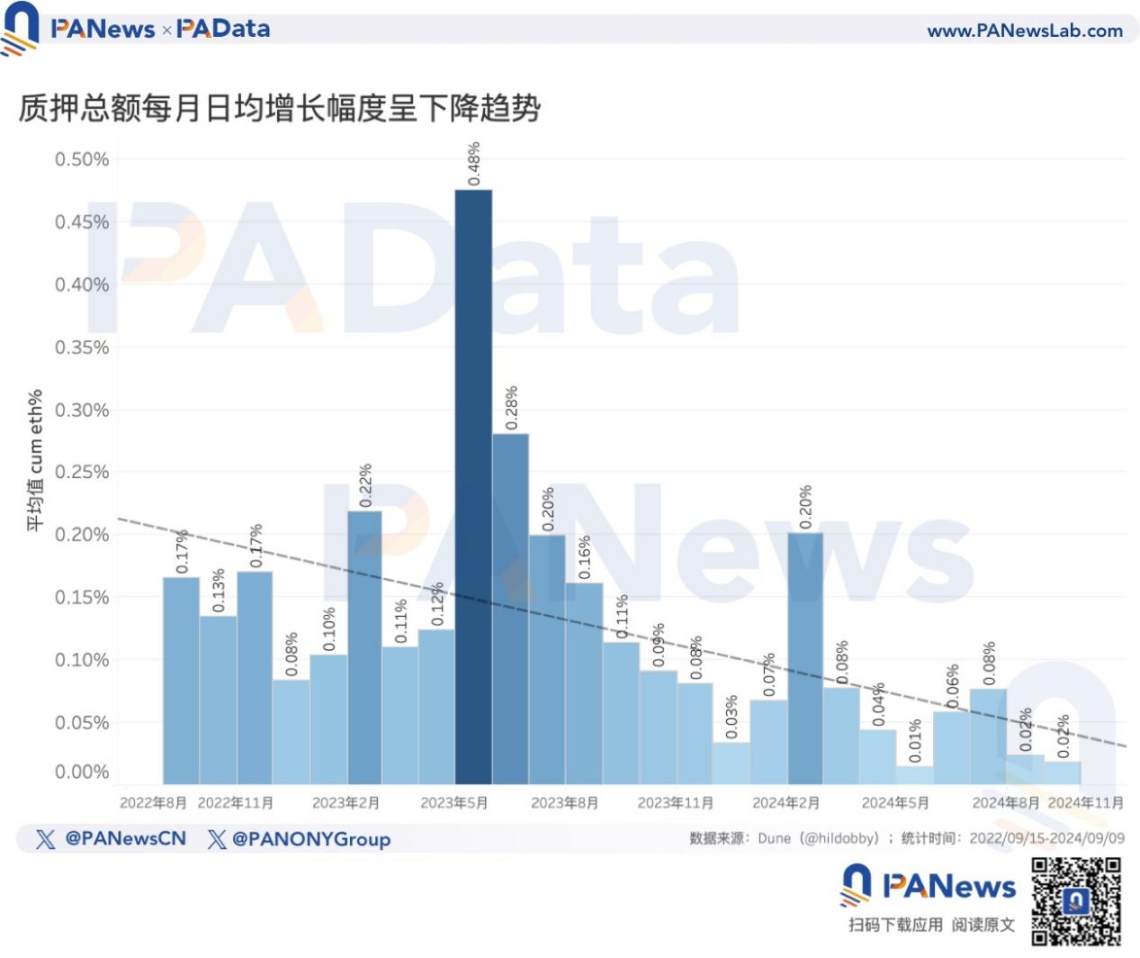
From the demand side reflected in the data, currently, Ethereum's total staking amount is 34.3842 million ETH, an increase of about 150.18% compared to 2 years ago, showing a significant increase. However, in terms of the growth rate of staking amounts, the daily average growth rate is showing a declining trend, with the daily average growth rate in September already decreasing to 0.02%. The daily average growth rate in the first 9 months of this year is 0.06%, which is more than 0.1 percentage point lower than the daily average growth rate of 0.17% for the whole of last year.
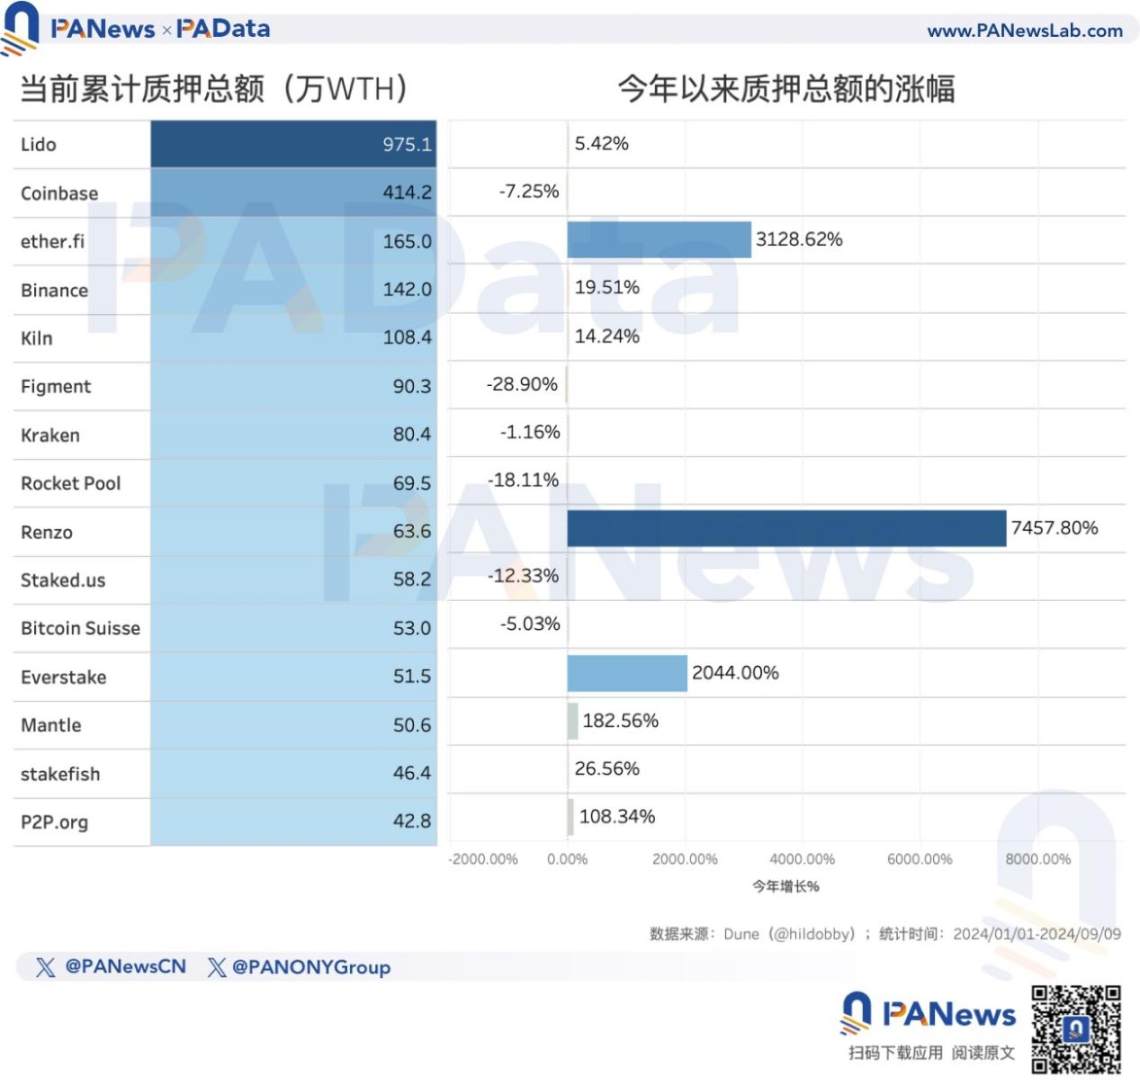
Currently, the top 3 entities with the highest cumulative staking amounts are Lido, Coinbase, and ether.fi, with only Lido's staking amount exceeding 9.75 million ETH. Since the beginning of this year, the main entities that have achieved high-speed growth in staking amounts are Renzo, ether.fi, and Everstake, with growth rates exceeding 7457%, 3128%, and 2044%, respectively.
While the total staking amount is slowly increasing, the lock-up amount in DeFi on Ethereum reached a short-term high of 67.901 billion USD in June this year, and is currently at 44.468 billion USD, representing a 50.12% increase since the beginning of this year and a 50.53% increase in the past 2 years. This means that there has been some recovery in the demand for applications on Ethereum this year.
However, compared to Solana, the demand growth for Ethereum seems to be lacking momentum. Solana's current lock-up amount is about 4.781 billion USD, roughly 1/10 of Ethereum's total. However, this year, Solana's lock-up amount has increased by 242.20%, and by 267.89% in the past 2 years, showing rapid development.
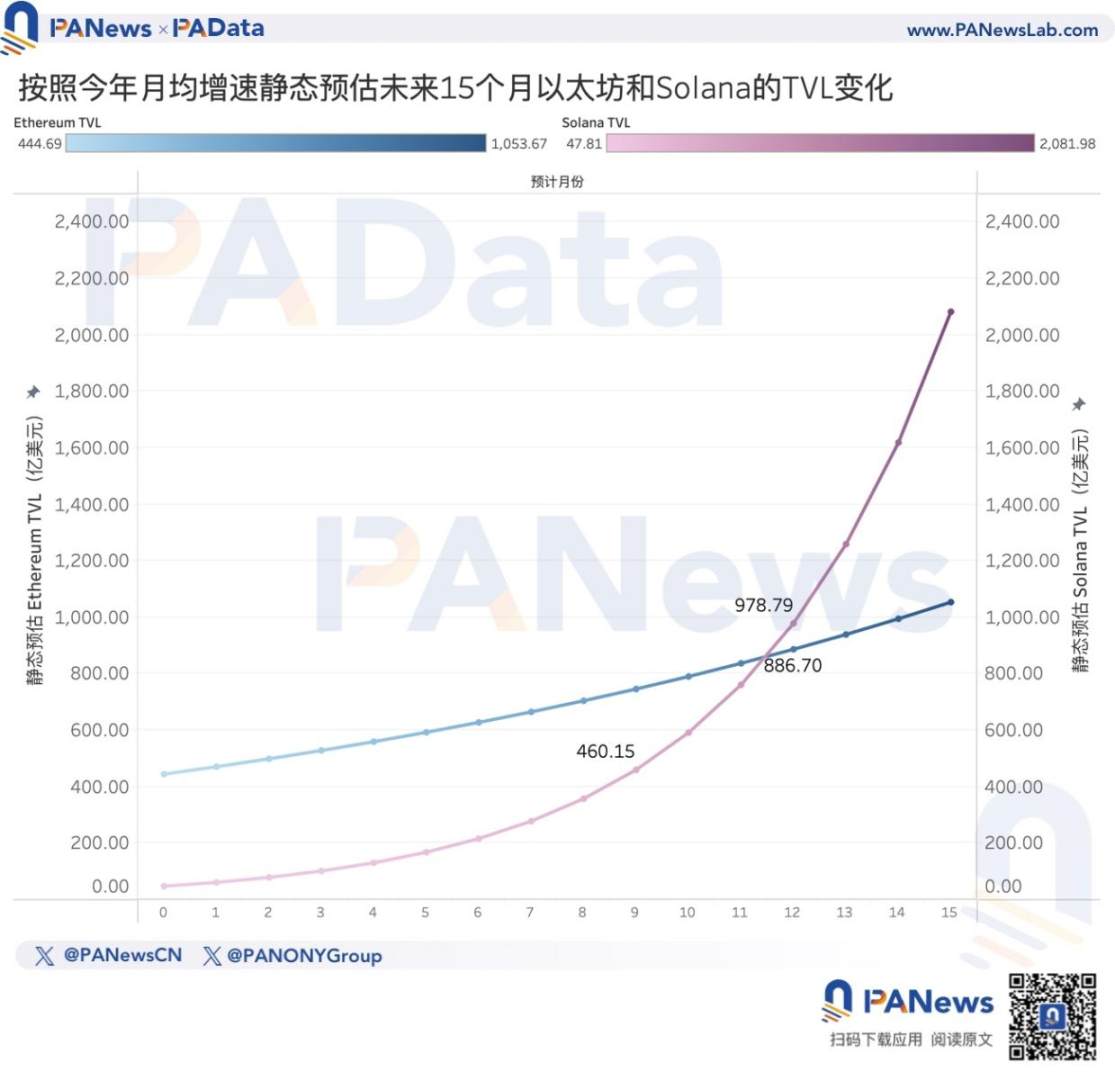
In a simple static analysis, if Solana continues to maintain its current monthly average growth rate (this year's growth rate / 254 days * 30 days), it is expected that in another 9 months, its lock-up amount will exceed 46 billion USD. If Ethereum also maintains its current monthly average growth rate, it is expected that in another 12 months, Solana's lock-up amount will surpass Ethereum. Competition may be one of the reasons why the market is starting to doubt whether Ethereum's long-term expectations can be realized.
免责声明:本文章仅代表作者个人观点,不代表本平台的立场和观点。本文章仅供信息分享,不构成对任何人的任何投资建议。用户与作者之间的任何争议,与本平台无关。如网页中刊载的文章或图片涉及侵权,请提供相关的权利证明和身份证明发送邮件到support@aicoin.com,本平台相关工作人员将会进行核查。


