Daily Sharing
In the blink of an eye, it's already mid-September. Since Bitcoin surged to 73777 in mid-March this year, it has been fluctuating downward. The overall volatility has been quite intense, with more than 8 fluctuations, averaging around 17% to 32% each time. Basically, it has outperformed the comrades who trade contracts without setting stop-loss at least three times. Regardless of long or short positions, most people have been unable to make stable profits.
We don't know how long the overall market will continue to fluctuate. Personally, I firmly believe that once the entire process of Bitcoin's oscillation and pullback ends, there will definitely be a surge to break through 74000, and the ultimate target should be around 90,000 or even 100,000+.
However, the most difficult part is the process. There are countless ways for the "whales" to shake you out of the market or wash out your funds before pushing the market up. Therefore, regardless of when, the most important thing is to protect existing funds as a top priority. Protecting the principal is not about tolerating any loss, but ensuring that the majority of the principal is preserved. This way, we will have the capital to deal with future upward trends.
BTC Medium and Long Term
Weekly Chart:
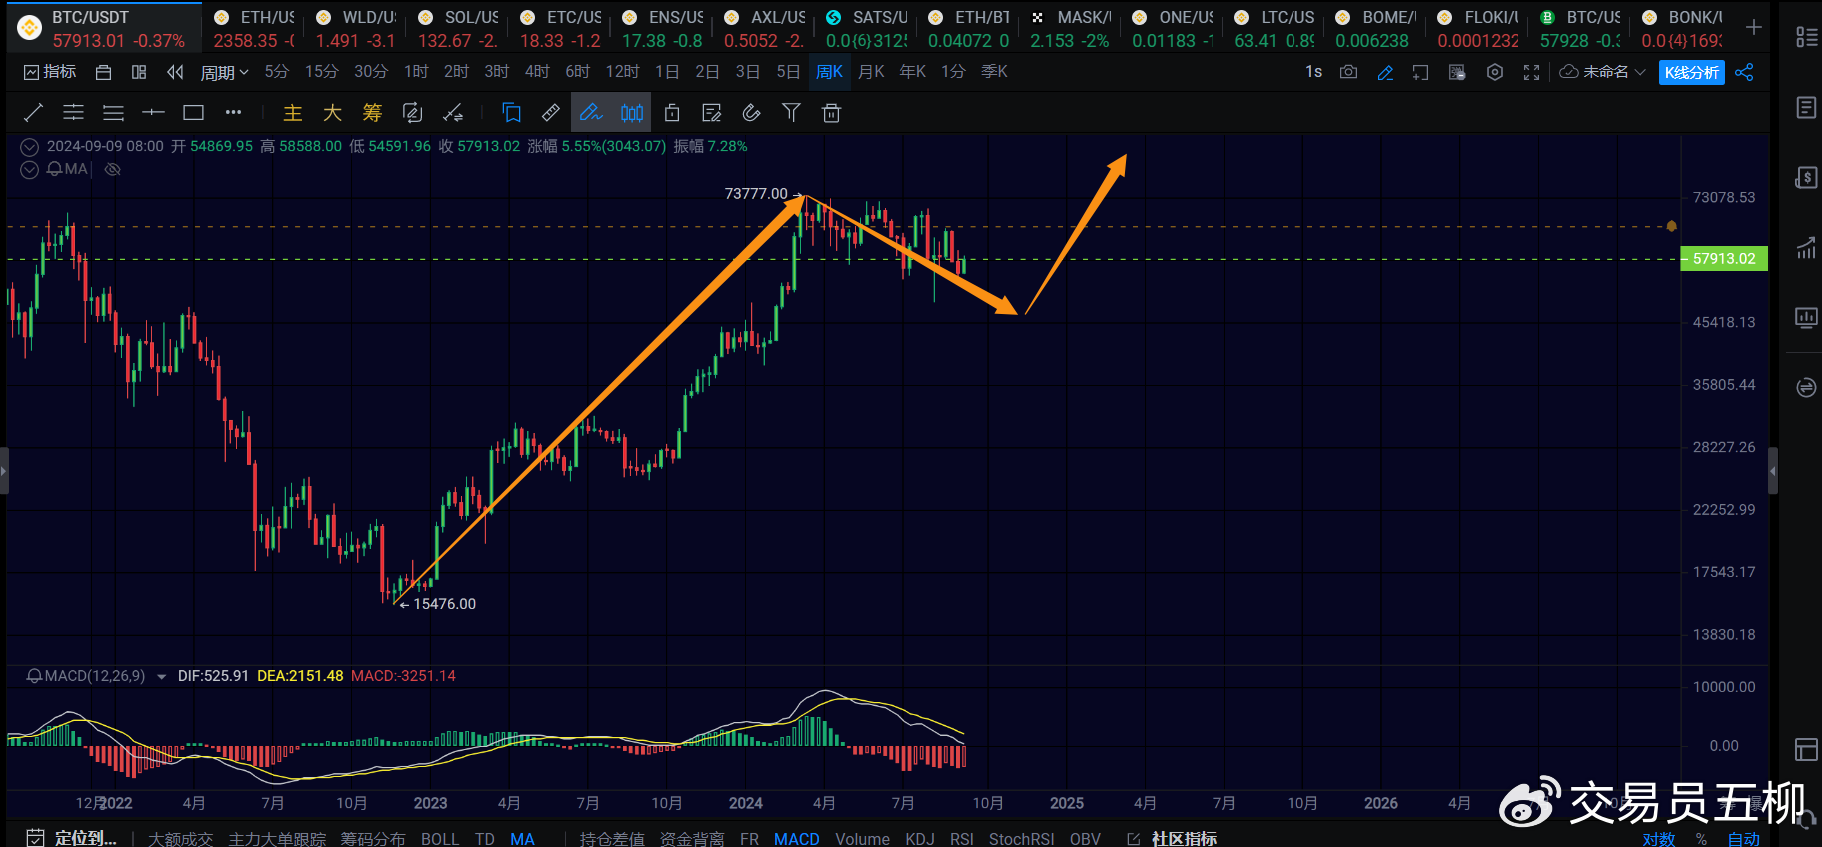
At the weekly level, there is currently not much evidence to indicate that 49000 is the bottom of the weekly level. Therefore, it is possible that the weekly trend has not yet completed, and there is still a high probability of a subsequent retracement to the 44000-48000 range. Unless Bitcoin breaks through 70000 again, the weekly decline is unlikely to end. However, it is worth noting that once this weekly decline is completed, there will be a third wave of weekly uptrend to surpass 74000 and ultimately reach a new high.
Daily Chart:
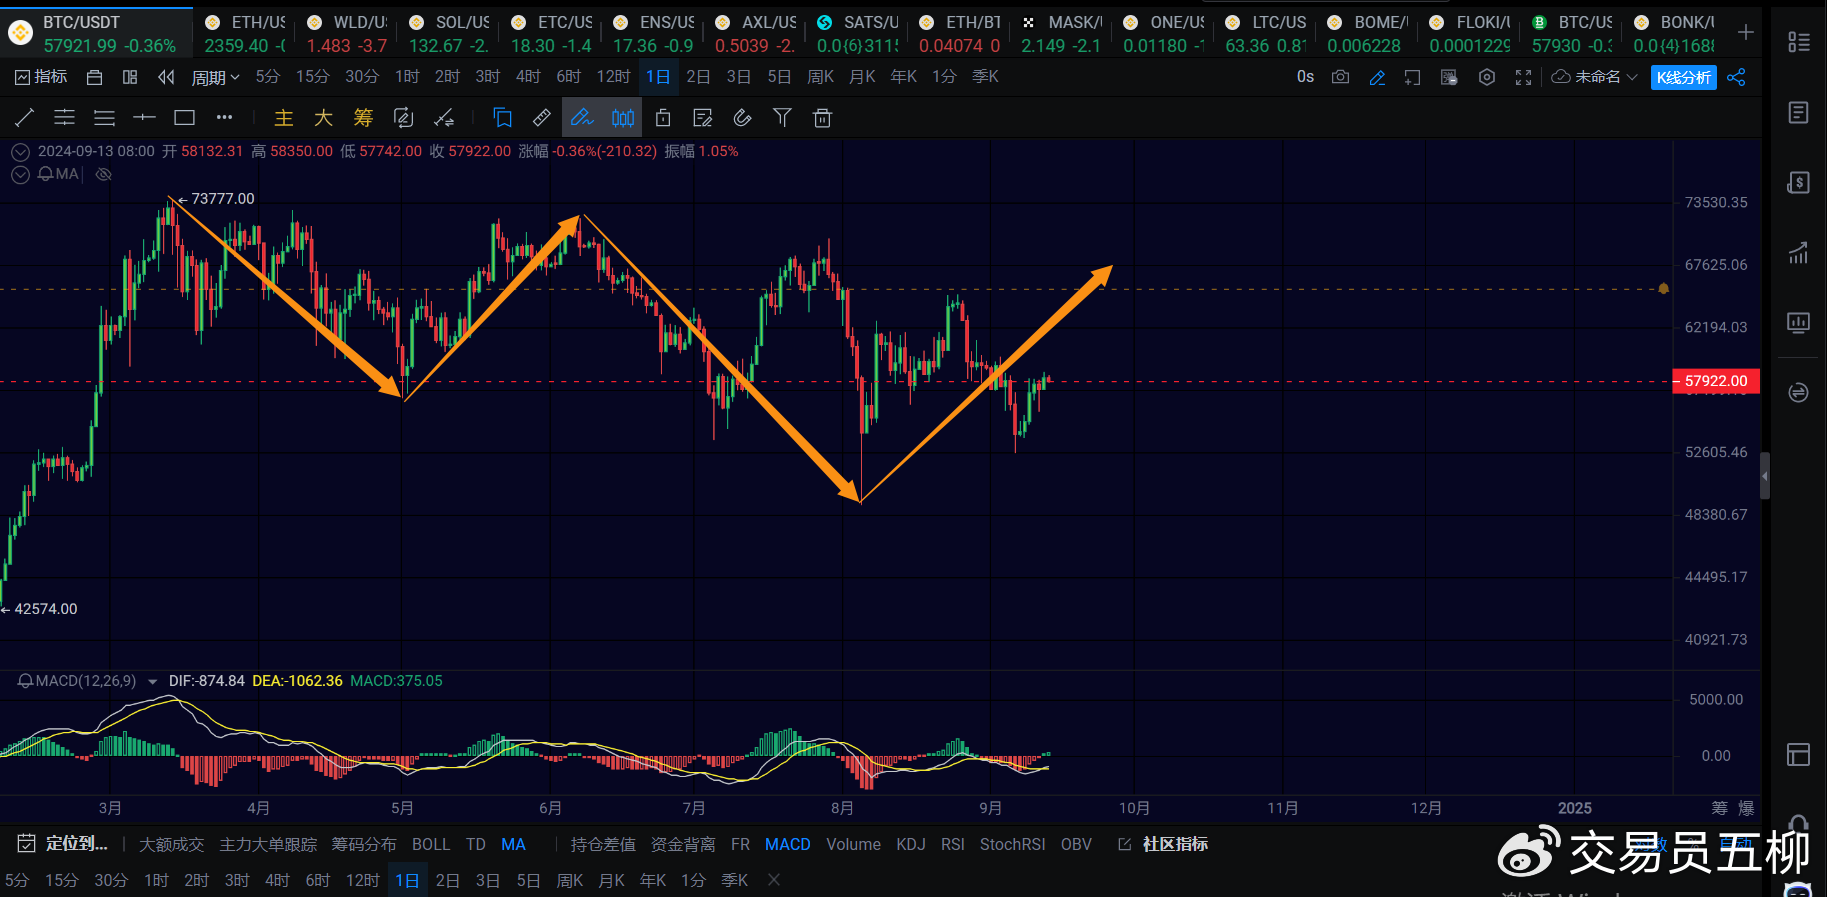
At the daily level, there is a possibility of a rebound to the 65000-70000 range from the current 49000 level. However, based on the current trend, there is not absolute certainty about this. In the short term, I personally tend to believe that Bitcoin will not temporarily fall below 49000. After reaching the 65000-70000 range, there is a probability of another daily decline back below 49000.
The specific direction of the daily trend is still uncertain, so it's not useful to think too much about it. Our operating level should be below the daily level, so as not to be greatly affected. However, it's better to avoid daily level operations until the upward trend arrives, as it's easy to experience repeated roller coaster rides.
4H Chart:
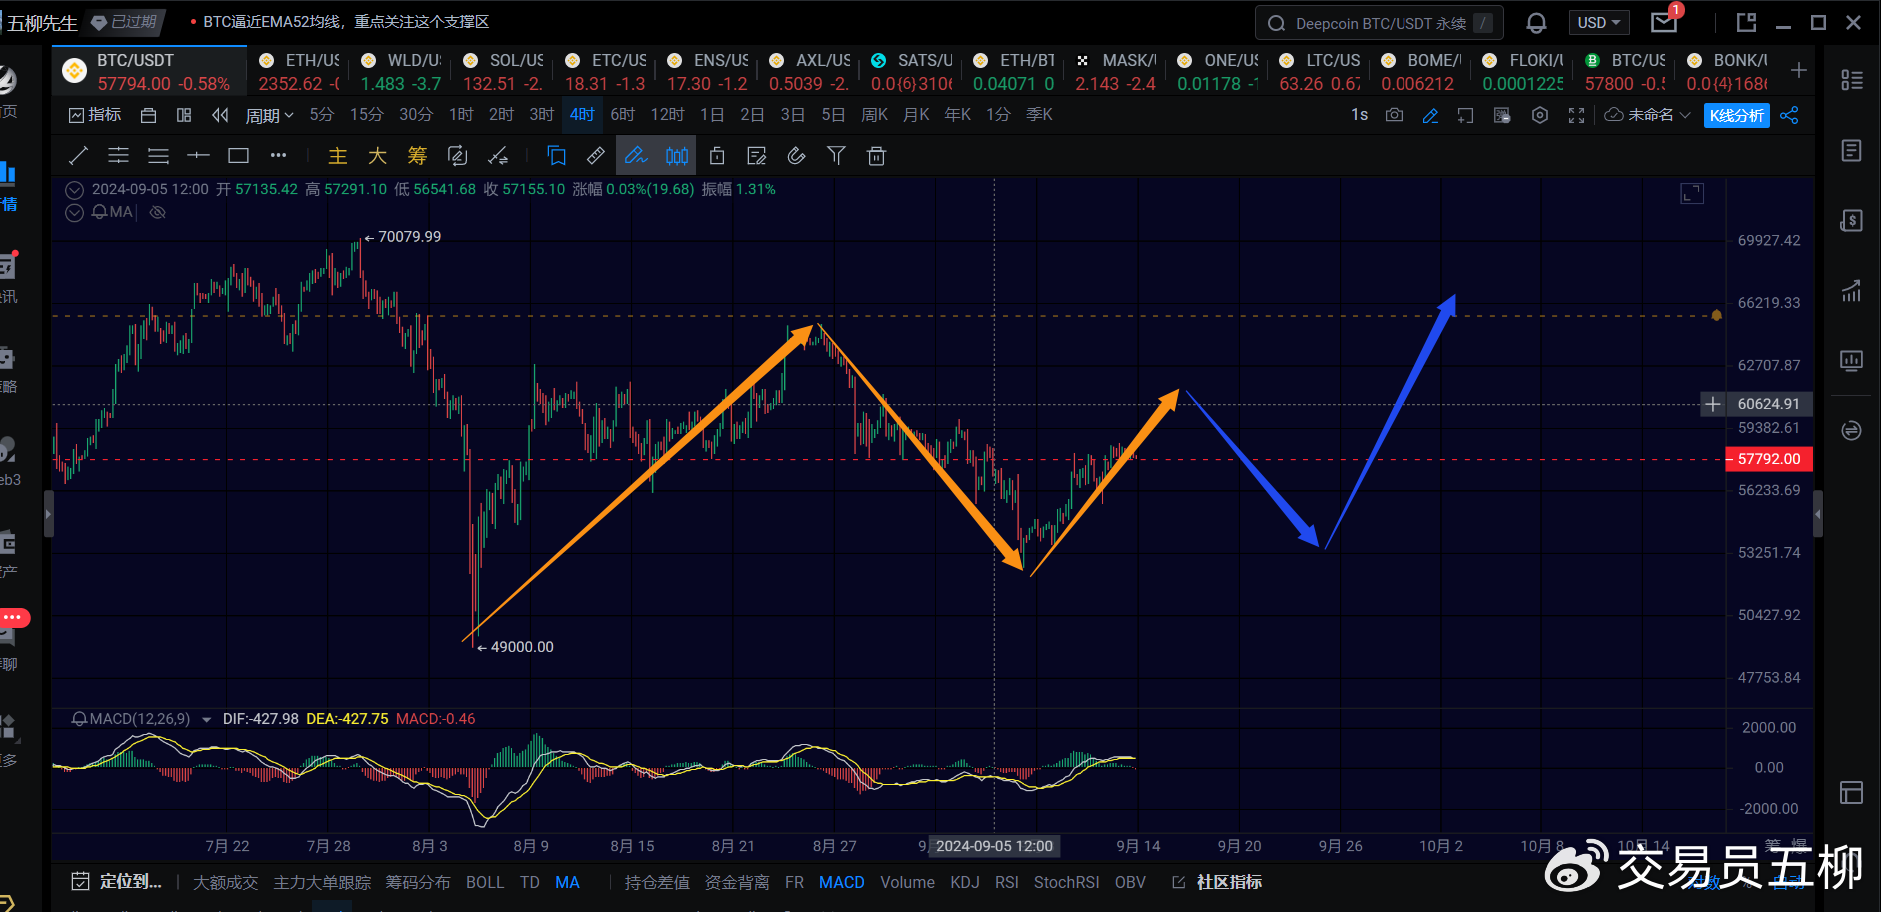
At the 4-hour level, the current trend is the third uptrend indicated by the yellow arrows in the chart. This uptrend is not over yet, and there is an opportunity to reach the 60500-62000 range. After that, there may be another 4-hour decline. It depends on whether the next 4-hour decline will once again fall below 52550. If it does, it will test the support at 49000 (which may or may not be broken). If the next 4-hour decline does not fall below 52550, there is hope for a subsequent rebound to the 65000-70000 range at the 4-hour level.
The two possible 4-hour trends indicated by the blue arrows in the chart are personal hopes or expectations, but we also need to be prepared for the possibility of the next 4-hour decline falling below 52550.
BTC Short Term
Due to the rapid changes in the market, this article can only make predictions based on the market conditions at the time of publication. Short-term players should pay attention to the latest market changes and use this information as a reference only.
1H Chart:
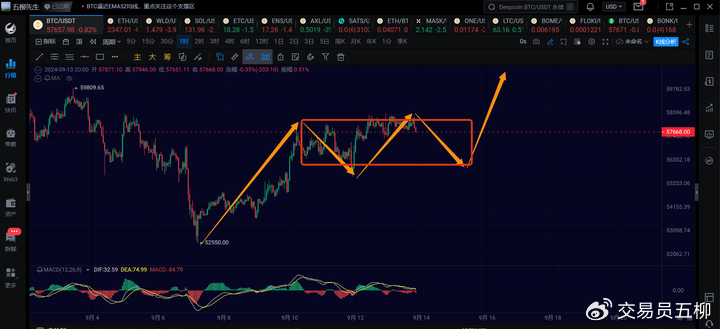
At the 1-hour level, there is a possibility of a 1-hour retracement, currently constrained by the resistance near 58500. It is only possible to reach the 59000-60000 range if it breaks through this level again. Currently, there is a possibility of a 1-hour retracement back to around 56000 to consolidate a 1-hour level center, and then another upward trend to the 60500-62000 range. Therefore, the strategy remains to continue buying on any retracement.
15M Chart:
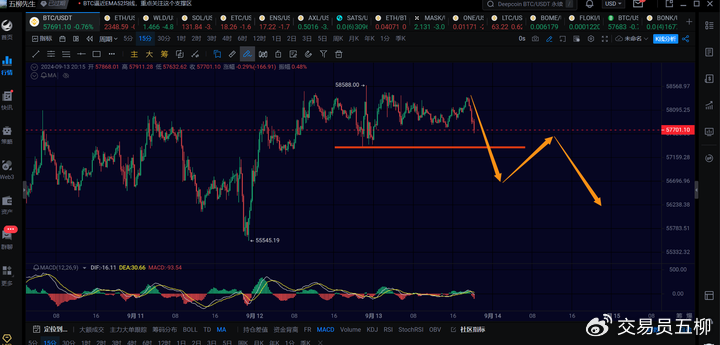
At the 15-minute level, if it falls below 57400 again, it may see a 1-hour retracement back to around 56000. If it does not fall below, it needs to pay attention to the possibility of constructing a 15-minute level center and then rising above 58500 again.
ETH
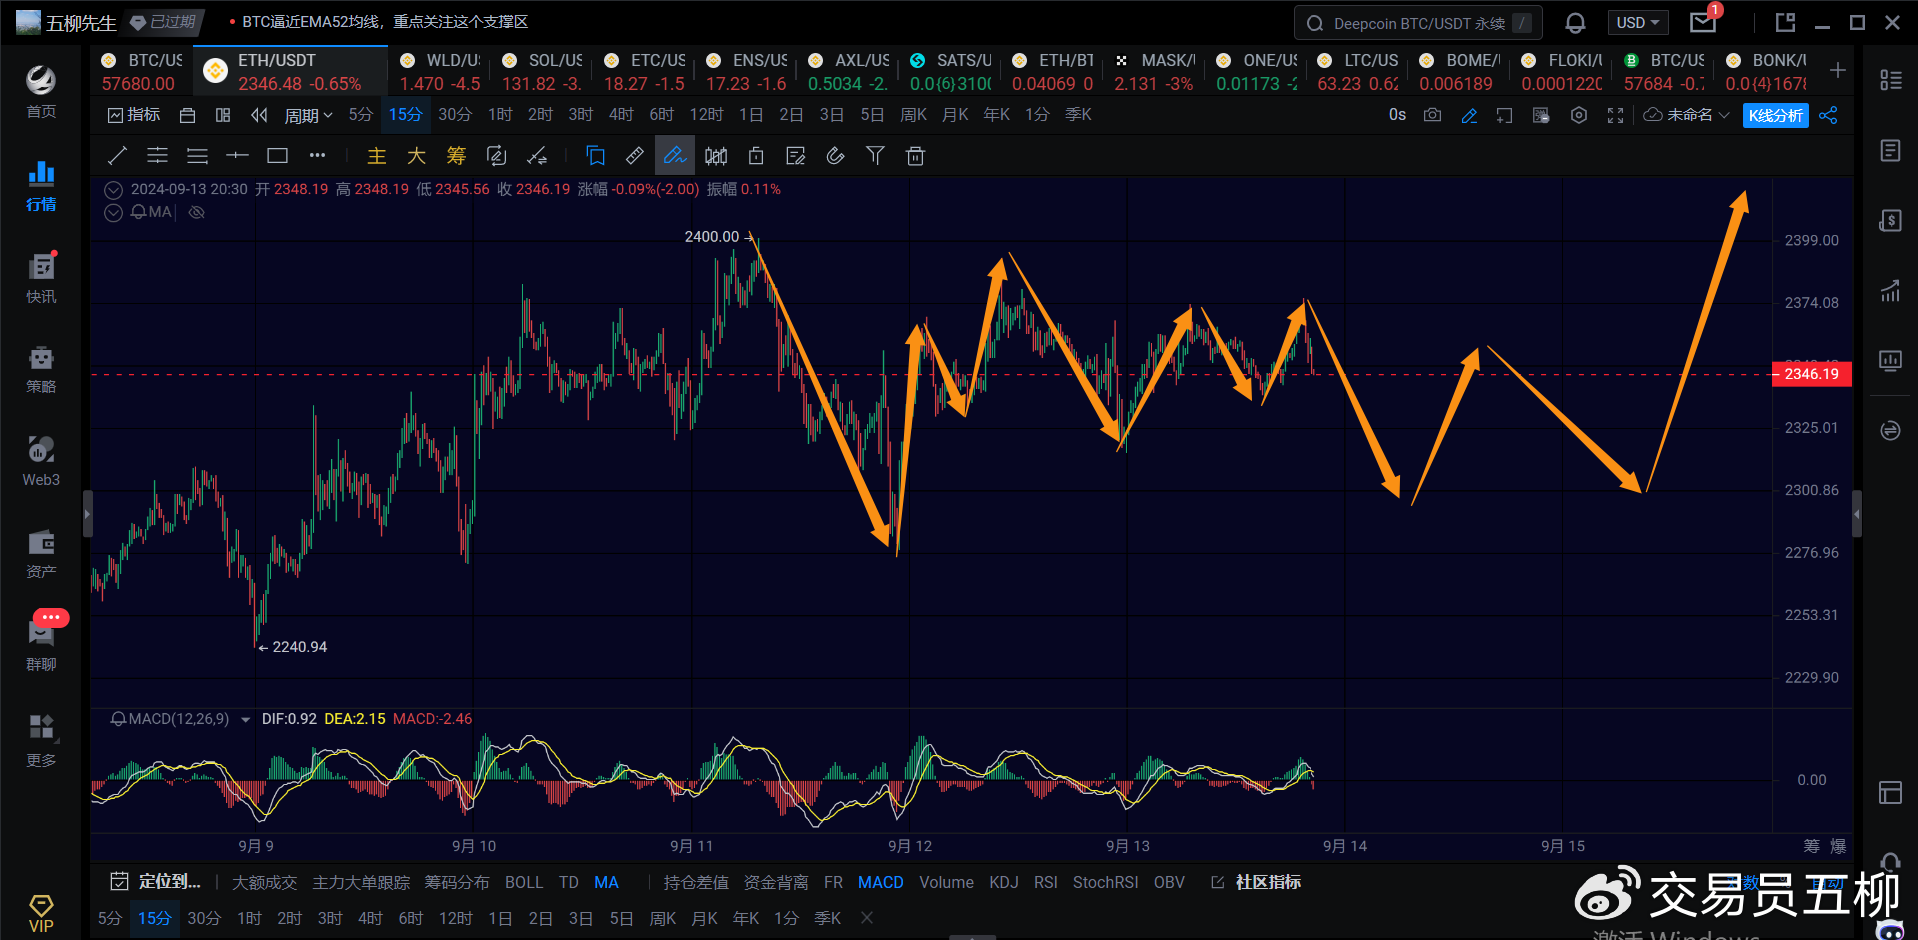
Ethereum may repeatedly oscillate in a 15-minute level structure to upgrade to a 1-hour level center. In the short term, it is important to pay attention to the position near 2300-2280 below and whether it can break through 2400 above. Overall, the rebound at the 4-hour level is likely not over, and the target continues to be around the 2500-2600 range. Therefore, if there is a retracement to the support below, it may be worth trying to buy.
Trend Direction
Weekly Level: Downward, the weekly decline, theoretically around 49000, with a limit of around 45000-48000. Whether it has ended or not still needs to be observed.
Daily Level: Upward, watching whether it will fall below 49000.
4-hour Level: Upward, short-term looking for a 4-hour rebound, focusing on the 60500-62000 range.
1-hour Level: Upward, short-term likely to see a 1-hour retracement and consolidation of a 1-hour center before rising above 60500.
15-minute Level: Downward, watching whether the 15-minute retracement falls below 57400.
Feel free to follow my public account for further discussion and exchange:

This article is time-sensitive. Pay attention to the risks. The views in this article are personal opinions and are for reference only!
免责声明:本文章仅代表作者个人观点,不代表本平台的立场和观点。本文章仅供信息分享,不构成对任何人的任何投资建议。用户与作者之间的任何争议,与本平台无关。如网页中刊载的文章或图片涉及侵权,请提供相关的权利证明和身份证明发送邮件到support@aicoin.com,本平台相关工作人员将会进行核查。


