Last year, the growth in cryptocurrency adoption was mainly driven by middle- and low-income countries. However, this year, cryptocurrency activities in countries across all income levels have increased, while high-income countries have seen a decline since early 2024.
Source: Chainalysis
Translation: Deng Tong, Golden Finance
Global Cryptocurrency Adoption Index Method
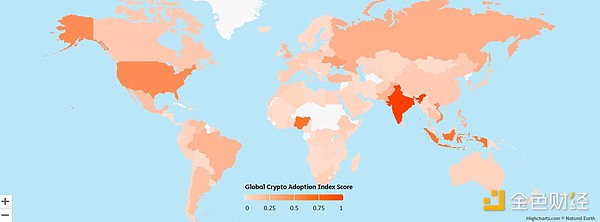
The Global Cryptocurrency Adoption Index consists of four sub-indices, each based on the usage of different types of cryptocurrency services in various countries. We ranked all 151 countries with sufficient data for each sub-index, weighted the rankings based on population size and purchasing power, took the geometric mean of each country's ranking in these four aspects, and then normalized the final number within the range of 0 to 1 to provide a score for each country determining its overall ranking. The closer a country's final score is to 1, the higher its ranking.
To calculate our sub-indices, we estimated the transaction volume of different types of cryptocurrency services and protocols in each country based on the network traffic patterns of these services and protocol websites. We acknowledge that network traffic data is not perfect, as some cryptocurrency users may use VPNs and similar tools to hide their actual physical location. However, given that our index covers billions of cryptocurrency transactions and over 13 billion network visits, considering the size of the dataset, any errors in attributed transaction volume due to VPNs are likely to be negligible. We also compared the findings with insights from local cryptocurrency experts and operators worldwide, which gives us more confidence in this approach.
Below is a description of the sub-indices and their calculation methods, as well as the improvements to our method since last year.
Sub-index Category 1: On-chain cryptocurrency value received by centralized services, weighted by PPP-adjusted per capita GDP
We included this sub-index to rank countries based on the total value of cryptocurrency received by centralized services and weighted the rankings to support countries where this amount is more significant compared to their per capita income. To calculate this number, we estimated the total value received on-chain by users of centralized services in each country and weighted it based on the PPP-adjusted per capita GDP, which measures the country's per capita income. After PPP adjustment, the higher the ratio of on-chain received value to per capita GDP, the higher the ranking. In other words, if two countries receive an equal amount of cryptocurrency on centralized services, the country with a lower PPP-adjusted per capita GDP weighted value will rank higher.
Sub-index Category 2: On-chain retail cryptocurrency value received by centralized services, weighted by PPP-adjusted per capita GDP
We also compared the transaction value of non-professional individual cryptocurrency users on centralized services to the purchasing power of the average person to estimate their activity on centralized services. We achieved this by estimating the amount of cryptocurrency received by users on centralized services in each country/region (similar to sub-index category 1), but only calculating the value received from retail-scale transactions, designated as cryptocurrency transactions valued below $10,000. We then ranked each country/region based on this indicator, but weighted it to support countries/regions with lower PPP-adjusted per capita GDP.
Sub-index Category 3: On-chain cryptocurrency value received by DeFi protocols, weighted by PPP-adjusted per capita GDP
We ranked countries based on their DeFi transaction volume and weighted the rankings to support countries with lower PPP-adjusted per capita GDP.
Sub-index Category 4: On-chain retail cryptocurrency value received by DeFi protocols, weighted by PPP-adjusted per capita GDP
We ranked each country based on the transaction volume of retail-scale transfers (again, cryptocurrency valued below $10,000) conducted through DeFi, and weighted it to support countries with lower PPP-adjusted per capita GDP.
Methodological Changes
Method Change 1: Measuring DeFi Activity
The main change in this year's method involves how we measure the value of cryptocurrency received by decentralized protocols. For DeFi services, we only include the value received from suspicious individual wallets and exclude the value received by other known DeFi wallets. This new method ensures that the total value received is not inflated by intermediate transfers required by certain smart contracts.
Here is an example of how DeFi transfers typically work:
An individual wallet initiates an exchange in DeFi protocol A, transferring Ether (ETH) from the individual wallet to the router contract address of DeFi protocol A.
ETH is deposited from the router contract address into the wrapped Ether (wETH) token contract address.
The router contract address receives wETH.
Transfers are made from the router to a decentralized exchange (DEX) pool contract.
Transfers are made from the DEX pool contract to the router.
Finally, transfers are made from the router back to the individual wallet.
According to our new method, we only calculate the value of the first transfer in the example above to determine the total value received by the DeFi protocol. By doing so, we can eliminate intermediary transfers between contracts belonging to the same service provider. This process resulted in a decrease in our estimate of the received value, but it is now a more accurate estimate.
Method Change 2: Excluding P2P Exchange Sub-index
In previous years, we included the volume of P2P cryptocurrency exchange transactions (weighted by per capita PPP and the number of internet users) to calculate the overall ranking of the global cryptocurrency adoption rate. This year, we decided to exclude this sub-index because the activity of P2P exchanges has significantly decreased. One of the largest and oldest P2P exchanges, LocalBitcoins.com, closed last year, which also contributed to this decline.
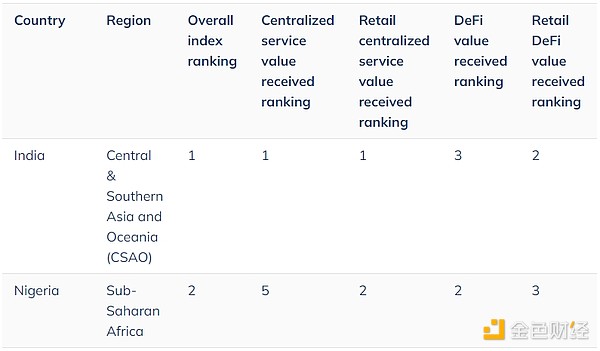
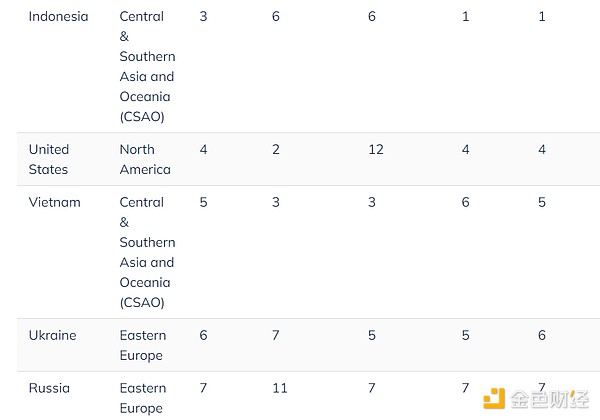
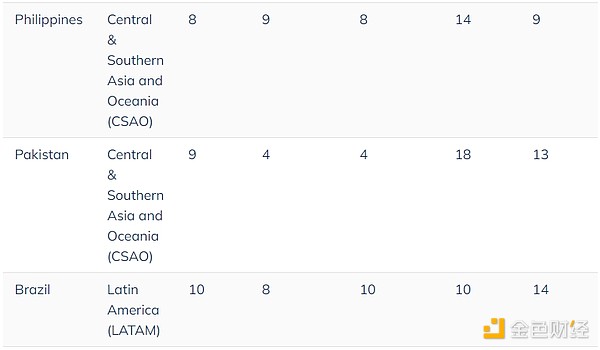
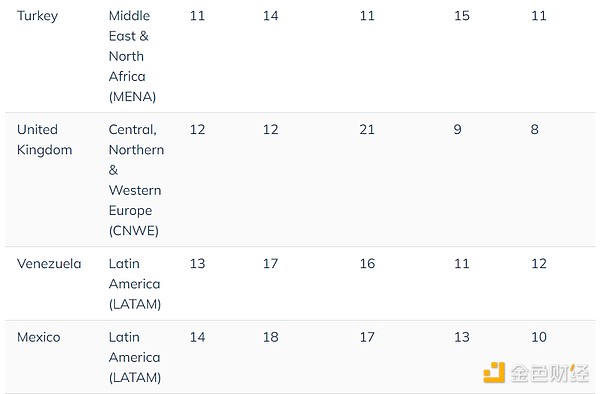
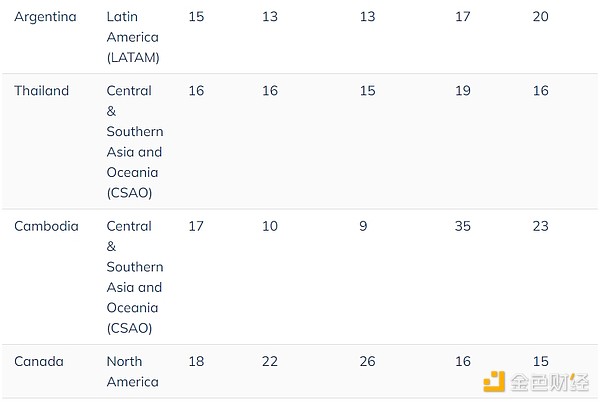
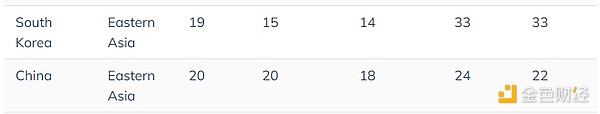
Top 20 Global Cryptocurrency Adoption Index for 2024
Central and South Asia and Oceania (CSAO) dominate our 2024 index, with 7 of the top 20 countries located in this region. As discussed in our full report, CSAO has a unique set of cryptocurrency markets with high levels of local cryptocurrency exchange activity, merchant services, and DeFi.
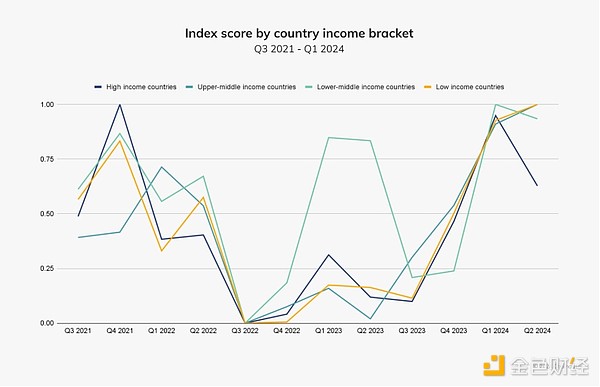
Global Cryptocurrency Activity is Increasing
During the fourth quarter of 2023 to the first quarter of 2024, the total value of global cryptocurrency activity increased significantly, reaching levels higher than during the 2021 cryptocurrency bull market. We can see this pattern in the figure below, where we applied our adoption index methodology globally, summing the index scores for all 151 countries/regions for each quarter from the third quarter of 2021 to the second quarter of 2024, and then re-indexing to show the growth of global adoption over time.
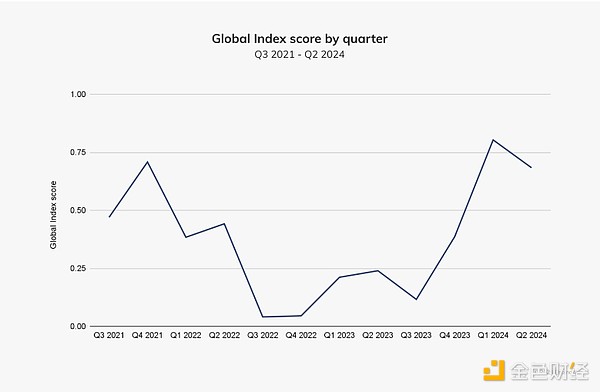
Last year, the growth in cryptocurrency adoption was mainly driven by middle- and low-income countries. However, this year, cryptocurrency activities in countries across all income levels have increased, while high-income countries have seen a decline since early 2024.
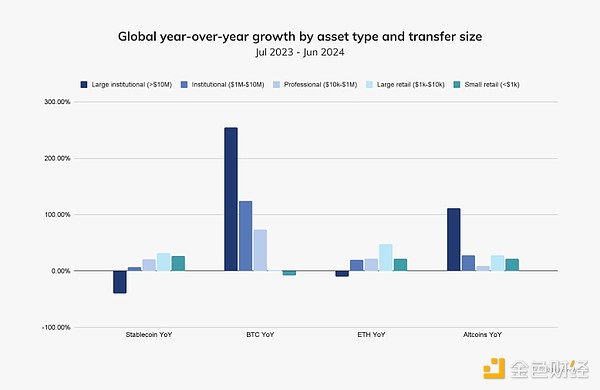
The launch of a Bitcoin ETF in the United States has led to an increase in the total value of Bitcoin activity across all regions, with particularly strong year-over-year growth in institutional-scale transfers and high-income regions such as North America and Western Europe. In contrast, stablecoins have seen higher year-over-year growth in retail and professional-scale transfers, and are supporting real-world use cases in low- and middle-income countries such as sub-Saharan Africa and Latin America.
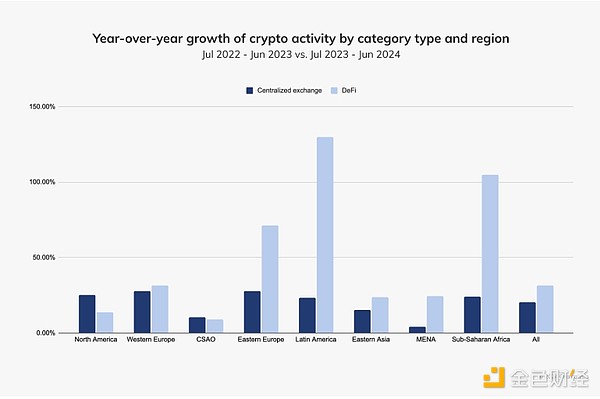
When we look at the year-over-year growth of service types, we find a significant increase in DeFi activity in sub-Saharan Africa, Latin America, and Eastern Europe. As shown in the figure above, this growth may be driving the increase in altcoin activity in these regions.
免责声明:本文章仅代表作者个人观点,不代表本平台的立场和观点。本文章仅供信息分享,不构成对任何人的任何投资建议。用户与作者之间的任何争议,与本平台无关。如网页中刊载的文章或图片涉及侵权,请提供相关的权利证明和身份证明发送邮件到support@aicoin.com,本平台相关工作人员将会进行核查。


