In the financial trading market, the significant uncertainty and potential risks are often referred to as the "financial game," and this is not an exaggeration. It is precisely because the market is filled with various stories and expectations that when the market lacks speculative themes, the power of price fluctuations weakens. So, how does Bitcoin perform in this environment? When will a new uptrend appear? This article will start with the recent trend of Bitcoin and delve into the risks and opportunities in the trading market.
The Impact of CPI Data on Bitcoin: Why is the Price Weak?
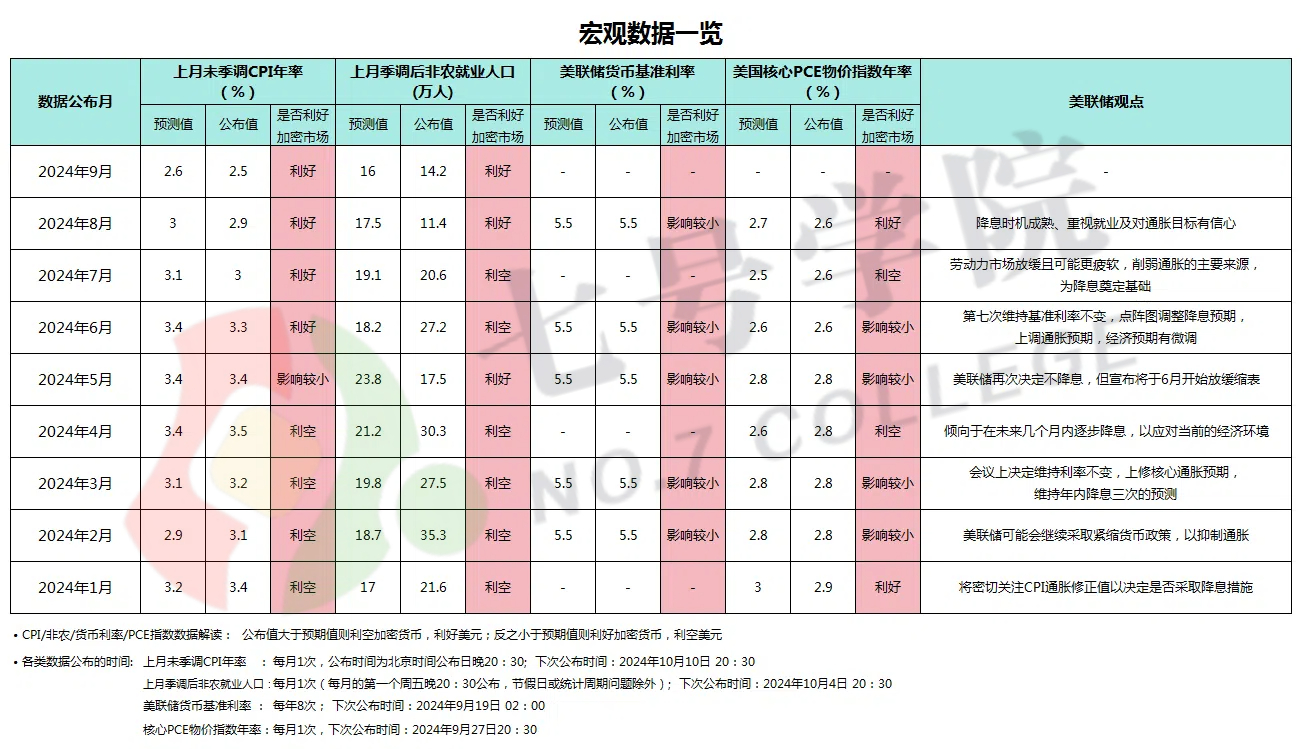
After the release of the US CPI data yesterday, Bitcoin showed a "falling first and then rising" trend. Despite the data showing a 2.5% increase in CPI, lower than expected, which should have been favorable news for the market, Bitcoin's performance did not exhibit the expected strength. After the CPI data was announced, Bitcoin initially fell to $55,500 and then rebounded. This trend indicates that Bitcoin's market sensitivity to external economic data is gradually weakening.
This reflects a market rule: when there are no stories to tell, or when the story ends, the speculative sentiment in the market disappears. Without the driving force of speculation themes, market volatility decreases, and the market appears weak.
Bitcoin Technical Analysis: Divergence and Key Resistance Levels
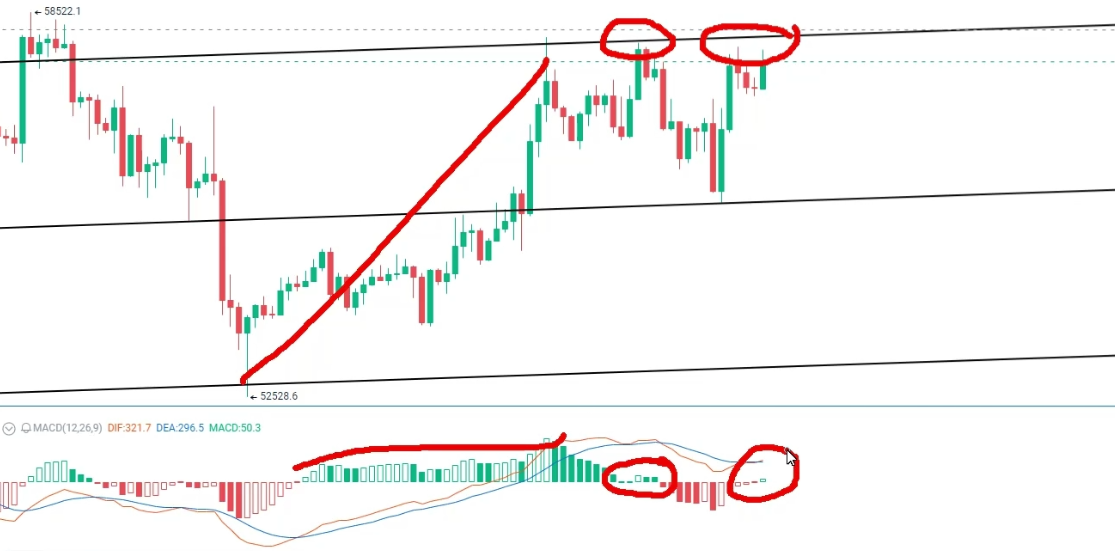
In the daily and hourly Bitcoin price trend charts, we can see that Bitcoin has been rejected three times at the high point of $58,300. Yesterday, Bitcoin attempted to break through this resistance level twice, and today marks the third attempt. If the fourth attempt fails, from a technical perspective, Bitcoin may face the need for further retracement.
More notably, the technical indicator MACD (Moving Average Convergence Divergence) shows a clear "bearish divergence" signal. In simple terms, when the price continues to reach new highs, but the momentum bars of the MACD gradually shrink, it indicates that the bullish momentum is waning, and bearish momentum may soon take over the market. Divergence does not necessarily mean that the price will immediately decline, but it increases the likelihood of a price reversal.
We can see that during the previous uptrend of Bitcoin, the momentum gradually increased. However, with the second attempt to rise, the momentum gradually weakened, especially in the recent third and fourth attempts, the signs of exhausted momentum became more apparent. According to technical analysis logic, if Bitcoin fails to effectively break through the $58,300 pressure level, it is likely to fall to the lower channel and form a new support.
The Uncertainty of Trading and Market Awe
There is an eternal principle in the trading market: uncertainty. This is also the root of what we call the "financial game." Many people hope to find opportunities of certainty in the market, seeking so-called "risk-free arbitrage," but this is precisely the reason why many investors fail. As emphasized in our trading, having awe for the market and the way of trading is a quality that every successful investor must possess.
The current technical form of Bitcoin tells us that the market does not provide a clear signal of an uptrend or downtrend. Therefore, at the key resistance level of $58,000, we need to be more cautious. If the price cannot effectively break through $58,300, Bitcoin may once again face retracement risks. The exhaustion of bullish momentum on the two-hour timeframe further highlights the importance of this key price level.
The Key to the Future Trend of Bitcoin: Technical Form and Time Period
On the weekly timeframe, Bitcoin's price is still suppressed by the 30-week moving average. The price of the 30-week moving average is close to $58,800, near the $60,000 integer mark. If Bitcoin can break through this technical resistance, the market will open up new upward space; conversely, if it continues to be suppressed, it may face a long period of consolidation or retracement.
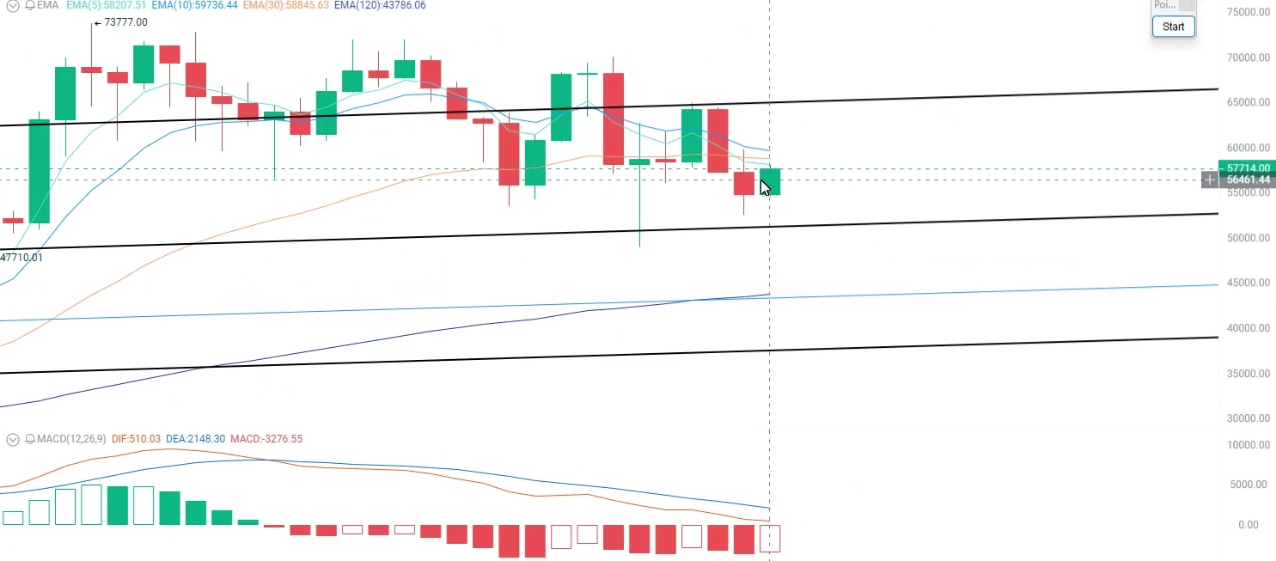
Technically, the MACD indicator is also an important signal. If the MACD can successfully form a bullish cross above the zero axis on the weekly timeframe, Bitcoin may have the potential to start a new uptrend; if the MACD falls below the zero axis, the market may experience a new downtrend.
Trading Wisdom: How to Find Opportunities in Uncertainty?
In summary, the core of trading lies in how to deal with uncertainty. In the current price trend of Bitcoin, we see both the potential for continued upward momentum and the risk of retracement. Therefore, as traders, we should not blindly predict the market but respond reasonably based on the signals given by the market.
As the adage in the trading market goes: "Everything you see is an illusion." Only when we can recognize our role in trading can we be confident and stand invincible in this market. The ultimate development of Bitcoin's price trend is not something we can fully control, but we can ensure that we are always making the right decisions, maintaining awe for the market, and constantly adjusting our strategies to deal with various changes.
The volatility and uncertainty of the Bitcoin market are challenges that all traders must face. Near the current key resistance level, we need to remain rational and avoid being influenced by market sentiment. Whether it is an uptrend or a downtrend, our goal is to be prepared for any situation through scientific analysis and strategy. This is not only the truth of the Bitcoin market but also the core wisdom of all financial markets.
免责声明:本文章仅代表作者个人观点,不代表本平台的立场和观点。本文章仅供信息分享,不构成对任何人的任何投资建议。用户与作者之间的任何争议,与本平台无关。如网页中刊载的文章或图片涉及侵权,请提供相关的权利证明和身份证明发送邮件到support@aicoin.com,本平台相关工作人员将会进行核查。


