Daily Sharing
In the recent market fluctuations, the price of Bitcoin has not fluctuated much. The rebound on the 1-hour chart has been relatively slow. Personally, there hasn't been much activity on my end, mainly waiting for the signal of the end of the 1-hour rebound. From the current perspective, the 1-hour rebound should be almost over. It is expected that Bitcoin will experience a 1-hour downtrend in the next few days. In the short term, it may break below 52550 again. If it does, the focus will be on whether it will drop below 49000.
BTC
Due to the rapid changes in the market in the short term, this article can only make predictions based on the market changes at the time of publication. Short-term players should pay attention to the latest market changes and use this information as a reference only.
1H:
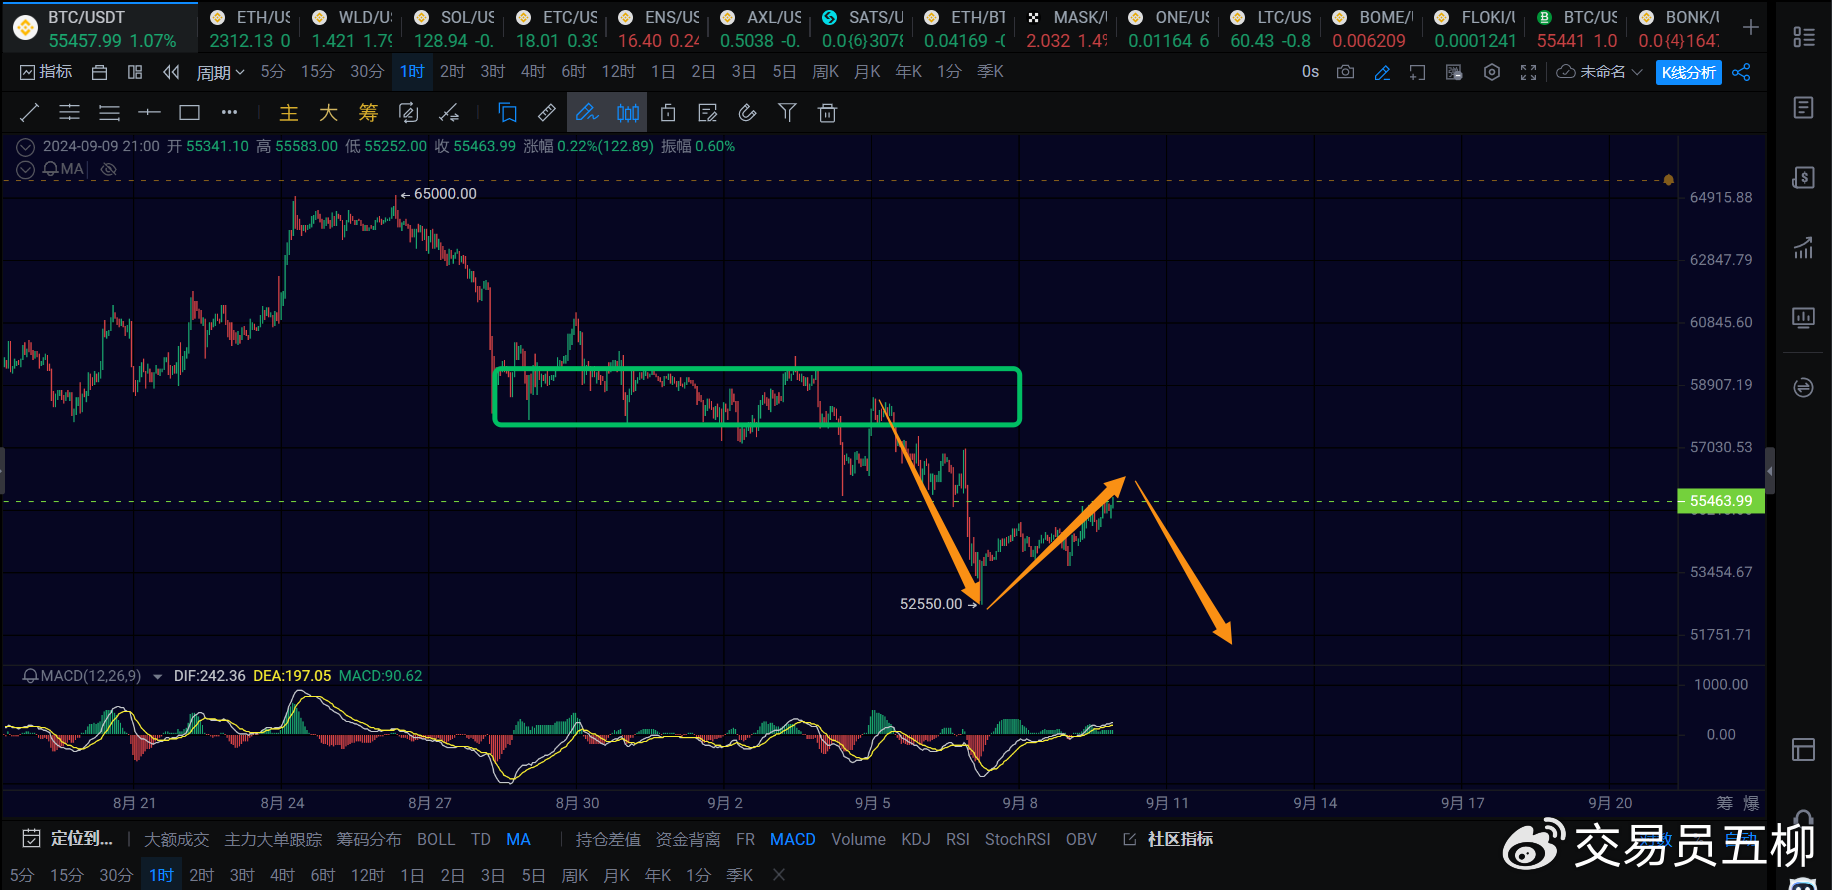
On the 1-hour chart, the expectation for the 1-hour rebound is almost over. In the short term, it remains to be seen whether it will rally near 56000 again. As long as the short-term 1-hour rebound cannot break through 57000, there will likely be another 1-hour downtrend, breaking below 52550 again, leading to a third wave of decline.
15M:
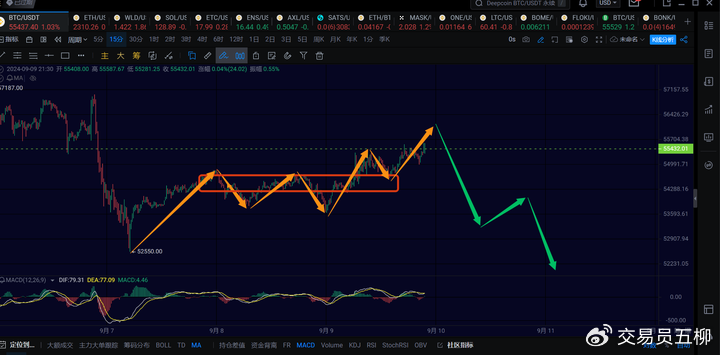
On the 15-minute chart, the current rebound on the 15-minute chart is being observed to see if it will rally near 56000 again. In the short term, if it fails to break through 57000, it is very likely to experience a 1-hour downtrend towards the 52000-49000 range. If it falls below 54500 again, it confirms that Bitcoin is going to experience a 1-hour downtrend.
ETH
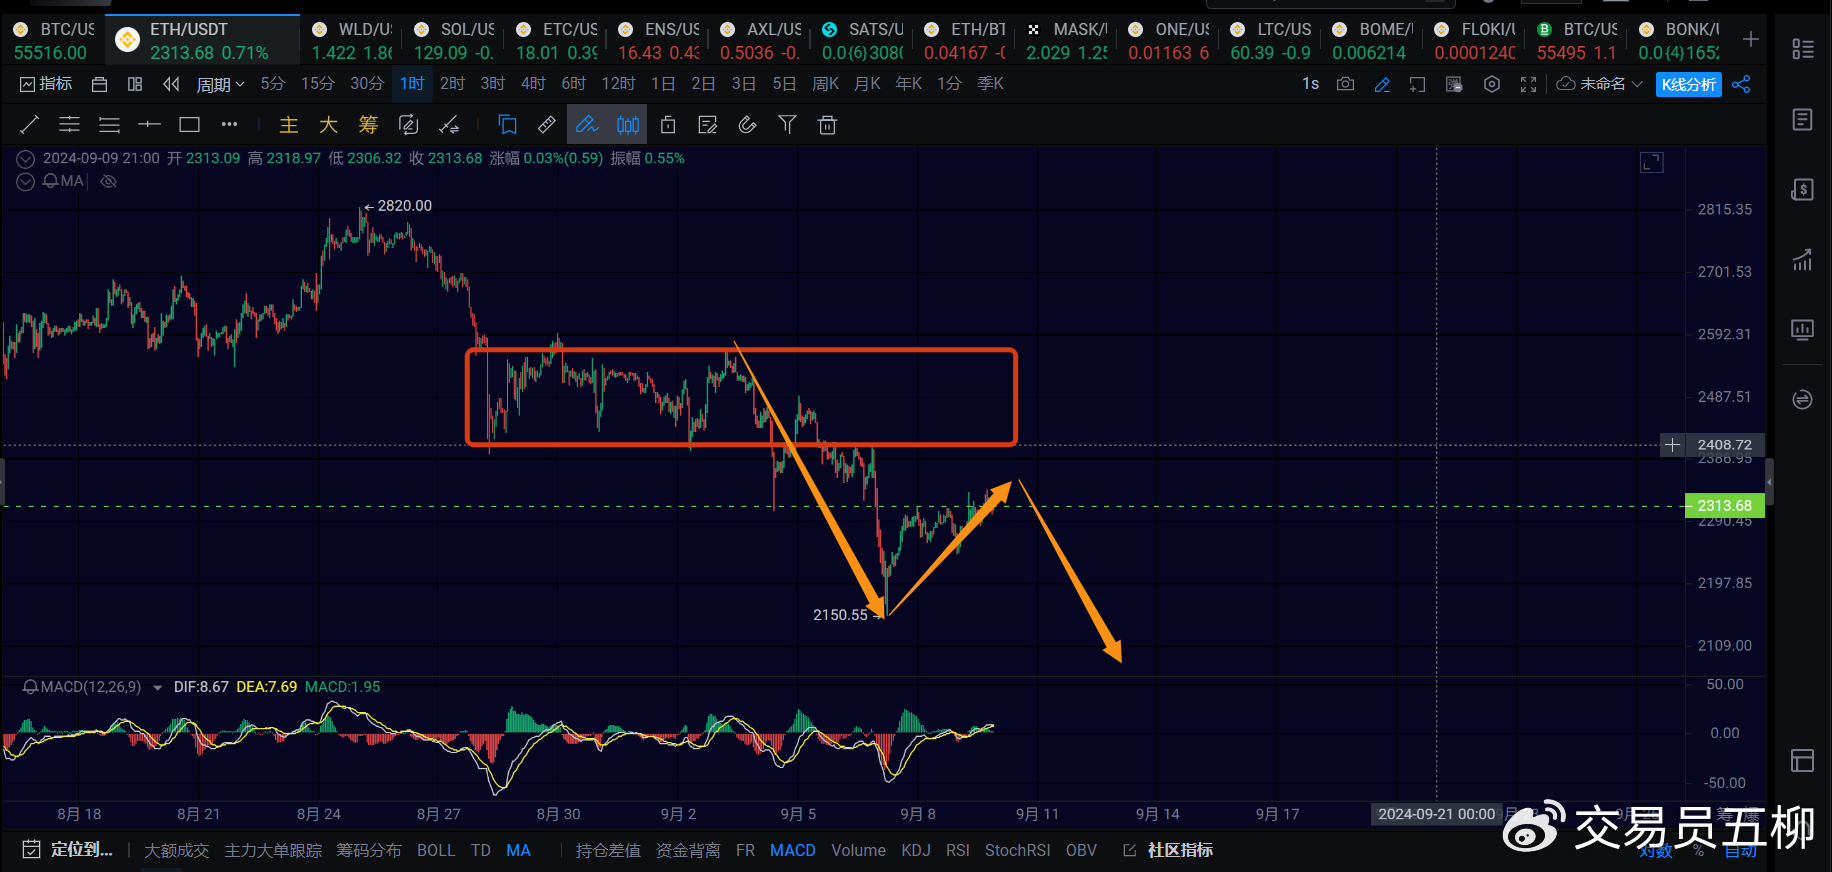
On the 1-hour chart for Ethereum, the structure of the 1-hour rebound should be almost over. In the short term, it can be observed whether the rebound on the 15-minute chart will rally below 2360. As long as this 1-hour rebound cannot break through 2400, there is a high probability of another 1-hour downtrend, retracing to the 2100 or 2000-2100 range.
Trend Direction
Weekly Chart: Downward direction, the extension of the weekly downtrend, theoretically around 49000, with a limit of 45000-48000. Whether it has ended currently still needs to be observed.
Daily Chart: Upward direction, watching whether it will fall below 49000.
4-hour Chart: Downward direction, the downtrend on the 4-hour chart has not ended.
1-hour Chart: Downward direction, the expectation for the 1-hour rebound is almost over. In the short term, it is necessary to observe a 1-hour downtrend.
15-minute Chart: Downward direction, falling below 54500 again confirms a 1-hour downtrend.
Feel free to follow my public account for discussions and exchanges:

The article is time-sensitive. Pay attention to the risks. The views in the article are personal opinions and are for reference only!
免责声明:本文章仅代表作者个人观点,不代表本平台的立场和观点。本文章仅供信息分享,不构成对任何人的任何投资建议。用户与作者之间的任何争议,与本平台无关。如网页中刊载的文章或图片涉及侵权,请提供相关的权利证明和身份证明发送邮件到support@aicoin.com,本平台相关工作人员将会进行核查。


