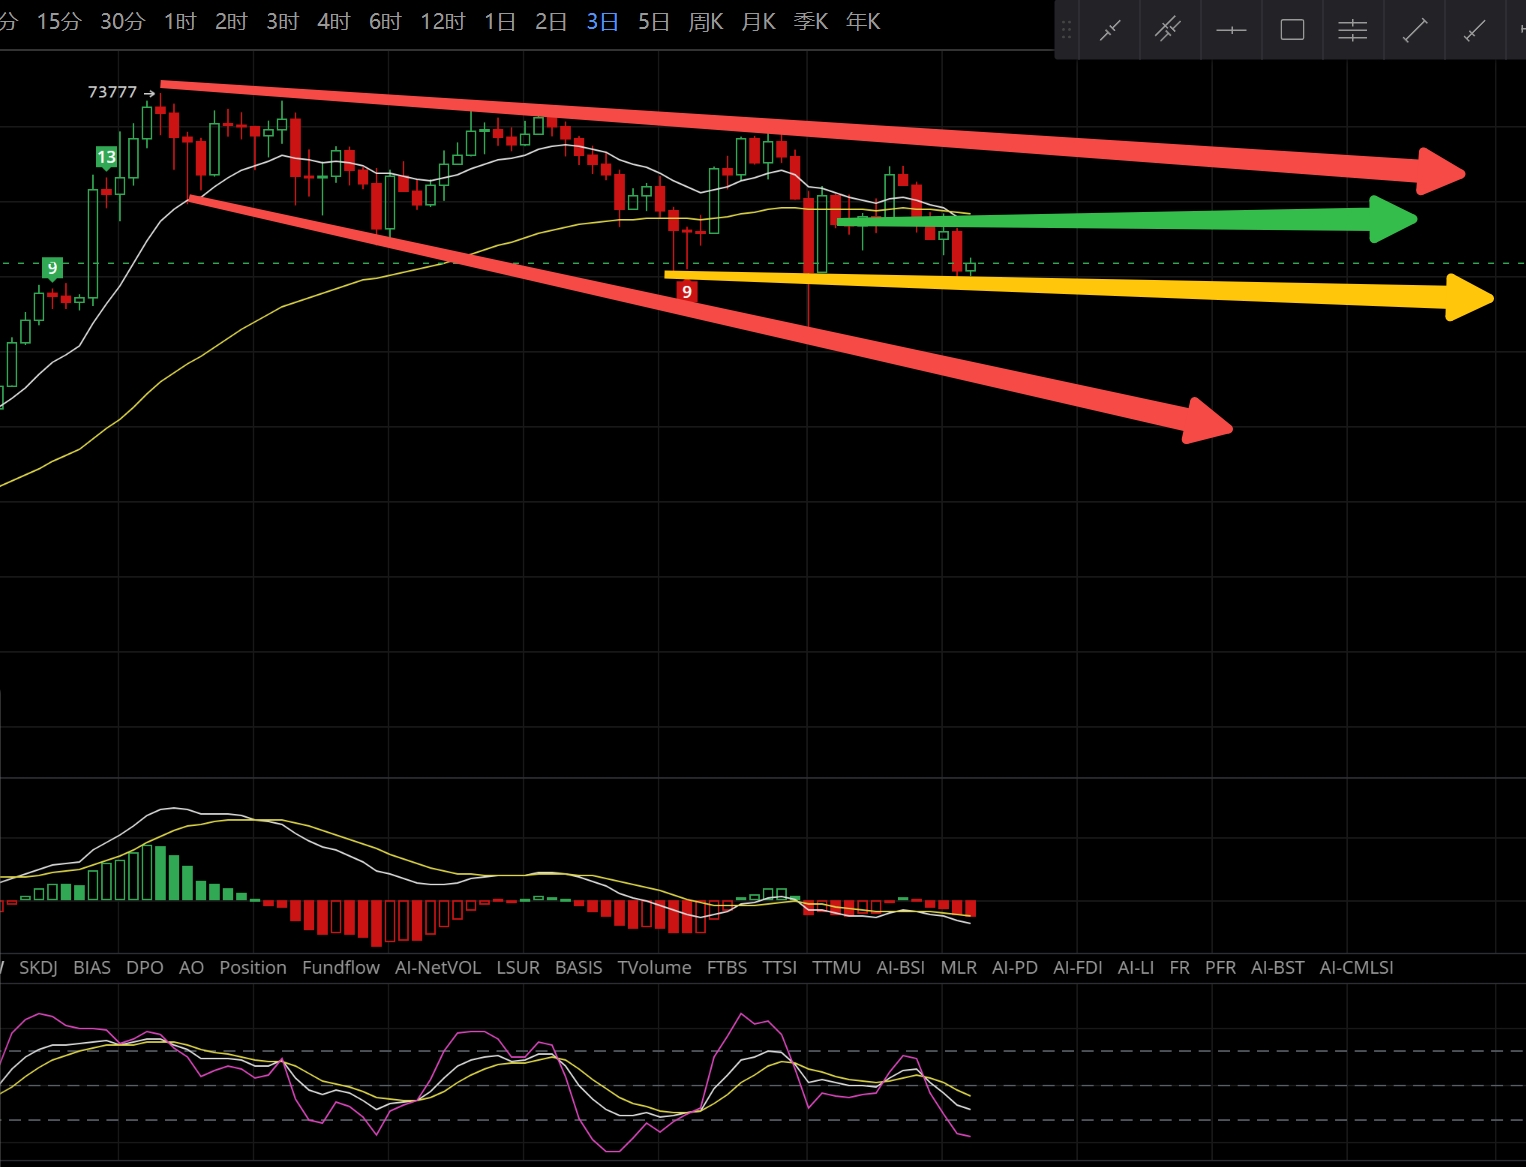
BTC changed the weekly and three-day lines today. The weekly line is still in a bearish release state, and the three-day line is as well. Currently, the bearish energy is still significant. Last week, BTC tested the trend level of 52,000 on the weekly line. Currently, the support is still effective. In the short term, the 12-hour and 4-hour charts show a demand for a rebound, while there is resistance at higher levels. It is expected that there will still be oscillations to release the bearish pressure on the weekly and three-day lines. Due to the longer period of oscillation adjustment for ETH, the energy on the weekly line is relatively sufficient compared to the overall market adjustment. ETH has reached the critical zone below, and it is expected to need 1-2 more weeks on the weekly line before a rebound. Then, there will be a rebound. It is expected that altcoins will also have a relatively large rebound at that time. Overall, it is still necessary to pay attention to the position of altcoins this year. In the short term, BTC support is at 54,000-53,300, with resistance at 55,300-55,600-56,200-58,000-59,000. The daily trend level for ETH is at 61, with support at 2,250-2,150-2,000-1,780 (monthly trend level) and resistance at 2,320-2,370-2,630. The intraday fluctuations are expected to be greater than yesterday, and the fluctuations this week will also be relatively large.

You can also follow our official account:

免责声明:本文章仅代表作者个人观点,不代表本平台的立场和观点。本文章仅供信息分享,不构成对任何人的任何投资建议。用户与作者之间的任何争议,与本平台无关。如网页中刊载的文章或图片涉及侵权,请提供相关的权利证明和身份证明发送邮件到support@aicoin.com,本平台相关工作人员将会进行核查。


