Daily Sharing
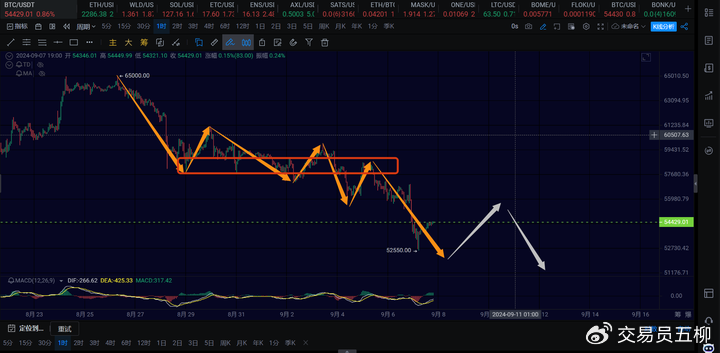
Bitcoin wavered and fell to around 52550. The continuous downward trend in the past few days has not shown any strong rebound. If the downward trend continues here, we need to continue to observe whether the short-term trend will continue to extend downwards. A temporary rebound at the 4-hour level is not yet visible, and only when the daily chart forms a bottom pattern can we confirm a rebound at the 4-hour level.
BTC
Due to the rapid changes in the market, this article can only make predictions based on the market changes at the time of publication. Short-term players should pay attention to the latest market changes and use this information as a reference only.
1H:
At the 1-hour level, the biggest difficulty in the short term is that we cannot determine when the overall downtrend will end based on signals from the left side. It is difficult to judge when the 1-hour level rebound will occur and when the 4-hour level rebound will start due to the continuous downward trend. We can only observe and react as the situation unfolds.
In the short term, we first need to observe whether a 1-hour level rebound can occur here. If it cannot pull back above 55000, it may continue to extend the downward trend from the 1-hour center leaving segment to below 52000 or even lower.
If a 1-hour level rebound occurs but fails to break through 57000 or 57900, there is a high possibility of another 1-hour level decline to 51000 or even 49000.
15M:
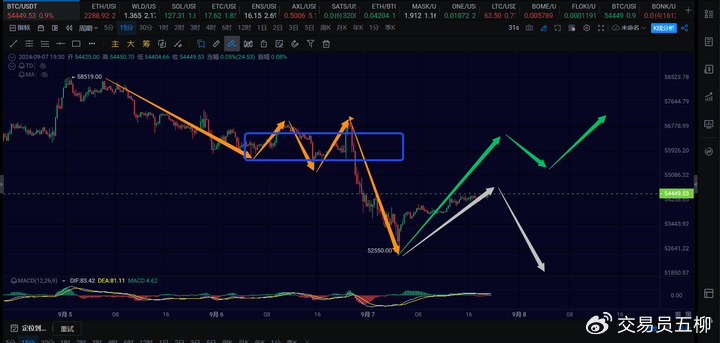
At the 15-minute level, a continued downward extension was constructed last night through a 15-minute level center. If the 15-minute level rebound here does not pull back to 55600, there may be another 15-minute level decline towards 52550, with support levels at 51000, 50000, and 49000.
If it can break through 55600, then we may see a 1-hour level rebound towards 56500 or above.
ETH
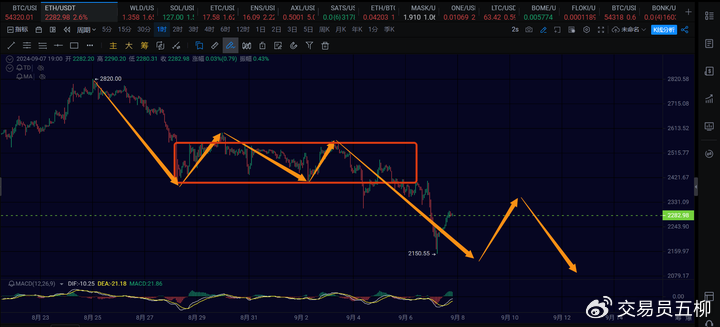
Ethereum continues to decline, failing to stabilize around 2300 as expected, and has once again retraced to 2150. Therefore, it is still uncertain whether a short-term 1-hour level rebound for Ethereum can occur, and there is still a possibility of a 15-minute level pullback to around 2100. If it breaks through 2320, there is hope for a 1-hour level rebound.
If the 1-hour level rebound cannot pull back to 2400, there may be another 1-hour level decline to test the 2000-2100 range. If the 1-hour rebound can pull back to 2400, then we may see a potential new 4-hour level rebound.
The short-term trend is bearish, so caution is advised for long positions.
Trend Direction
Weekly Chart: Downward direction, theoretically around 49000, with a limit of 45000-48000. Whether it has ended still needs to be observed.
Daily Chart: Upward direction, the probability of Bitcoin directly rebounding at the daily level from around 49000 increases. If it does not fall below 49000 this week, there is a possibility of rebounding to the range of 65000-70000 in September.
4-hour Chart: Downward direction, if the rebound does not occur soon, there may be further decline. Specific observation is needed to see if a three-sell occurs at the 1-hour level.
1-hour Chart: Downward direction, the 1-hour level decline may continue, and breaking through 55600 may lead to a 1-hour level rebound.
15-minute Chart: Upward direction, the resistance for the short-term 15-minute level rebound is at 55600.
Feel free to follow my public account for further discussion and exchange:

The article is time-sensitive, so please be aware of the risks. The views in the article are personal opinions and are for reference only!
免责声明:本文章仅代表作者个人观点,不代表本平台的立场和观点。本文章仅供信息分享,不构成对任何人的任何投资建议。用户与作者之间的任何争议,与本平台无关。如网页中刊载的文章或图片涉及侵权,请提供相关的权利证明和身份证明发送邮件到support@aicoin.com,本平台相关工作人员将会进行核查。


