Daily Sharing
Last week, the rebound of the 4-hour chart of Bitcoin surged to around 65,000, and then began a 4-hour level pullback. The overall trend is in line with my expectations. Bitcoin successfully encountered resistance around 65,000 and pulled back to the expected 55,000 level. The prediction of the trend at a larger scale has been relatively smooth. Personally, I shorted near 65,000, closed the short position near 59,500, and made several successful short-term trades in between.
In the short term, Bitcoin failed to stabilize around 56,300 yesterday and continued to decline today, extending the 4-hour level downtrend. We still need to observe the current situation. The 4-hour level pullback structure is almost complete, and what we need to wait for is the 4-hour level rebound of Bitcoin, as the trend will eventually come to an end, currently in a divergence stage.
It's not that I strongly favor a bullish view, or that I insist on a bullish outlook, it's just that the expected structure will eventually emerge, and the process cannot be avoided.
BTC Medium and Long Term
Weekly Chart:
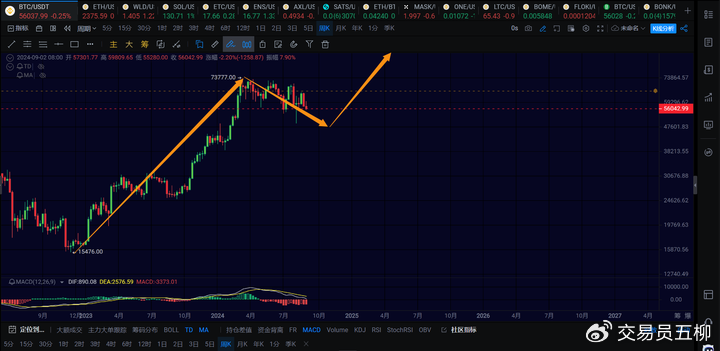
At the weekly level, it is still undergoing a pullback. There is still no definite conclusion as to whether the 49,000 level will become the low point of the weekly pullback. If the trend is complex and prolonged, the weekly pullback may reach the 45,000 to 48,000 range. If the future trend is relatively strong, then 49,000 may directly become the bottom of the weekly pullback.
However, the specific situation can only be left to the subsequent time to unfold. My suggestion is to have expectations for different amplitudes, with a focus on short-term contracts. For spot trading, there is no need to insist on buying at the lowest point. As long as the next wave of upward trend at the weekly level is confirmed, both altcoins and mainstream coins will have opportunities. The key issue is when the new upward trend will come, which requires more clues and cannot be determined in just one or two days.
Daily Chart:
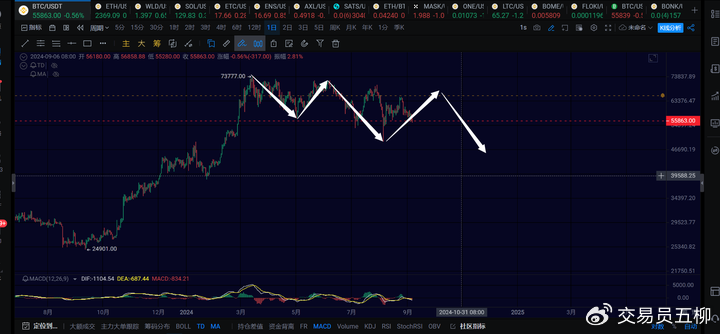
At the daily level, I currently lean towards 49,000 being the low point of Bitcoin's third daily level downtrend. It is currently running the fourth daily level rebound, with an expected target range of 65,000 to 70,000, followed by the fifth daily level downtrend to break below 49,000.
This is my personal trend expectation. Because the probability of the 4-hour level downtrend breaking below 49,000 is decreasing, 49,000 has the potential to become the starting point of a new daily level rebound. However, even if a daily level rebound occurs, the probability of it directly breaking through 70,000 is decreasing, so there is still a chance of a fifth daily level downtrend breaking below a new low point in the future.
4-Hour Chart:
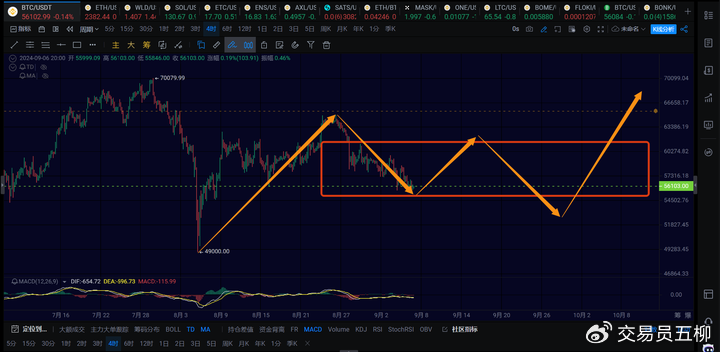
At the 4-hour level, it is still running a pullback from 65,000. The pullback to 55,000 is almost as expected, but the short-term rebound at the 4-hour level has not been successful yet, so we need to observe the support at 55,000. If it cannot hold, it may need to go to around 54,000 or 53,500 before ending the 4-hour level pullback and starting a 4-hour level rebound. If 55,000 can hold, then a 4-hour level rebound is very likely.
Personally, the probability of the next 4-hour level rebound directly breaking through 65,000 is not very high. It is very likely to reach around 62,000, and then undergo another 4-hour level pullback to around 53,000, forming a 4-hour level consolidation, and finally undergo a rebound to the 65,000 to 70,000 range, completing the entire daily level rebound.
From my personal expectations, the overall trend is oscillating within a relatively large range. Currently, there is no clear indication of a direct upward trend to surpass 74,000, nor is there a clear indication of a continued downtrend to below 46,000. The probability of oscillation is higher.
BTC Short Term
Due to the rapid changes in the market, this article can only make predictions based on the market conditions at the time of publication. Short-term traders should pay attention to the latest market changes and use this information as a reference only.
1-Hour Chart:
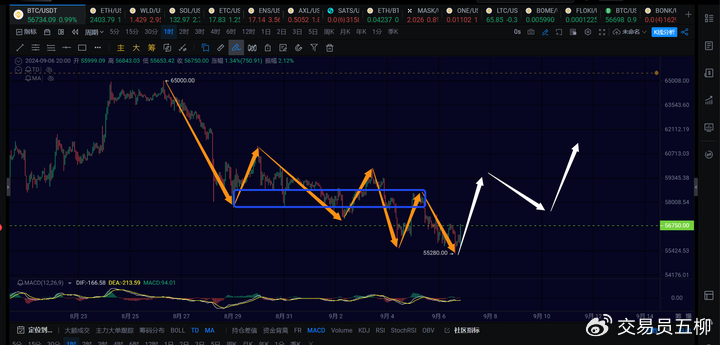
At the 1-hour level, the trend has moved a little further than expected. Yesterday's rebound failed to break through successfully and instead continued the 4-hour level downtrend. We continue to observe the strength of the 1-hour level rebound. If it can re-break through 57,900, we believe that the probability of Bitcoin's 4-hour level rebound may reach over 90%, as indicated by the white arrow in the image. The target range for the 4-hour level rebound is around 61,000 to 62,000. If the short-term rebound cannot break through 57,900, then it is necessary to pay attention to the possibility of the short-term extension to around 54,500.
15-Minute Chart:
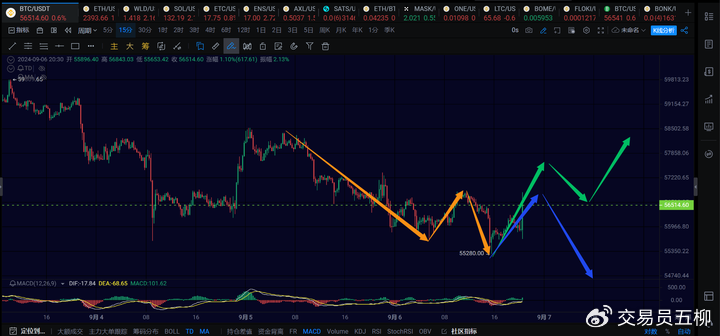
At the 15-minute level, we are currently observing the strength of this 15-minute level rebound. If it can surge above 57,000, then there is a high probability of a 1-hour level rebound, as indicated by the green arrow in the image. If the 15-minute level rebound cannot break through 57,000, then it is necessary to be cautious about the possibility of further extension to around 54,500, as indicated by the blue arrow in the image.
ETH
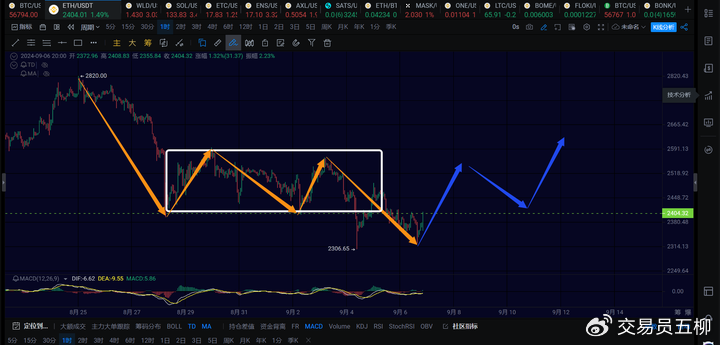
At the 4-hour level, Ethereum's downtrend has also extended. The decline from yesterday to today is an extension of the consolidation phase. It is still a potential divergence stage, and there is a probability that the 4-hour level downtrend will end around 2,300. If it can re-break through 2,450 in the short term, there is hope for a 4-hour level rebound to around 2,600.
Currently, I still lean towards expecting a rebound until the structure of the 4-hour level rebound is formed.
Trend Direction
Weekly Level: Downward direction, with the weekly downtrend extending. Theoretically, it is almost at 49,000, with a potential range of 45,000 to 48,000. Whether it has ended or not still needs to be observed.
Daily Level: Upward direction, with the probability of Bitcoin directly rebounding from around 49,000 increasing. If it does not fall below 49,000 within this week, there is a possibility of another rebound to the 65,000 to 70,000 range in September.
4-Hour Level: Upward direction, with the probability of starting a 4-hour level rebound to around 62,000 in the short term.
1-Hour Level: Upward direction, observing whether the first 1-hour level rebound can be successful.
15-Minute Level: Upward direction, continuing to observe whether 67,900 is broken in the short term.
Feel free to follow my public account for discussions and exchanges:

The article is time-sensitive, so please be aware of the risks. The views expressed in the article are personal opinions and are for reference only!
免责声明:本文章仅代表作者个人观点,不代表本平台的立场和观点。本文章仅供信息分享,不构成对任何人的任何投资建议。用户与作者之间的任何争议,与本平台无关。如网页中刊载的文章或图片涉及侵权,请提供相关的权利证明和身份证明发送邮件到support@aicoin.com,本平台相关工作人员将会进行核查。


