
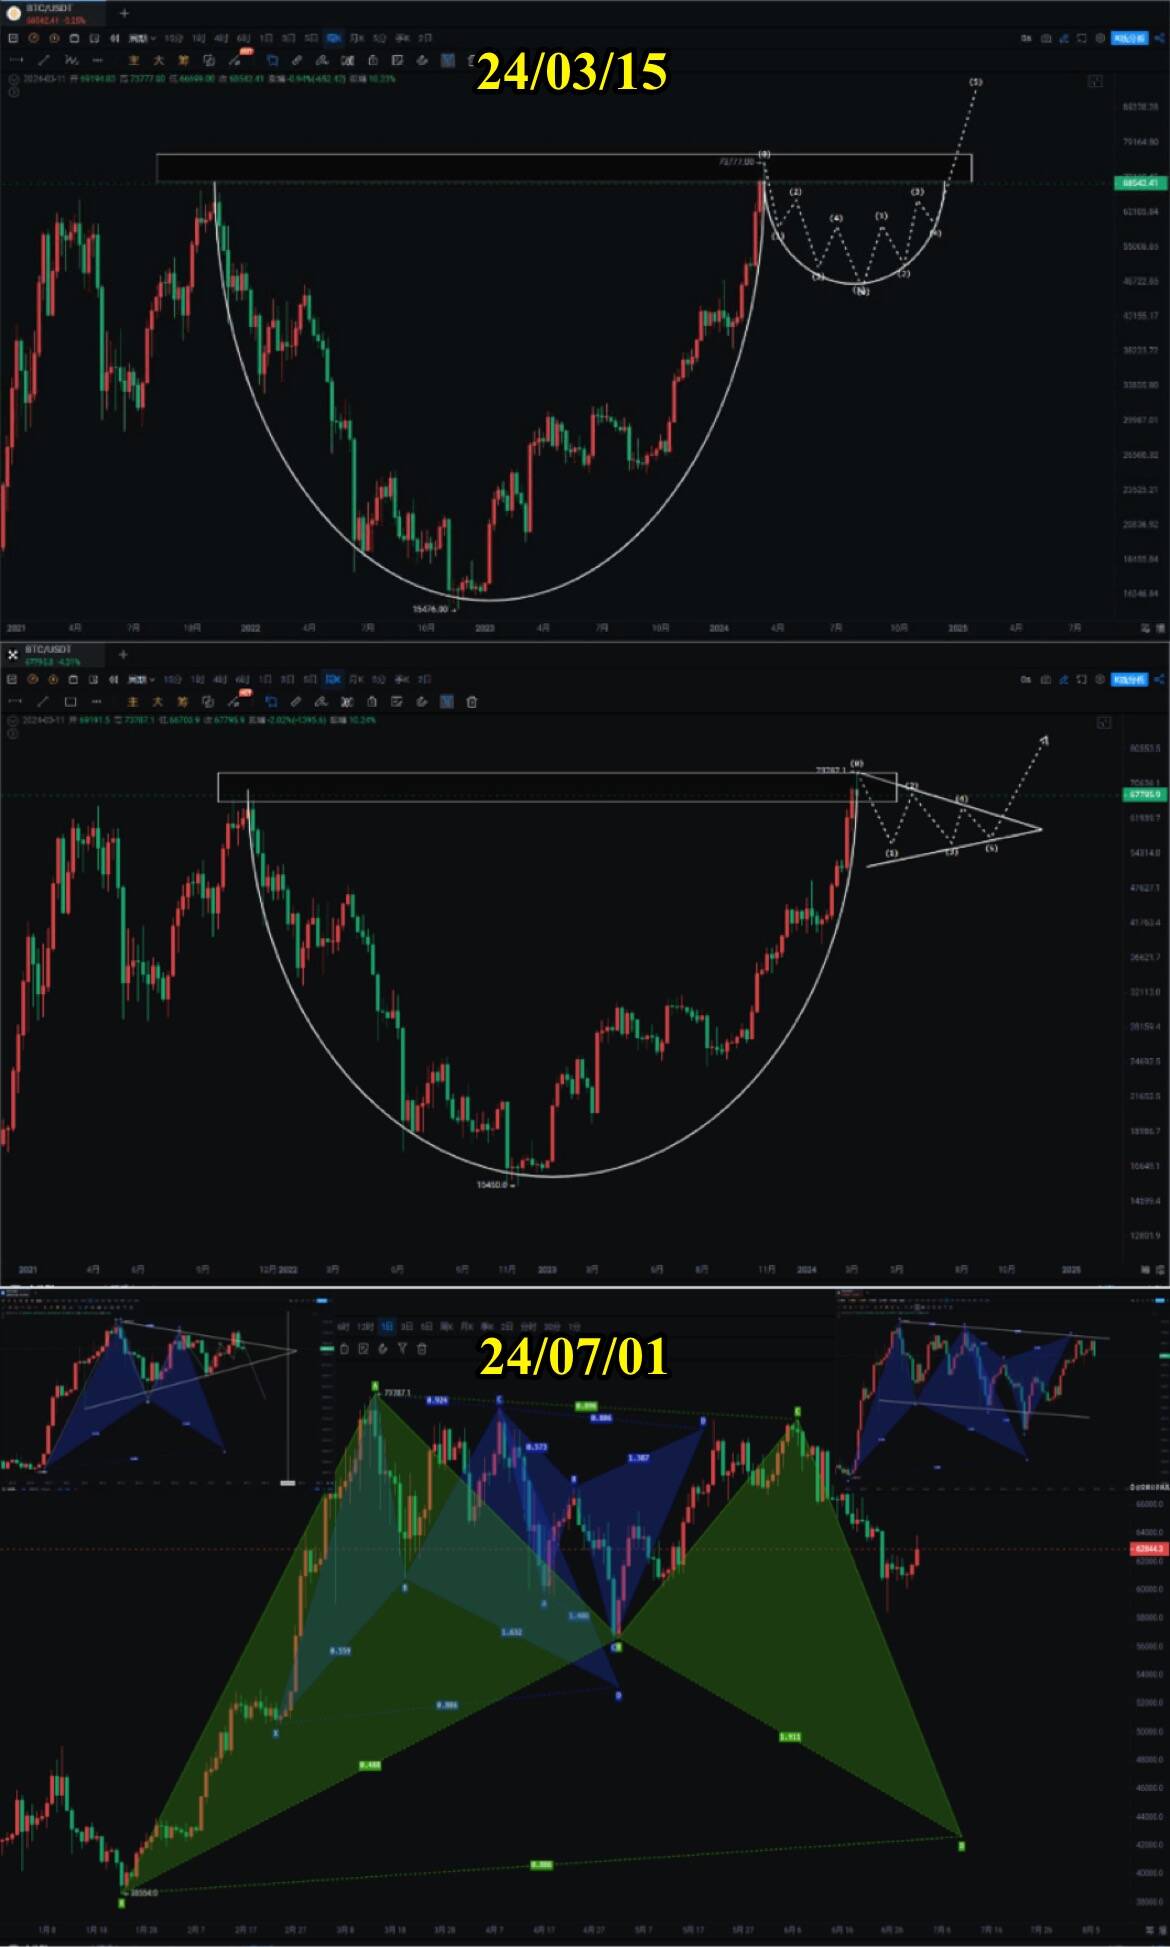
The horizontal will change for a long time, and the horizontal will fall for a long time, especially after oscillating at a high level for more than half a year. If the high point cannot be broken through, it will inevitably go down. This is the process of energy transmission. There is also a saying that "once prosperous, twice declining, and thrice exhausted," which is also the change of power. We warned of a sharp drop at 72000 in April and June, and also warned of a pullback when it hit 70000 at the end of July. This time, when it stayed at 65000 for no more than 3 days and fell 5 times, we warned of a sharp drop and also reminded that the final round of sharp drop is still pending. Today, we remind that the US stock market has retraced at the weekly level, and the BTC bulls are struggling to support, with dramatically increased risks, waiting for the opportunity to bottom out after the waterfall!
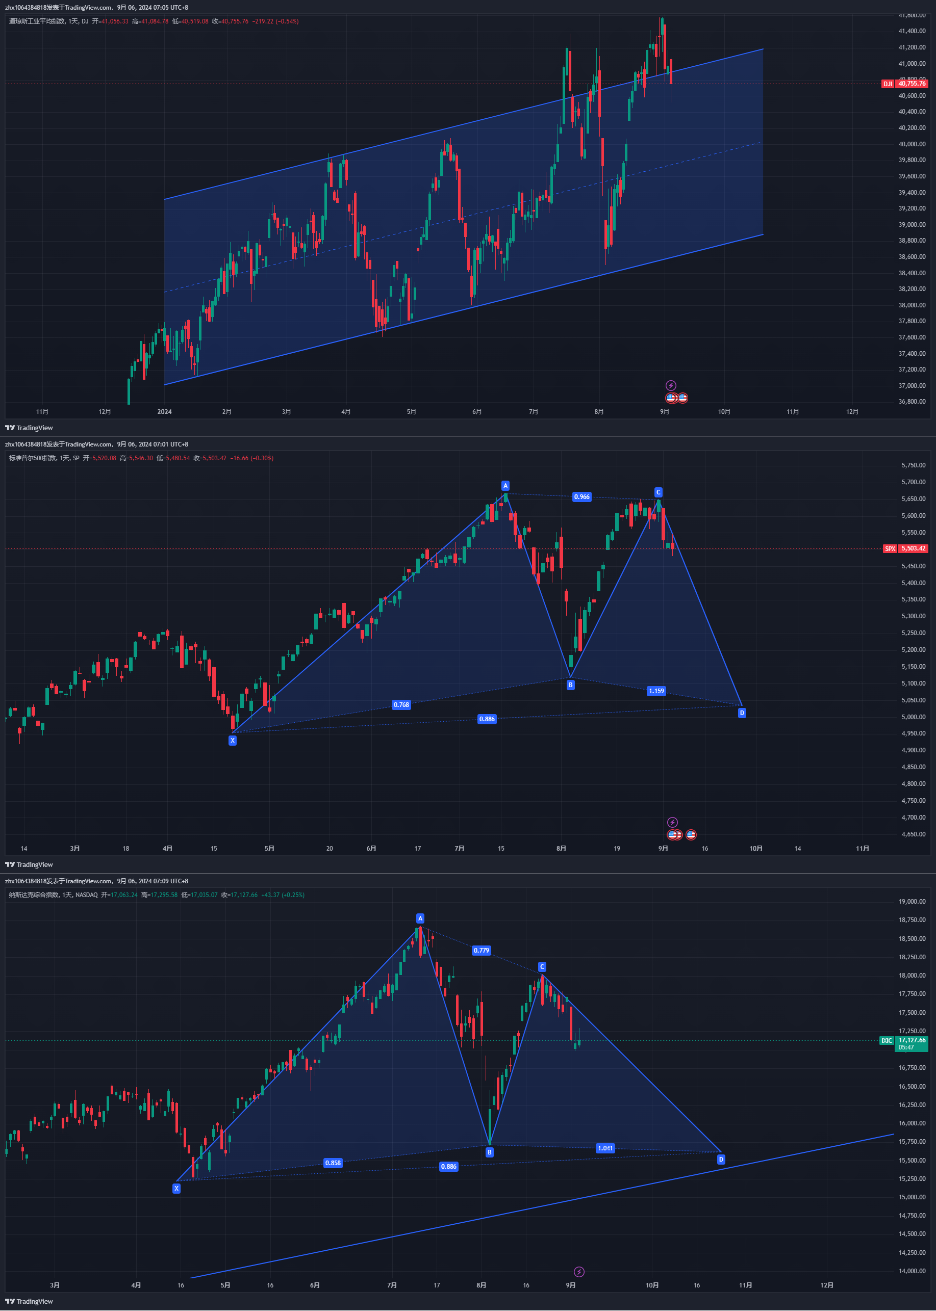
The Dow Jones Industrial Average (DJI) has formed a false breakthrough on the daily M-head, the S&P 500 (SPX) is currently testing the 0.618 level after being blocked near the previous high of 0.786, and the Nasdaq (IXIC) rebound has not broken through the 0.786 level, showing more weakness. It has been mentioned before that Warren Buffett has been crazily reducing his cash reserves, reaching a historical high of 2769, and in his letter to shareholders, he often mentions the phrase "good companies are too expensive," and after perfectly avoiding several financial crises, he repeatedly buys low. Of course, this is just one core point of logic. Warren Buffett definitely has more research and references, but it is unknown to ordinary people.
Bitcoin
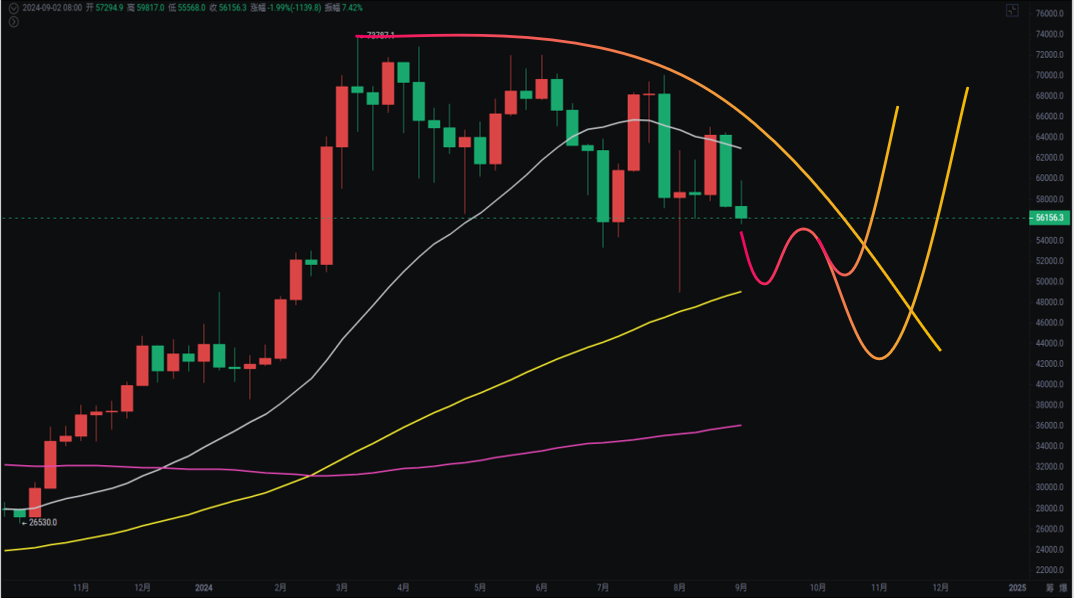
The daily chart of Bitcoin is currently testing the support of two needles, 55555 and 56000. If it falls below the support of 53000-54000, it will need to test the support of 49000 at least. If 49000 is broken again, it cannot fall below 44000-46000. It is easy to turn bearish if it cannot break through 40000.
If the market does not fall sharply and the volume does not explode, it is not a short-term bottom-fishing opportunity. Yesterday, it was mentioned that there were signs of MACD divergence and KDJ crossover on the daily chart, but now it seems to have been invalidated. Currently, the monthly, weekly, and daily trends are all bearish. The rebound after testing the support of 55555 on the 4-hour chart is too weak. I also don't know where some KOLs crazily see the bullish trend. My consistent view is to follow the signals given by the market and reduce my subjective judgment.
Support:
Resistance:
Ethereum
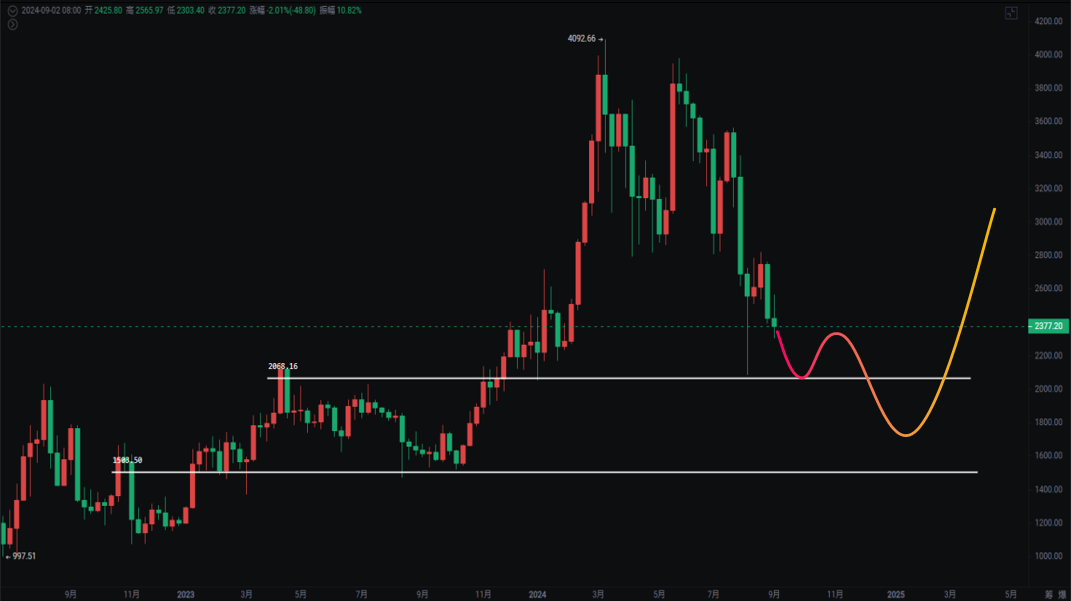
Ethereum itself is weaker, breaking through the support platform of 2800 and failing to recover after the rebound test, and the failure to regain the double Yin and Yang from the previous two days means it needs to test the support of 2111 again, and even a number starting with 1 is not surprising. Many people think that a rate cut will cause a surge, but it is not necessarily the case. Under high interest rates, a rate cut may bring even greater short-term risks, but long-term benefits. Although Bitcoin has only experienced one rate cut cycle, the first rate cut in 2020 was on March 3, and a week later, the 312 plunge occurred. Although the pandemic was the biggest trigger, it cannot be denied that after 7 rate cut cycles in the US stock market, there was a drop in the following week. Is this just a coincidence? The US stock market has now prematurely retraced. This is a dangerous signal. Are we waiting for the opportunity to start a bull market after the reduction of the bubble?
Support:
Resistance:
If you like my views, please like, comment, and share. Let's go through the bull and bear markets together!!!
The article is time-sensitive and is for reference only, with real-time updates.
Focus on candlestick technical research, and win-win global investment opportunities. Official account: Trading Master Fusu

免责声明:本文章仅代表作者个人观点,不代表本平台的立场和观点。本文章仅供信息分享,不构成对任何人的任何投资建议。用户与作者之间的任何争议,与本平台无关。如网页中刊载的文章或图片涉及侵权,请提供相关的权利证明和身份证明发送邮件到support@aicoin.com,本平台相关工作人员将会进行核查。


