The Way of Transmitting Trades, Enjoying a Wise Life.
In the process of trading, in order to achieve stable profits, the principle that must be adhered to is: only trade in the market that you can understand. Based on this principle, two points must be achieved. First, select coins, meaning the chosen coins must be mainstream, preferably leading coins, because this type of token usually has good trading depth. Second, the candlestick pattern must be clear and definite, meaning a clear breakthrough of a technical level or a key level. Only when both conditions are met, the success rate will be greatly improved.
The TON we are discussing today has a total ecological financing amount of nearly 3.5 billion US dollars, and its total market value exceeds 11.5 billion US dollars, making it an existence in the market that cannot be ignored.

From a technical perspective, a thorough analysis of TON reveals many key pieces of information. TON's price has fallen below the EMA120 moving average on the three-day chart as Bitcoin retraced downwards. Looking back, the last time it broke through this average was in March 2024, when the price was only $1.5. It later reached a high of $8.2, with a historical low of $0.735, achieving an increase of more than 10 times.
What we need to focus on now is that TON has not only broken through the EMA120 moving average, but also broken through the key positions of $4.75 and $4.60 in terms of moving average and trend line. These two positions were the bottoming positions some time ago. Once broken, the outlook is rather bleak.
In addition, during the price increase in April 2024, TON's price experienced a volume-driven decline, which is often a signal that the main force is starting to sell off. Subsequently, the price of TON formed a sawtooth pattern similar to Bitcoin's before "519" in 2021, which is a risk signal.
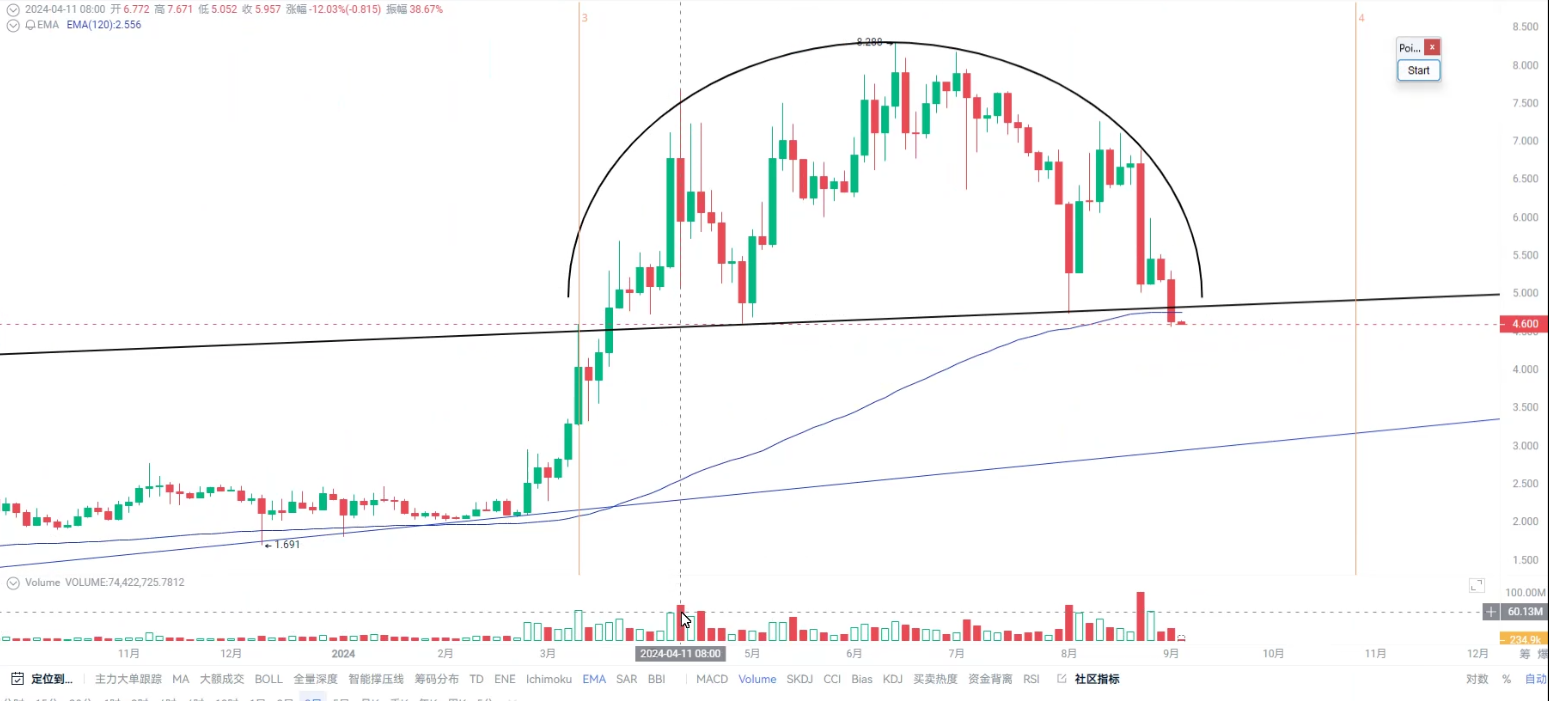
Furthermore, TON's top forms an arc structure, with the candlesticks continuously attacking and touching the arc surface. After reaching the highest point of 8.288U, it starts to slide down along the arc surface. Every rebound to the arc surface is an excellent opportunity to short and exit.
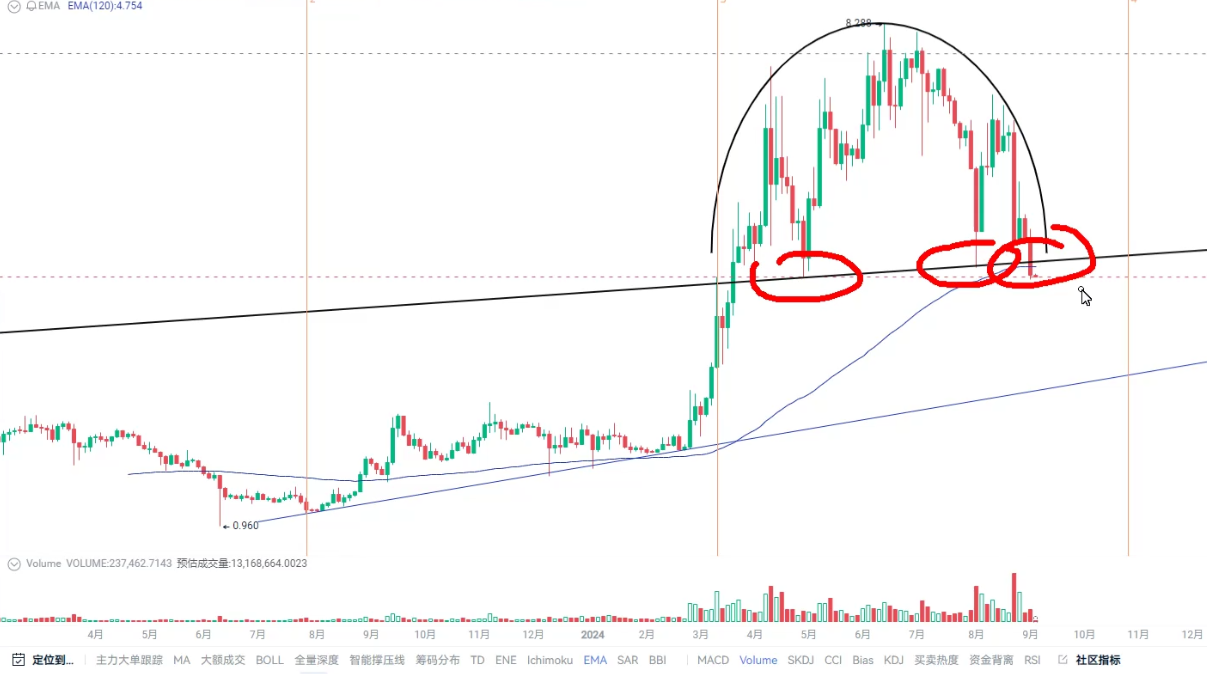
At the same time, TON's price has broken through the neckline of the positive arc and the 120-day moving average, making the price rebound neckline an opportunity to short. Of course, if the price recovers the neckline, we will need to reassess the judgment.
According to the target determination of the positive arc, connecting the previous low point with the nearest low point forms the extension line of the trend line, which is basically the downward target of TON, estimated to be around $3.2. From $4.6 to $3.2, the overall range is about 35%.
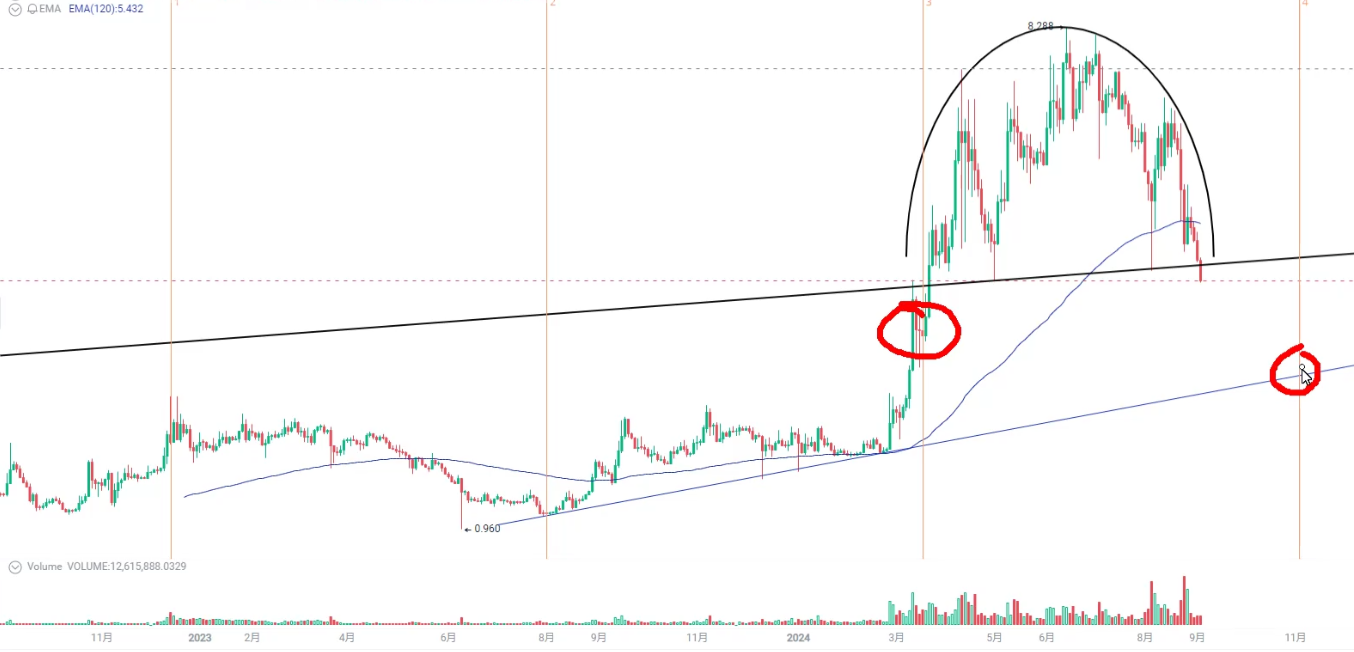
In addition, from the perspective of the timeline, since TON went online, after reaching a high point in April 2022, and then reaching a high point in December 2022, we can extend the key turning points using the equal cycle strategy, and find that the critical turning points appeared in July 2023 and March 2024.
If the previous four turning points can be effectively locked in, the next turning point is very likely to be correct, and it is expected to appear in November 2024. It is now early September, and there is less than two months until November, which is enough time to verify the analysis and judgment of TON.
免责声明:本文章仅代表作者个人观点,不代表本平台的立场和观点。本文章仅供信息分享,不构成对任何人的任何投资建议。用户与作者之间的任何争议,与本平台无关。如网页中刊载的文章或图片涉及侵权,请提供相关的权利证明和身份证明发送邮件到support@aicoin.com,本平台相关工作人员将会进行核查。


