Last night, the US Nasdaq index opened down more than 135 points and closed with a sharp drop of 3.26%! This drop basically indicates that the historical high point of 18671 set by the Nasdaq in July has become a phase high, and there will be a relatively large cleaning and callback in the future.
The Nasdaq index has experienced a magnificent bull market since the phase low of 10088 in October 22 years ago (7 months after the Fed started raising interest rates), and it reached a historical high of 18671 in July this year, with an increase of nearly 86% almost doubling!
The two biggest factors are:
First, the Fed's interest rate cuts have led to global capital flowing back to the United States, prompting major US stock indices including the Nasdaq to continuously set new historical highs.
The second is that several key component stocks in the Nasdaq, known as the "Seven Sisters" of the Nasdaq, have continued to speculate on the concept of AI, which has strengthened the strong.
However! There is no market that only rises and does not fall! Since July, after the US announced that the CPI and unemployment rate significantly exceeded expectations, especially the unemployment rate exceeded 4% for two consecutive months, the market has been worried that the US economy is about to enter a recession. The Fed's continuous talk of interest rate cuts has triggered a major correction in the US stock market.
Next, let's observe the current and future trends of the Nasdaq through the structure of the winding theory:

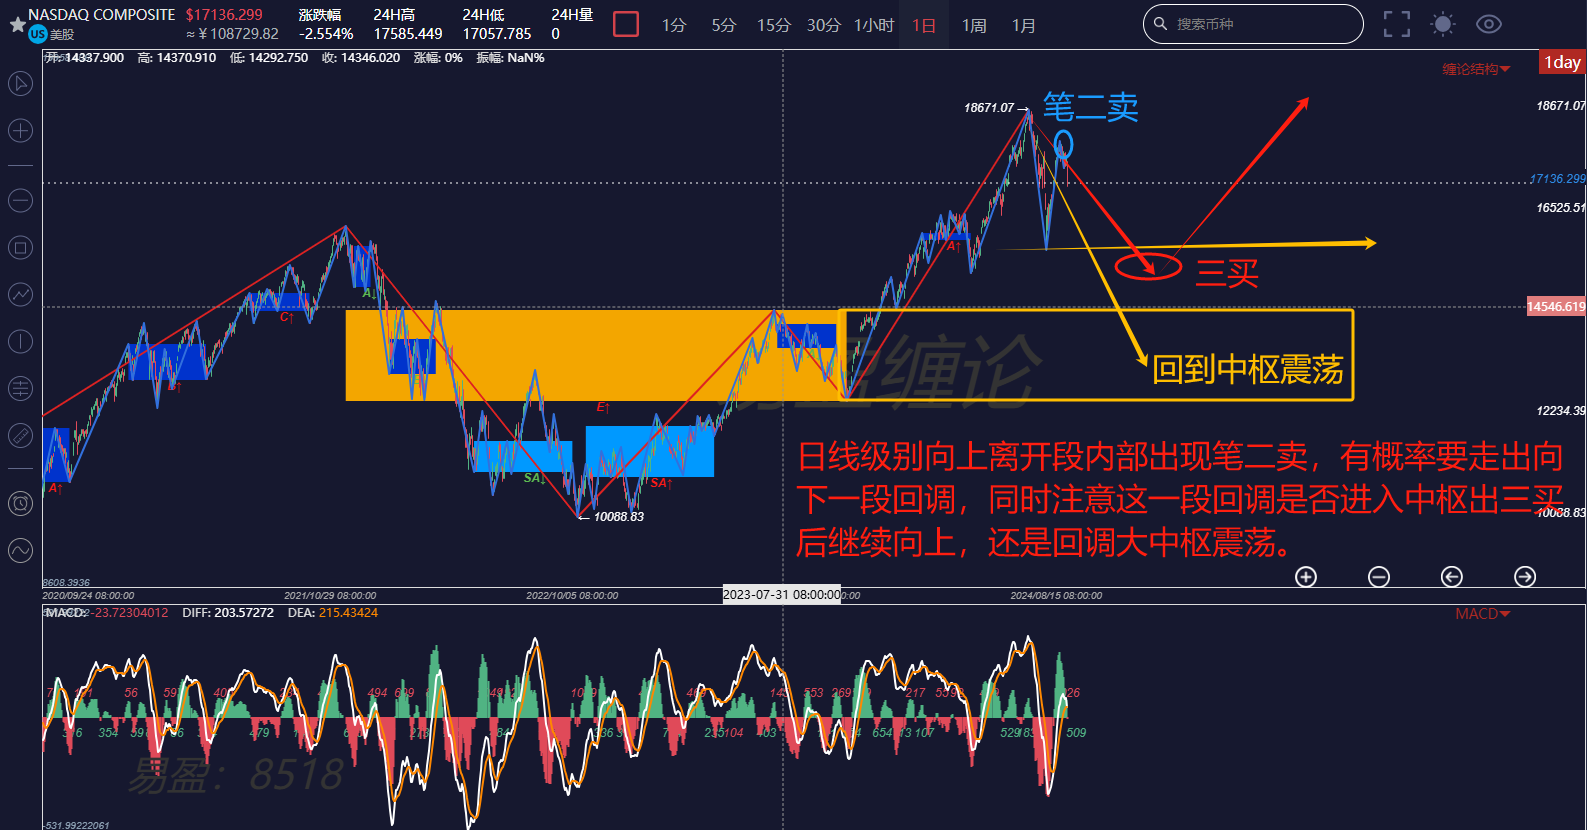
From the daily chart, it can be seen that the yellow central structure completed the central upward breakout after leaving the previous high point of 16212 and continued to extend upwards, setting new highs repeatedly, until it reached the historical high of 18671 on July 11. Under the influence of economic data leading to expectations of a recession, it started the first major callback to 15708. After that, the bulls attempted to rally and push the index back above 18000, but failed. This is a typical technique of raising prices to sell, with major institutions including Buffett continuously selling off. Structurally, the appearance of the second sell-off indicates that the bullish strength is exhausted, and there is a high probability of a downward trend at the daily level. Of course, this callback process will not happen all at once. There will definitely be repeated struggles between long and short positions, and institutions will continue to distribute chips at high levels.
From the perspective of the daily chart, it is expected to undergo a downward trend at the daily level, and there are two possibilities as shown in the chart: one is to rebound and fail to enter the central and then form a third buy, which is the strongest trend for the bulls! The second is the yellow trend, which will continue to decline to the central and continue the daily central oscillation, regaining strength. For trading strategies in the US stock market, it is recommended to reduce positions on rallies and not rush to bottom fish. Blindly bottom fishing may result in buying at the wrong time.
How will the significant correction of the Nasdaq affect the cryptocurrency market? This account believes that there will be an impact, but it will be short-term and not significant. On the contrary, some of the funds cashed out from the high levels of the US stock market will flow into the cryptocurrency market, especially the spot ETFs of BTC and ETH that have already been launched.
Returning to the cryptocurrency market, the large-scale structural trend was reinterpreted during the live broadcast last night, and it will not be discussed here.
Yesterday morning, BTC rebounded to a high of 59810, attempting to break through the 60000 mark, but it has been oscillating narrowly around 59000. In the evening, the Nasdaq opened significantly lower, directly bringing down the cryptocurrency market, and the current price is 57700. Judging from the magnitude of the pullback in the cryptocurrency market, it is not too significant, and it has not even fallen below the previous low of 57126.

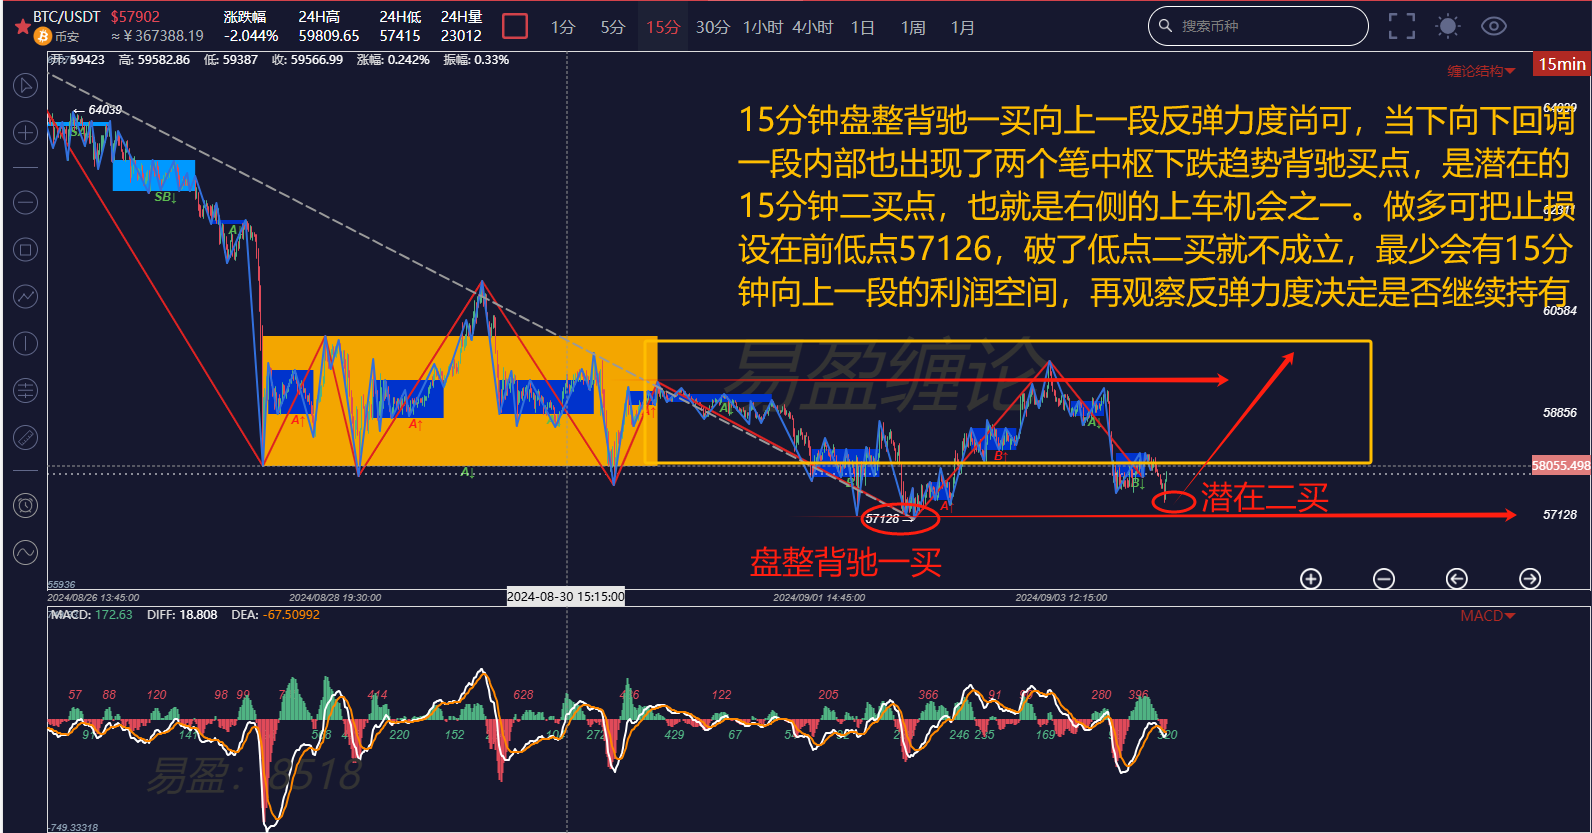
Let's directly look at the 15-minute chart. In the article "Patiently Waiting" on Monday morning, it clearly pointed out the opportunity to patiently wait for the right side of the second buy at the 15-minute level. The opportunity is now emerging, which is a potential second buy opportunity on the right side, with the previous low of 57126 as the stop-loss point. The expectation is at least a segment upward at the 15-minute level. In the downward segment, the trend of the two pens is back-charging, and the structure is full, making the risk-reward ratio very appropriate for a small bet to win big.
The above analysis is for reference only and does not constitute any investment advice!
If you are interested in the winding theory and want to obtain learning materials for free, watch public live broadcasts, participate in offline training camps for the winding theory, improve your trading skills, and build your own trading system to achieve stable profitability, and use the winding theory to timely escape the peak and bottom fish, you can scan the code to follow the following public account and add the WeChat of this account for more information!

免责声明:本文章仅代表作者个人观点,不代表本平台的立场和观点。本文章仅供信息分享,不构成对任何人的任何投资建议。用户与作者之间的任何争议,与本平台无关。如网页中刊载的文章或图片涉及侵权,请提供相关的权利证明和身份证明发送邮件到support@aicoin.com,本平台相关工作人员将会进行核查。


