On the afternoon of August 29th, AICoin researchers conducted a live graphic and text sharing session titled "Suitable Left-side Trading Signals for the Pre-rate Cut Period (with Membership Giveaway, OKX Peripheral)" in the AICoin PC-end - Group Chat - Live. Here is a summary of the live content.
As we all know, the rate cut is coming soon! Therefore, in this live session, the AICoin Research Institute recommended various ways to engage in left-side trading, including but not limited to: indicator signals, trading techniques, and finding high-quality coins.
I. Divergence Signal - MACD Divergence
The AICoin Research Institute suggests paying attention to divergence signals across different timeframes. The approach is to follow the major trend, counter the minor trend, and look for breakthroughs. Therefore, it is recommended to pay attention to divergence across three timeframes, such as: daily - 4-hour - 30-minute, or: 4-hour - 30-hour - 5-minute.
By opening the OKX-BTCUSDT candlestick chart, you can observe the divergence signal:
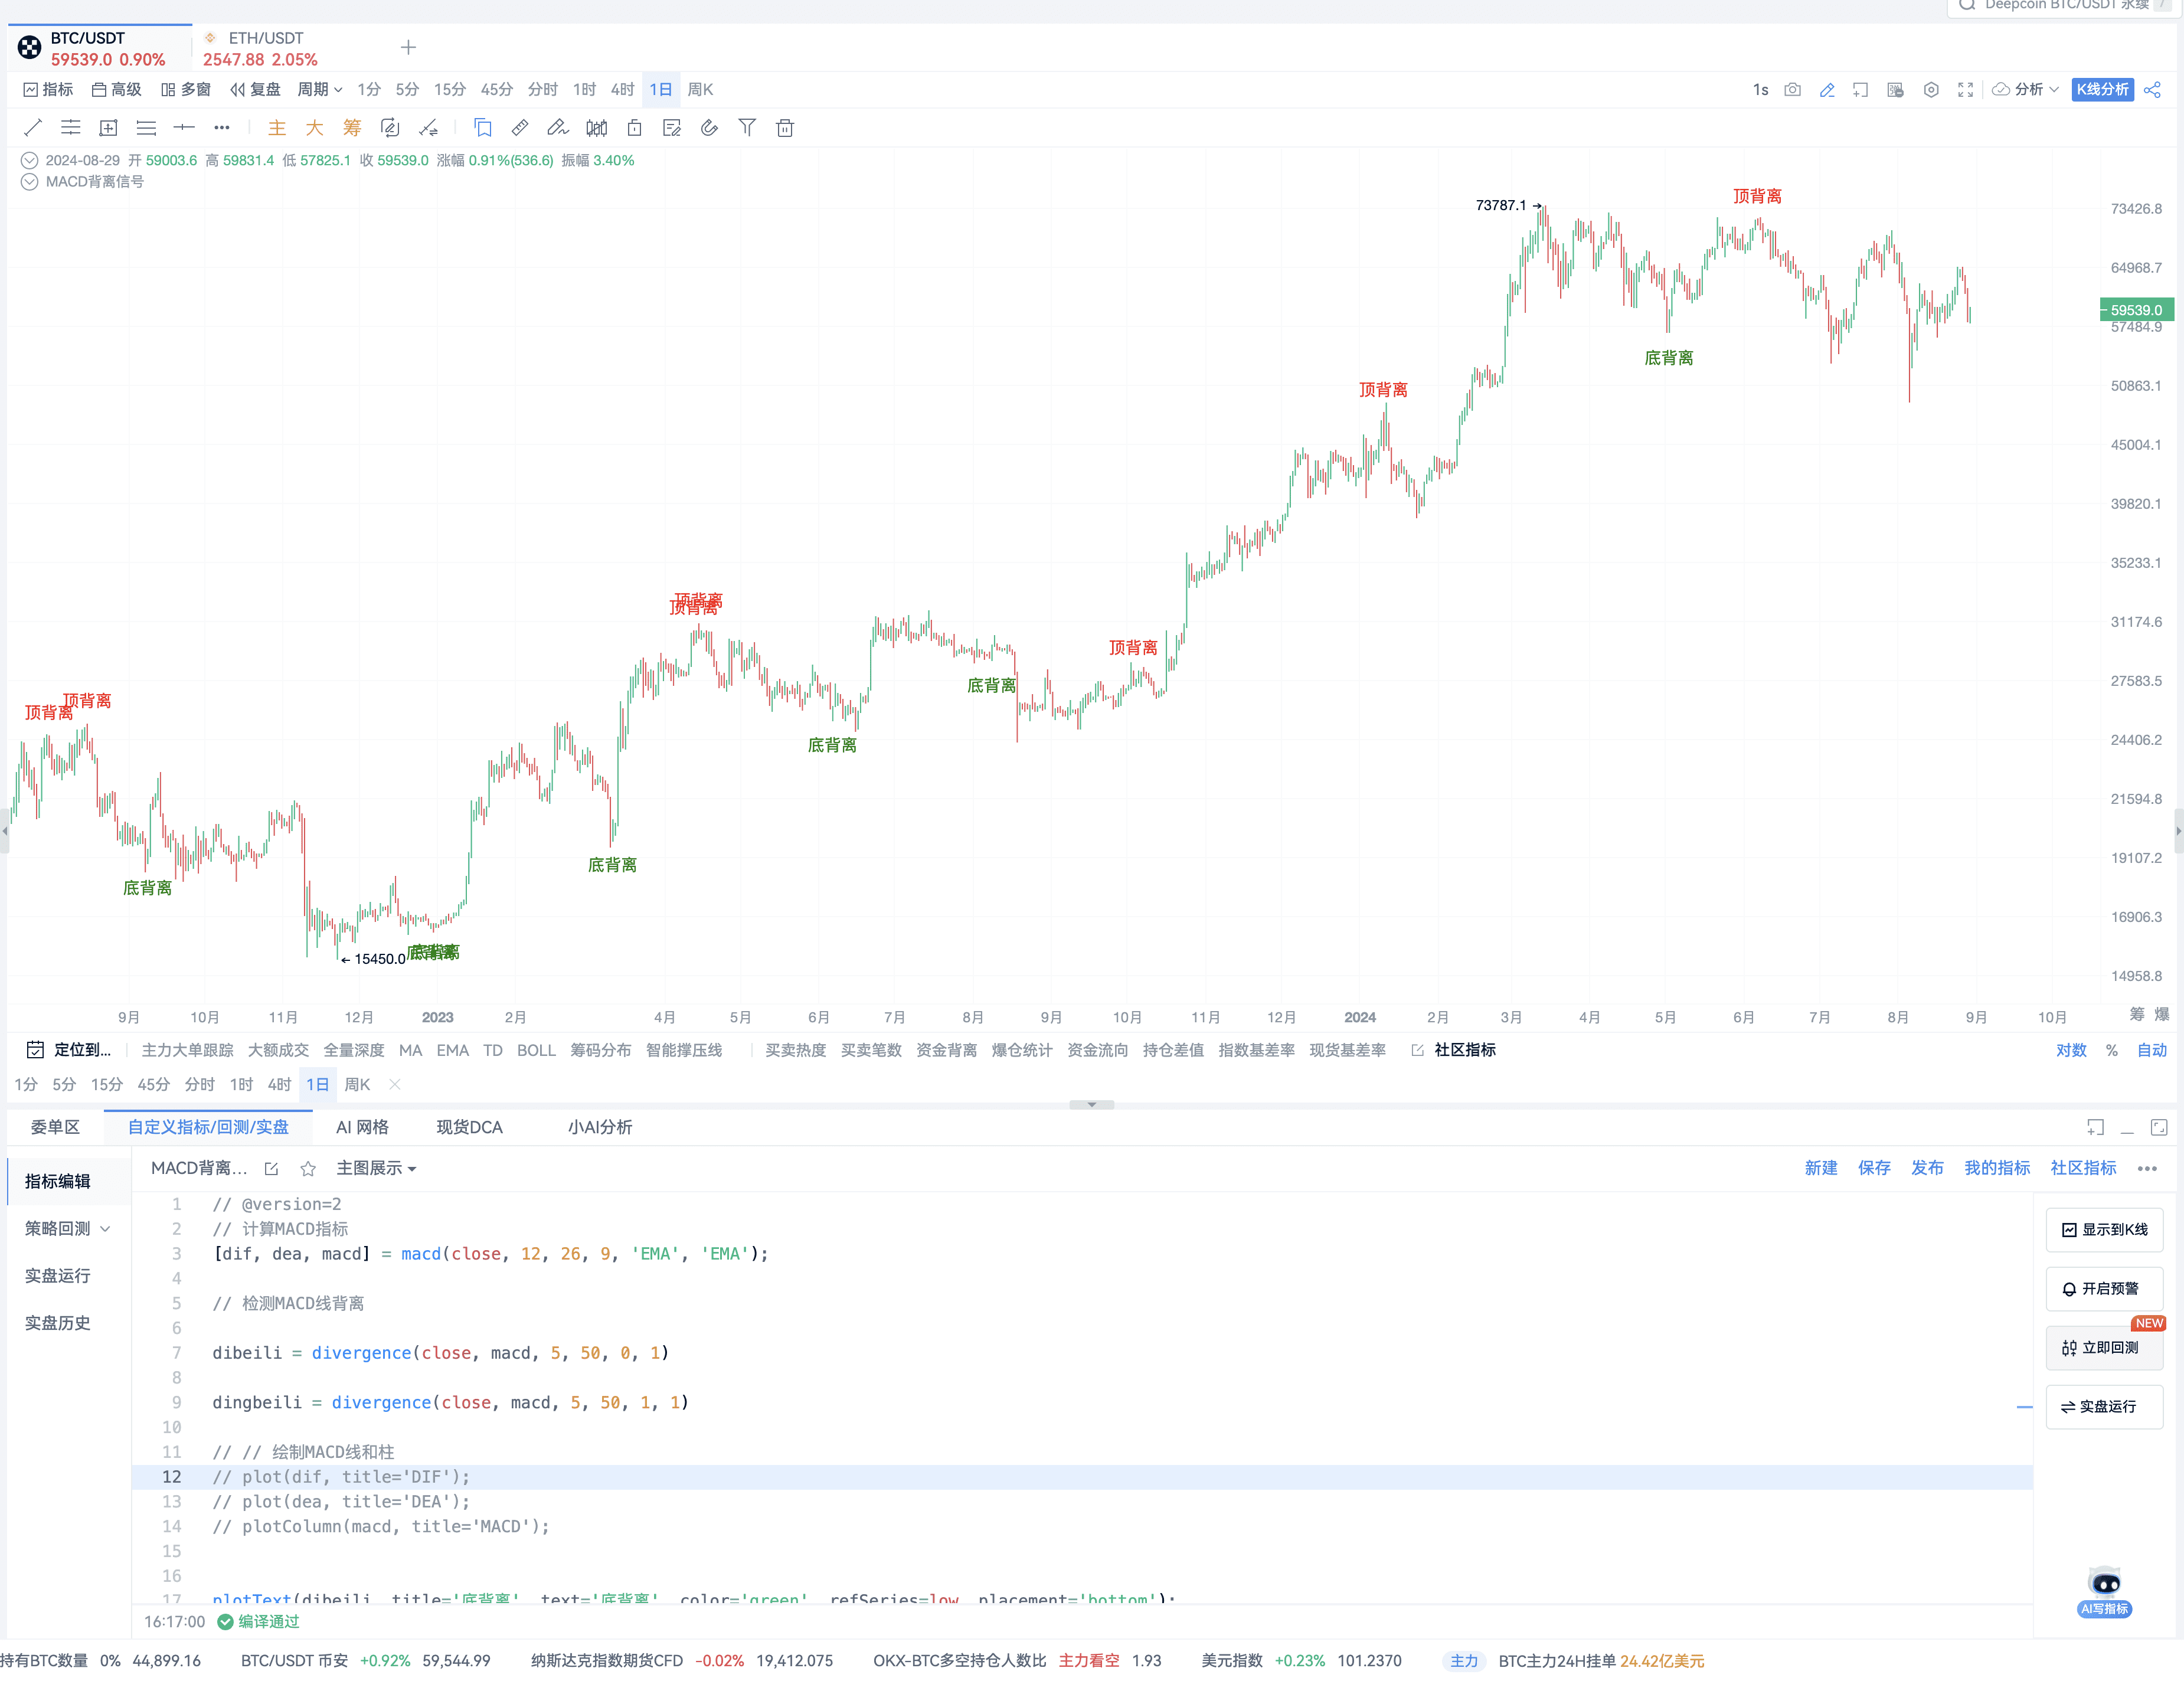
If the trend emerges, the bottom divergence signal will definitely be the first to appear.
Here is the backtesting effect of a single timeframe:
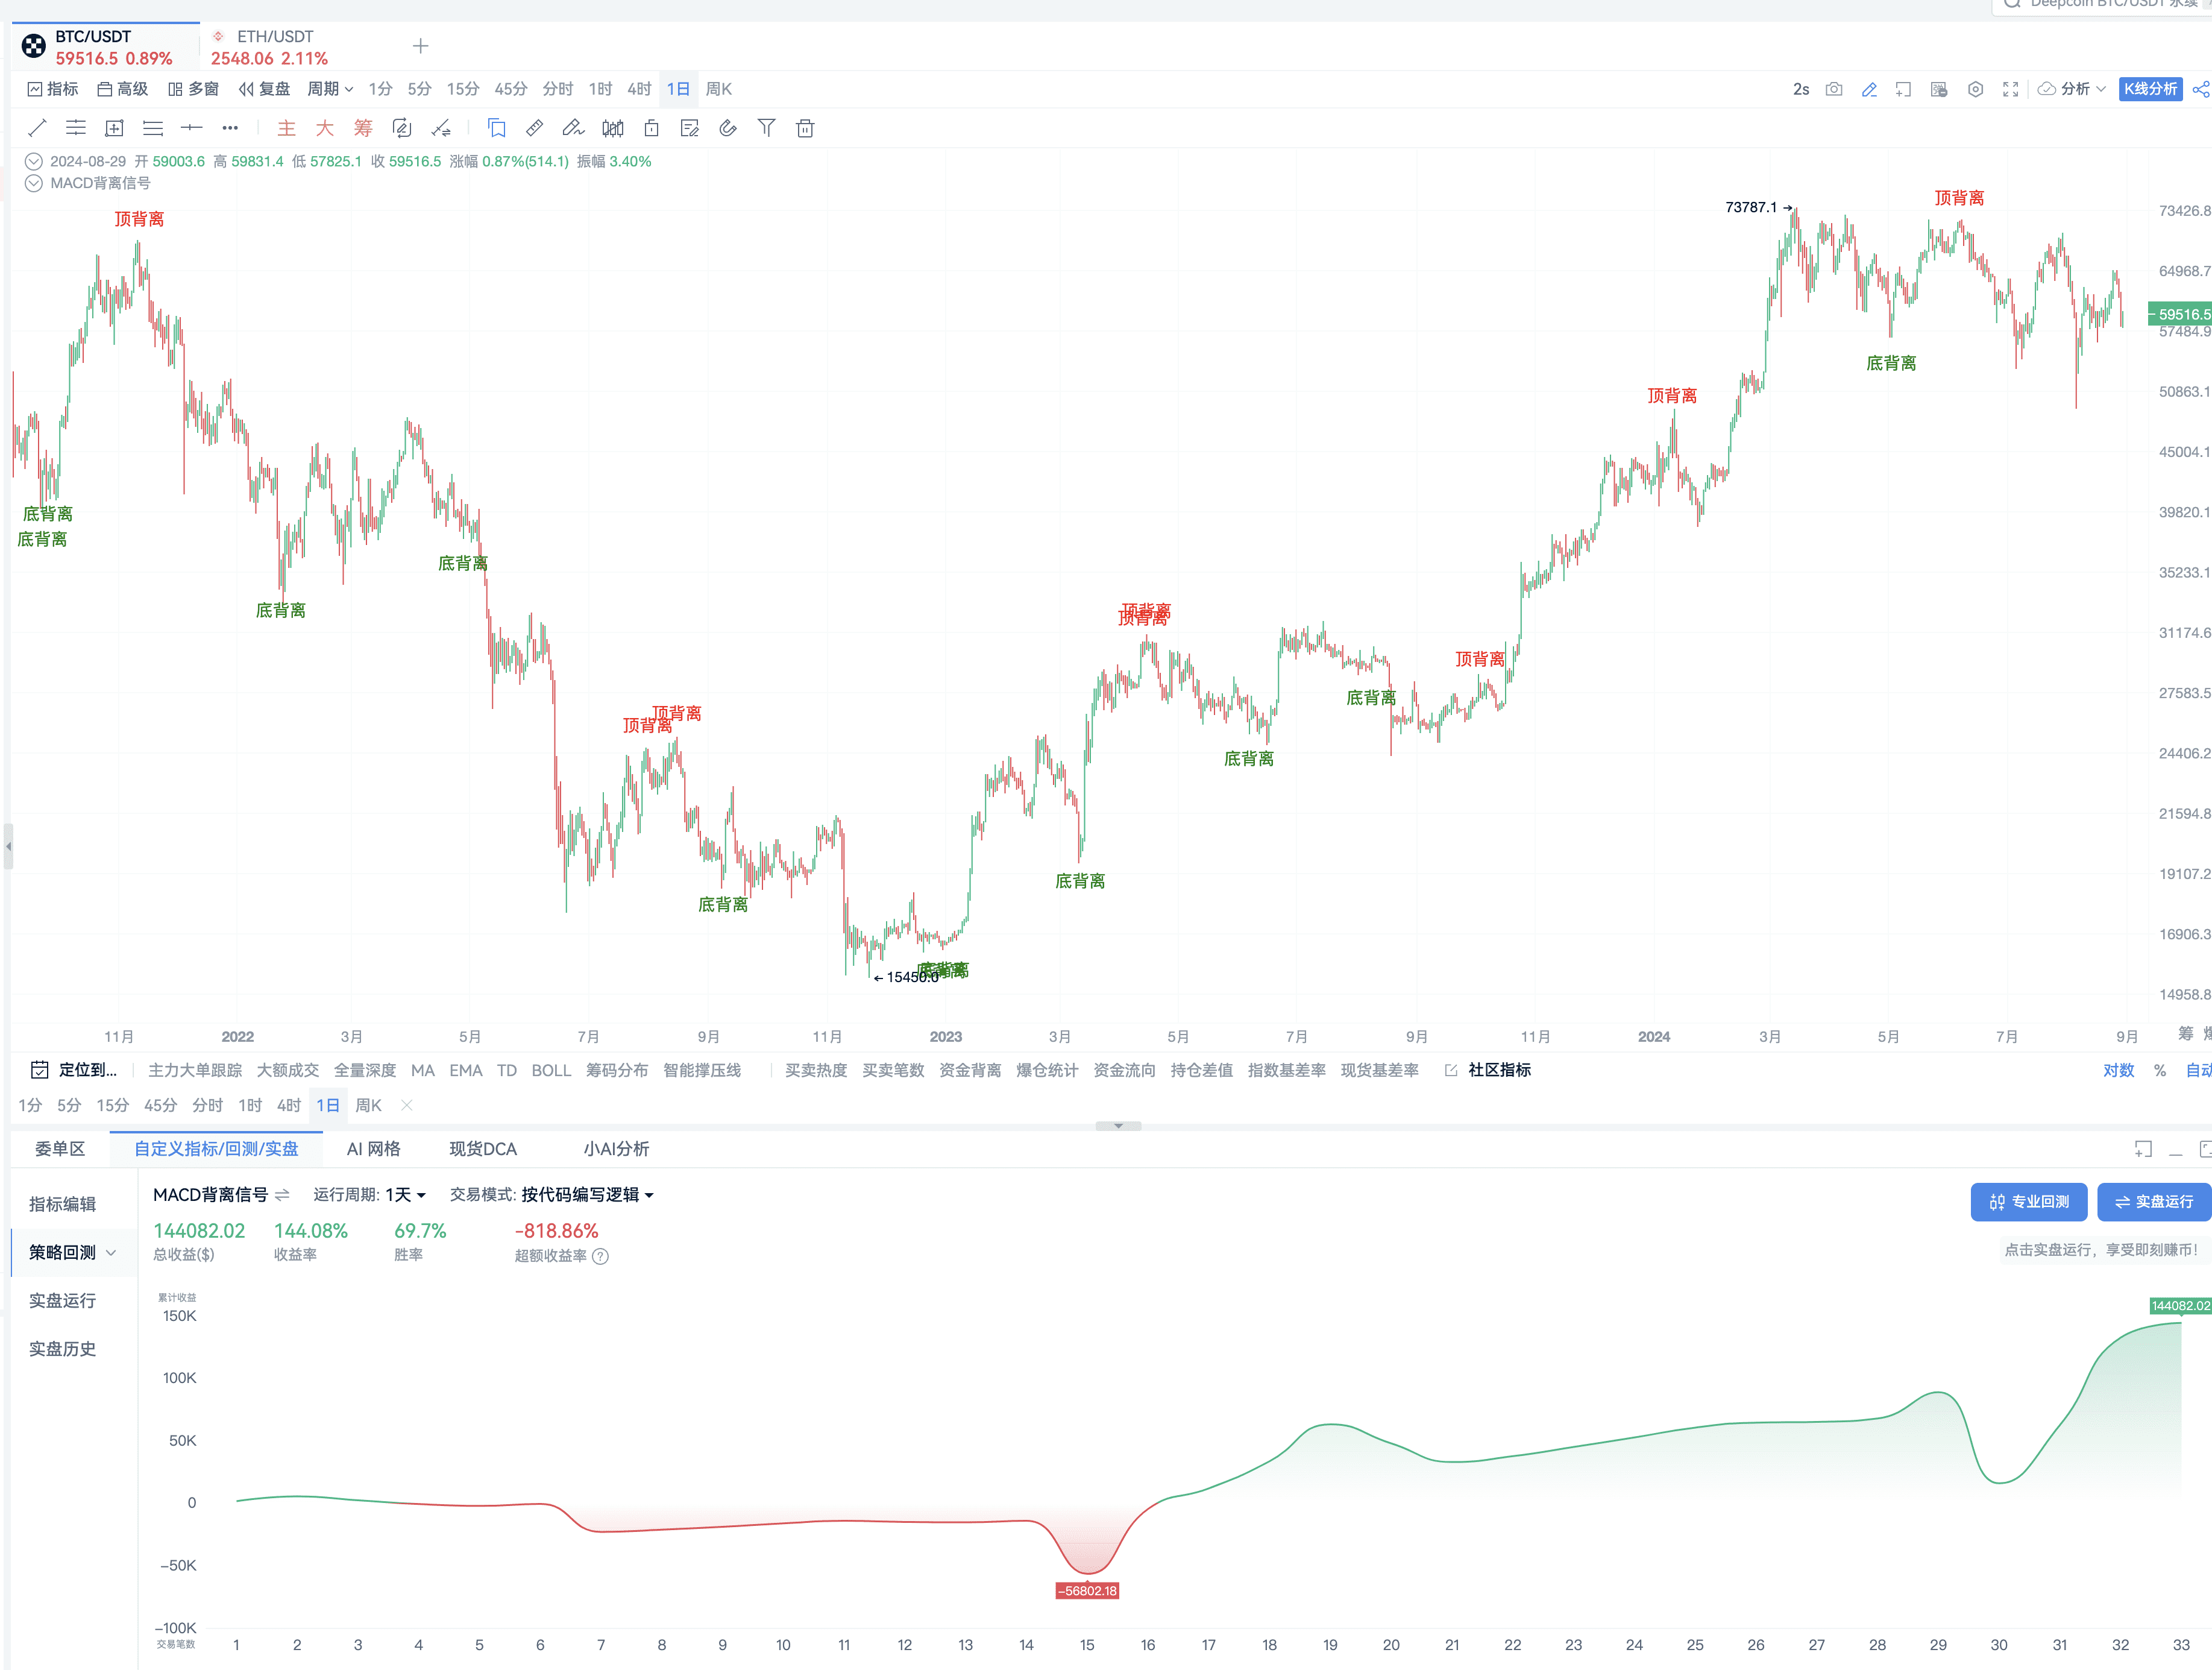
However, the institute recommends observing divergence across multiple timeframes, which is equivalent to having a super-duper divergence. Look for breakthroughs in smaller timeframes and establish trends in larger timeframes.
For those who may not be familiar with reading major single orders, the institute recommends using the simplest indicator to measure whether smart money has entered - the divergence signal.
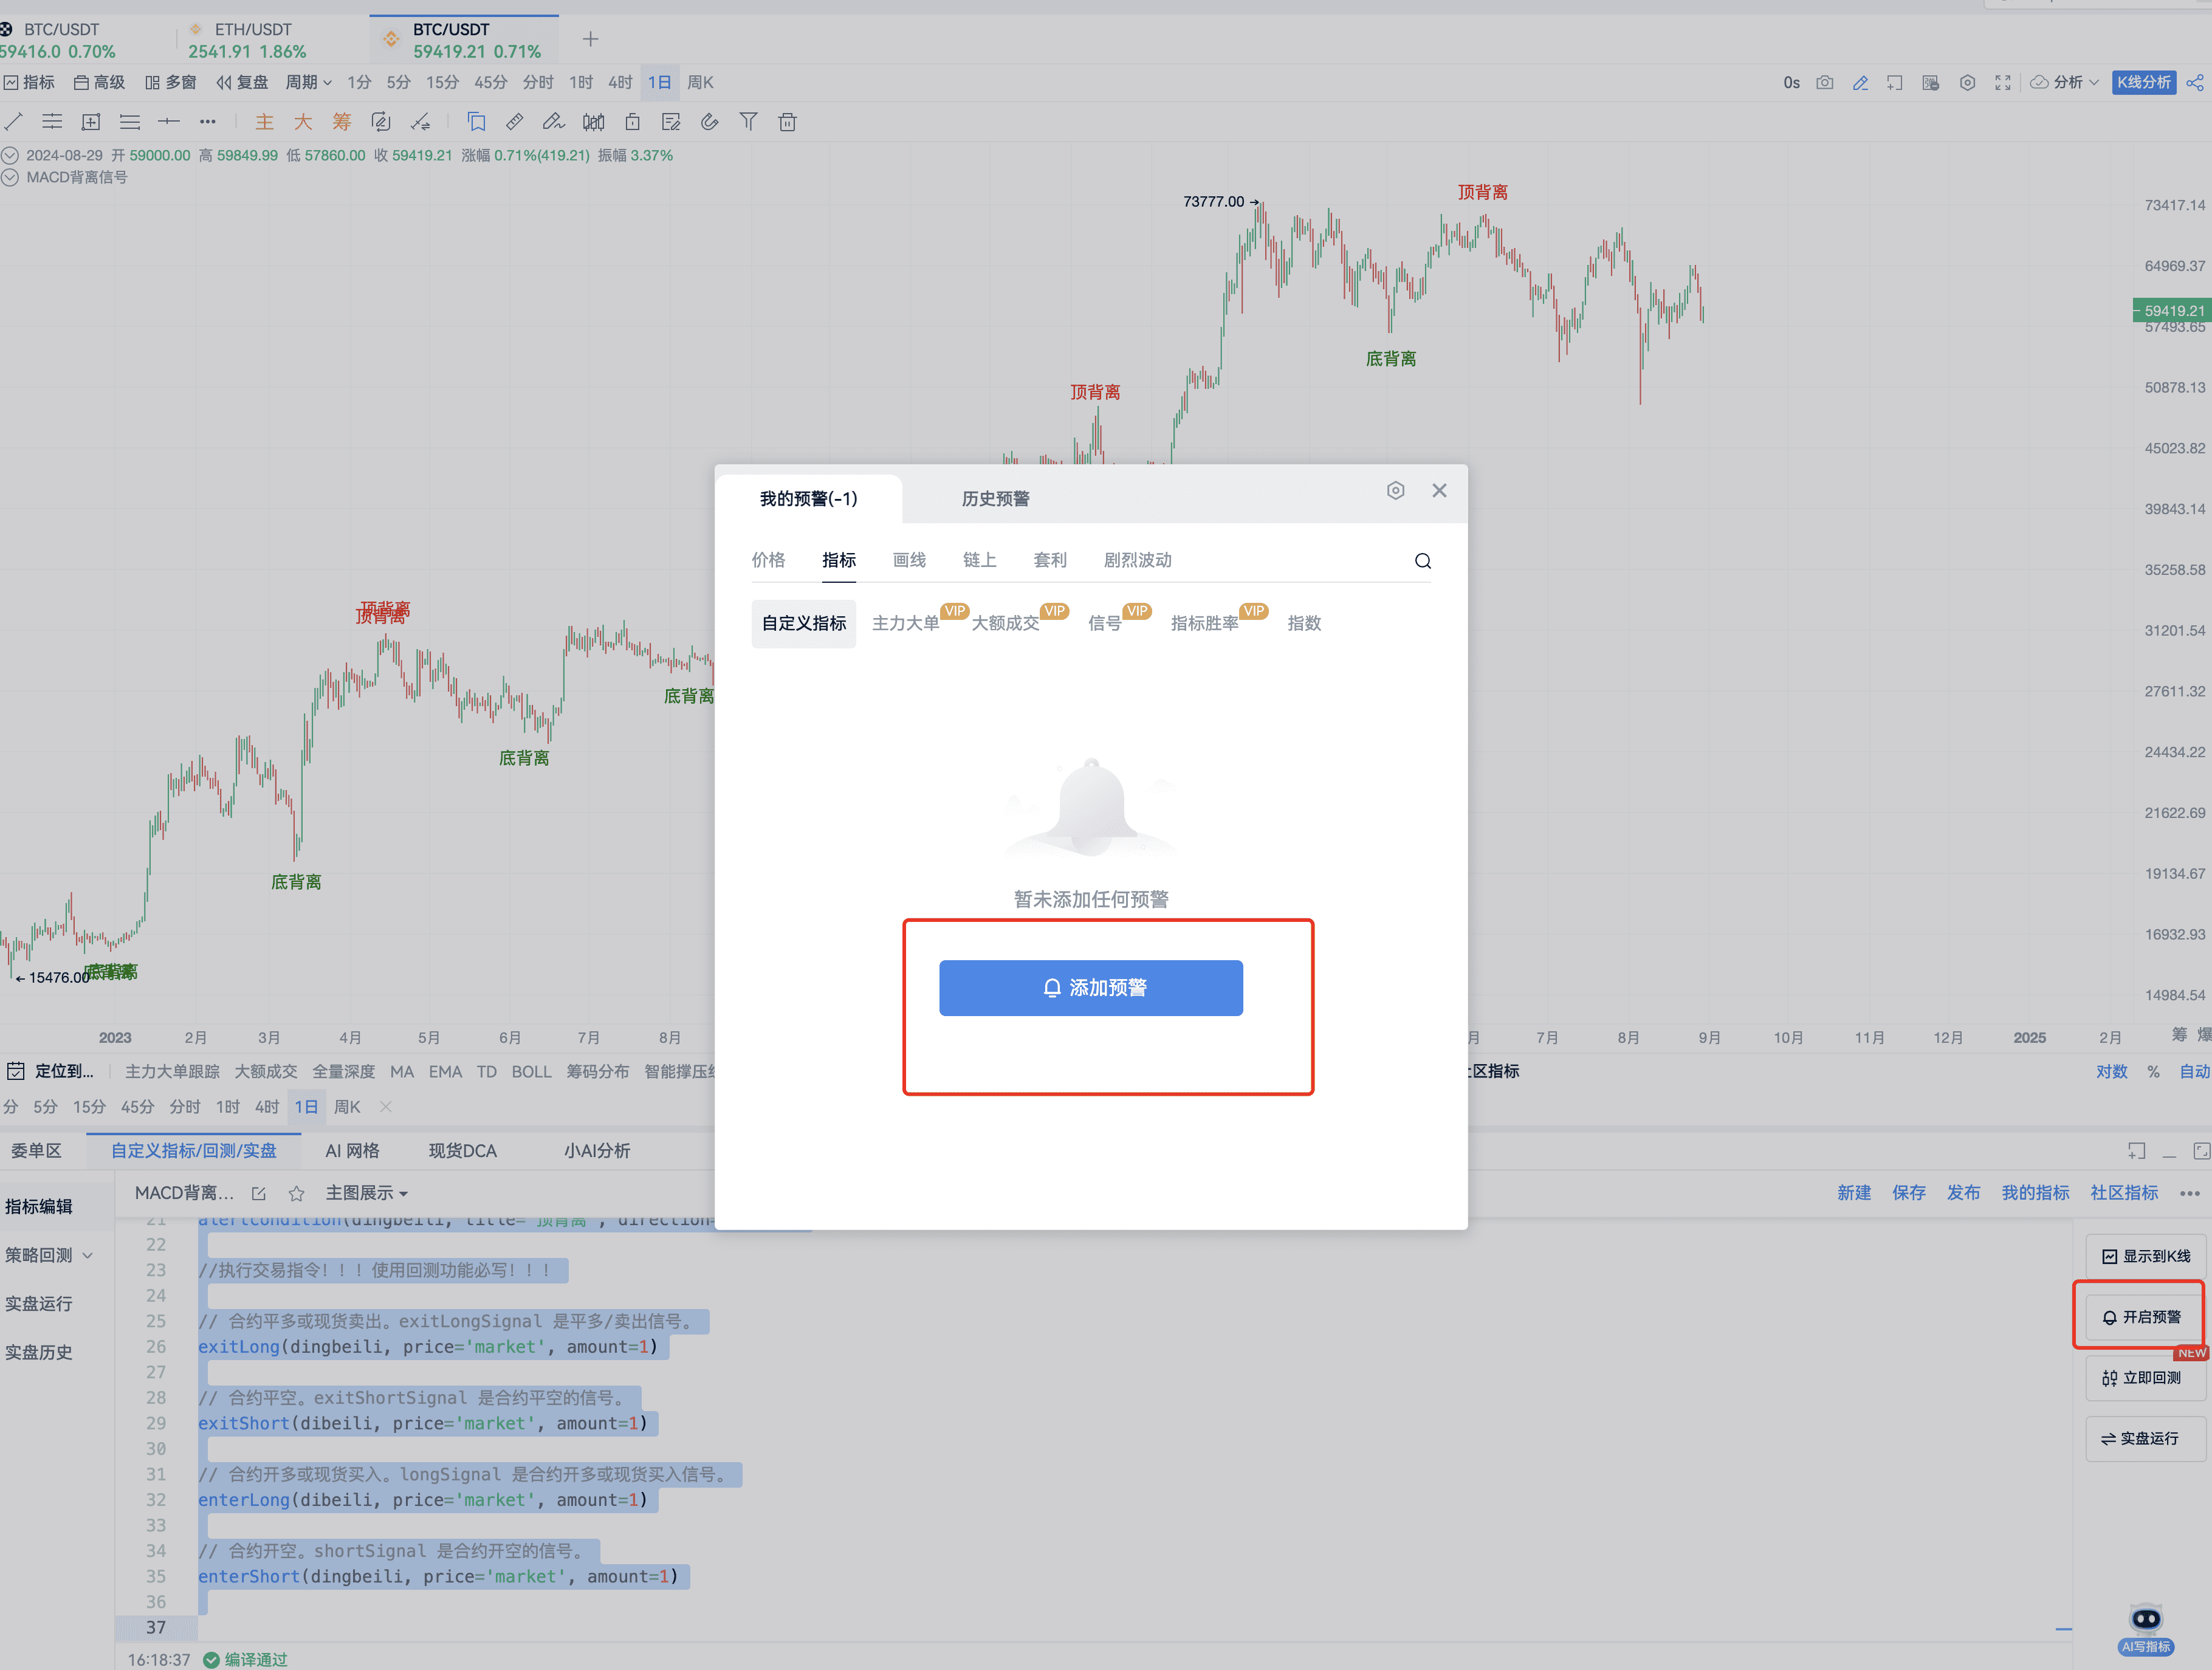
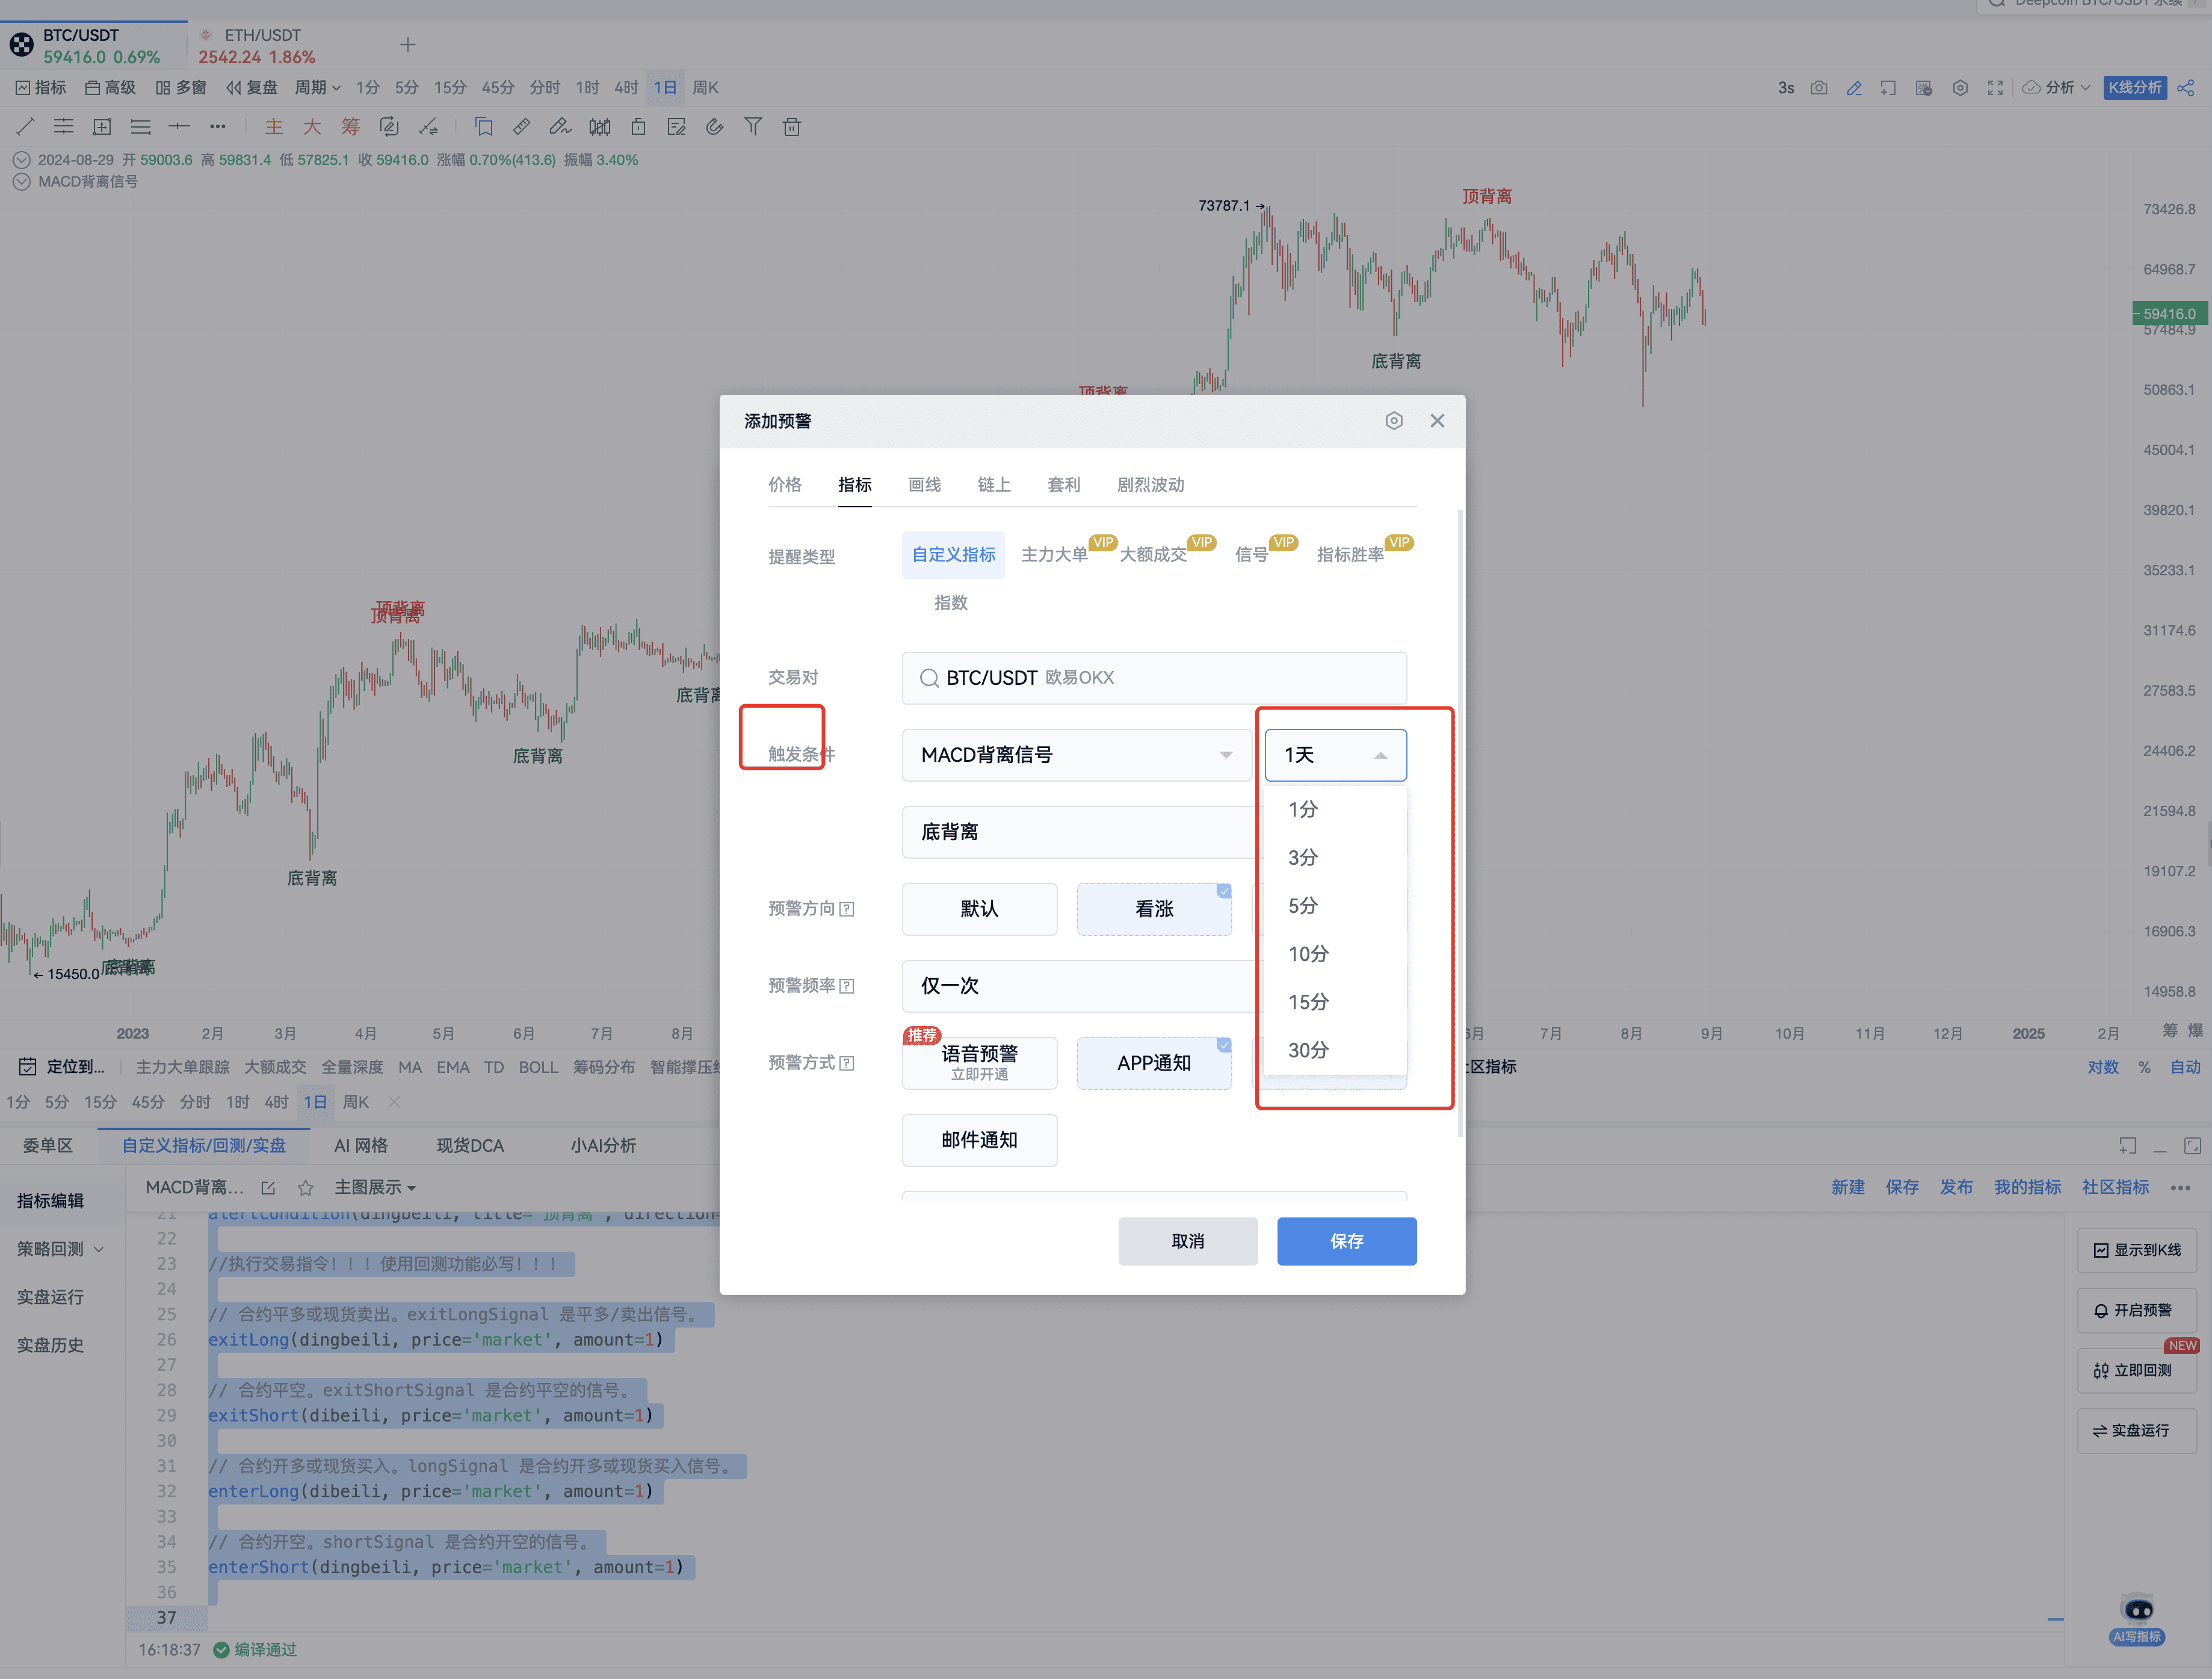
After obtaining the indicator, the next step is to immediately save it as a custom indicator and set up alerts! Wait for the system to send you a signal!! When there's a signal, immediately open AICoin and go to OKX for trading!
Here is the core source code for the custom indicator:
// @version=2
// Calculate MACD indicator
[dif, dea, macd] = macd(close, 12, 26, 9, 'EMA', 'EMA');
// Detect MACD line divergence
dibeili = divergence(close, macd, 5, 50, 0, 1)
dingbeili = divergence(close, macd, 5, 50, 1, 1)
// // Draw MACD line and columns
// plot(dif, title='DIF');
// plot(dea, title='DEA');
// plotColumn(macd, title='MACD');
plotText(dibeili, title='Bottom Divergence', text='Bottom Divergence', color='green', refSeries=low, placement='bottom');
plotText(dingbeili, title='Top Divergence', text='Top Divergence', color='red', refSeries=high, placement='top');
alertcondition(dibeili, title='Bottom Divergence', direction='buy');
alertcondition(dingbeili, title='Top Divergence', direction='sell');
// Execute trading instructions!!! Must be written for backtesting!!!
// Close long position for futures or sell spot. exitLongSignal is the signal to close long/sell.
exitLong(dingbeili, price='market', amount=1)
// Close short position for futures. exitShortSignal is the signal to close short for futures.
exitShort(dibeili, price='market', amount=1)
// Open long position for futures or buy spot. longSignal is the signal to open long position or buy spot.
enterLong(dibeili, price='market', amount=1)
// Open short position for futures. shortSignal is the signal to open short position for futures.
enterShort(dingbeili, price='market', amount=1)
Alerts click here:
You can select the timeframe you want
After the live session, the institute integrated the divergence signal indicator and recommended it to the community for everyone to choose!
II. TD Signal
Let's take a look at the TD bottom-fishing signal and its performance on OKX's BTC:
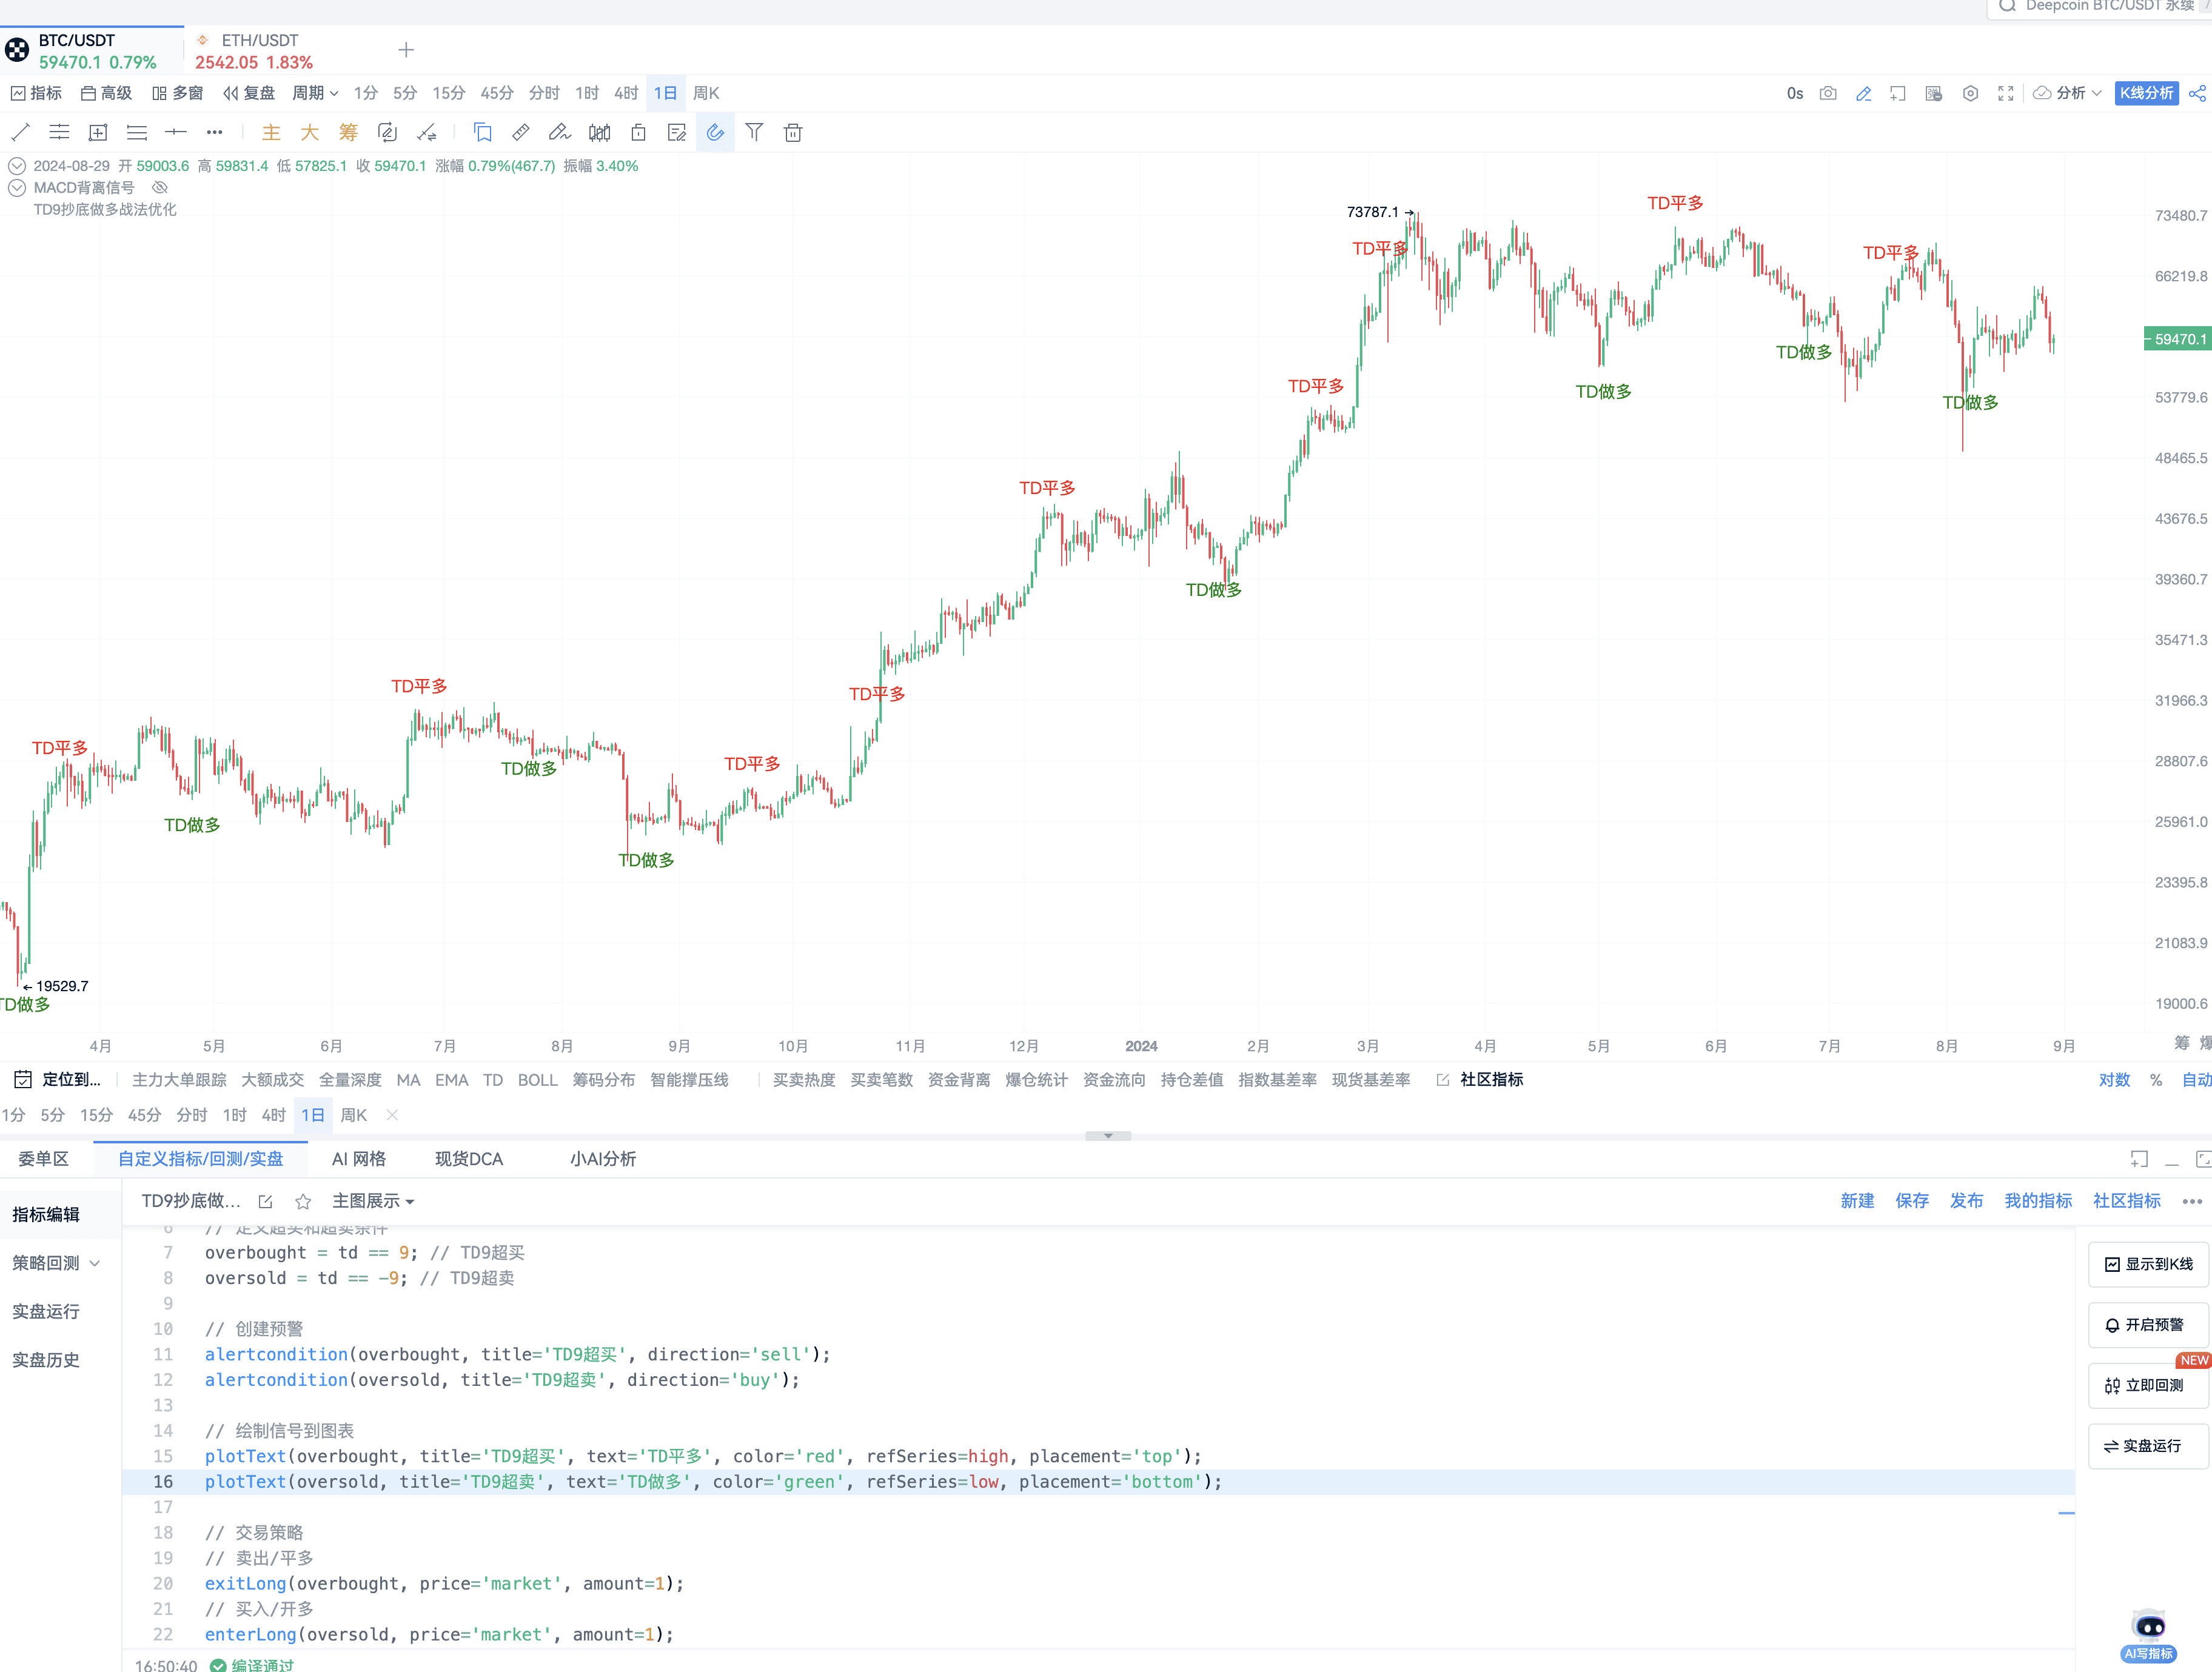
In fact, the TD signal is very suitable for oscillating and upward-trending markets. The core of TD is that when there's been too much decline, there will be a reversal, and when there's been too much rise, there will be a pullback, so I've written it as overbought and oversold. TD9 is enough, even more left.
Here is the strategy shared with everyone:
// @version=2
// Calculate TD signal
[td] = td(close);
// Define overbought and oversold conditions
overbought = td == 9; // TD9 overbought
oversold = td == -9; // TD9 oversold
// Create alerts
alertcondition(overbought, title='TD9 overbought', direction='sell');
alertcondition(oversold, title='TD9 oversold', direction='buy');
// Plot signals on the chart
plotText(overbought, title='TD9 overbought', text='TD close long', color='red', refSeries=high, placement='top');
plotText(oversold, title='TD9 oversold', text='TD long', color='green', refSeries=low, placement='bottom');
// Trading strategy
// Sell/close long
exitLong(overbought, price='market', amount=1);
// Buy/open long
enterLong(oversold, price='market', amount=1);
No need to say much about TD, it's simple and intuitive!
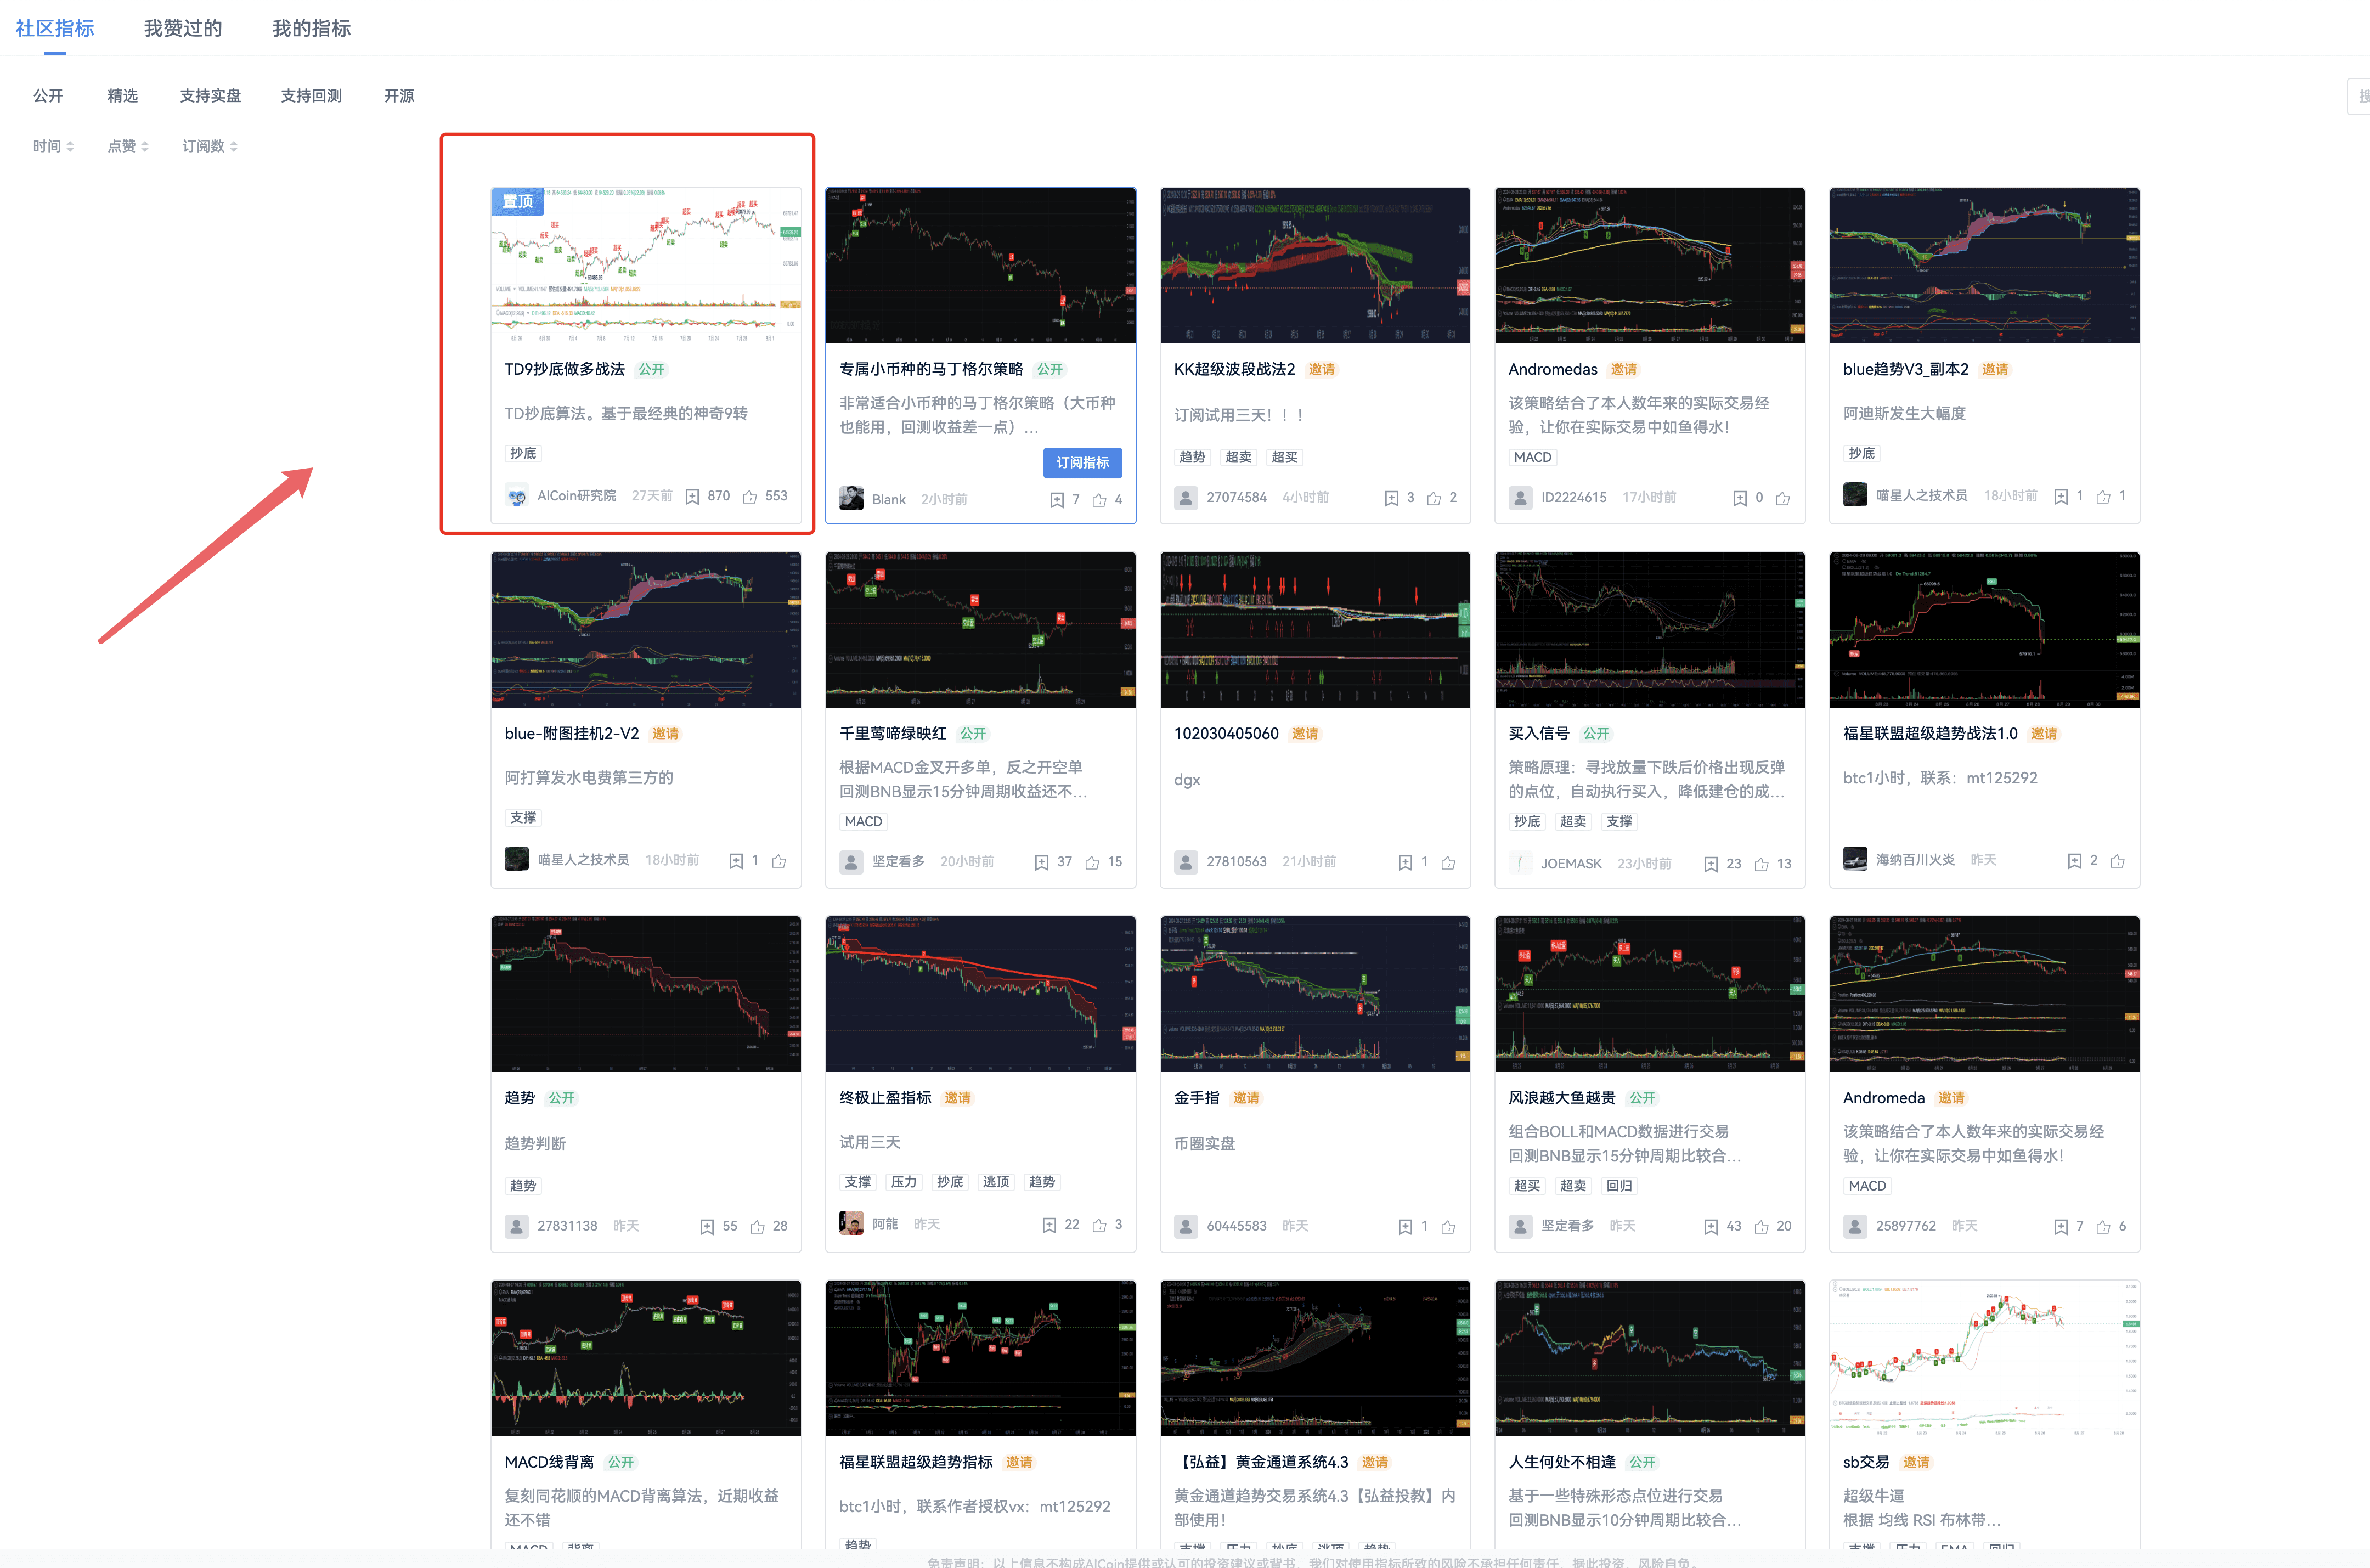
Everyone can subscribe to the TD indicator strategy uploaded by the institute in the indicator community. Nearly 1000 people have already subscribed, it seems that many people favor TD. TD is very suitable for bottom-fishing. If you are the type to chase rises and fall, and want to go against human nature, TD is very suitable for you.
That's all the content of this live session. Building and perfecting your own trading system is a key factor in successful investment. We hope that every AICoin user can find a suitable indicator strategy and have a rolling source of wealth!
Recommended Reading
For more live session content, please follow AICoin's "News/Information - Live Review" section, and feel free to download AICoin PC-end
免责声明:本文章仅代表作者个人观点,不代表本平台的立场和观点。本文章仅供信息分享,不构成对任何人的任何投资建议。用户与作者之间的任何争议,与本平台无关。如网页中刊载的文章或图片涉及侵权,请提供相关的权利证明和身份证明发送邮件到support@aicoin.com,本平台相关工作人员将会进行核查。


