On the afternoon of July 29th, AICoin researchers conducted a live graphic and textual sharing session titled "Detailed Explanation of Bollinger Bands Practical Techniques, Mastering the Overall Trend (Free Membership)" in the AICoin PC-end - Group Chat - Live. Below is a summary of the live content.
I. Overview of Bollinger Bands
Bollinger Bands, also known as BOLL indicators, are based on the principle of normal distribution in statistics, used to estimate the difference between prices and average prices, and are an important tool for analyzing market trend movements.
You can find the BOLL indicator in AICoin's indicator library—the third one—and then execute the operation [display on the candlestick chart].
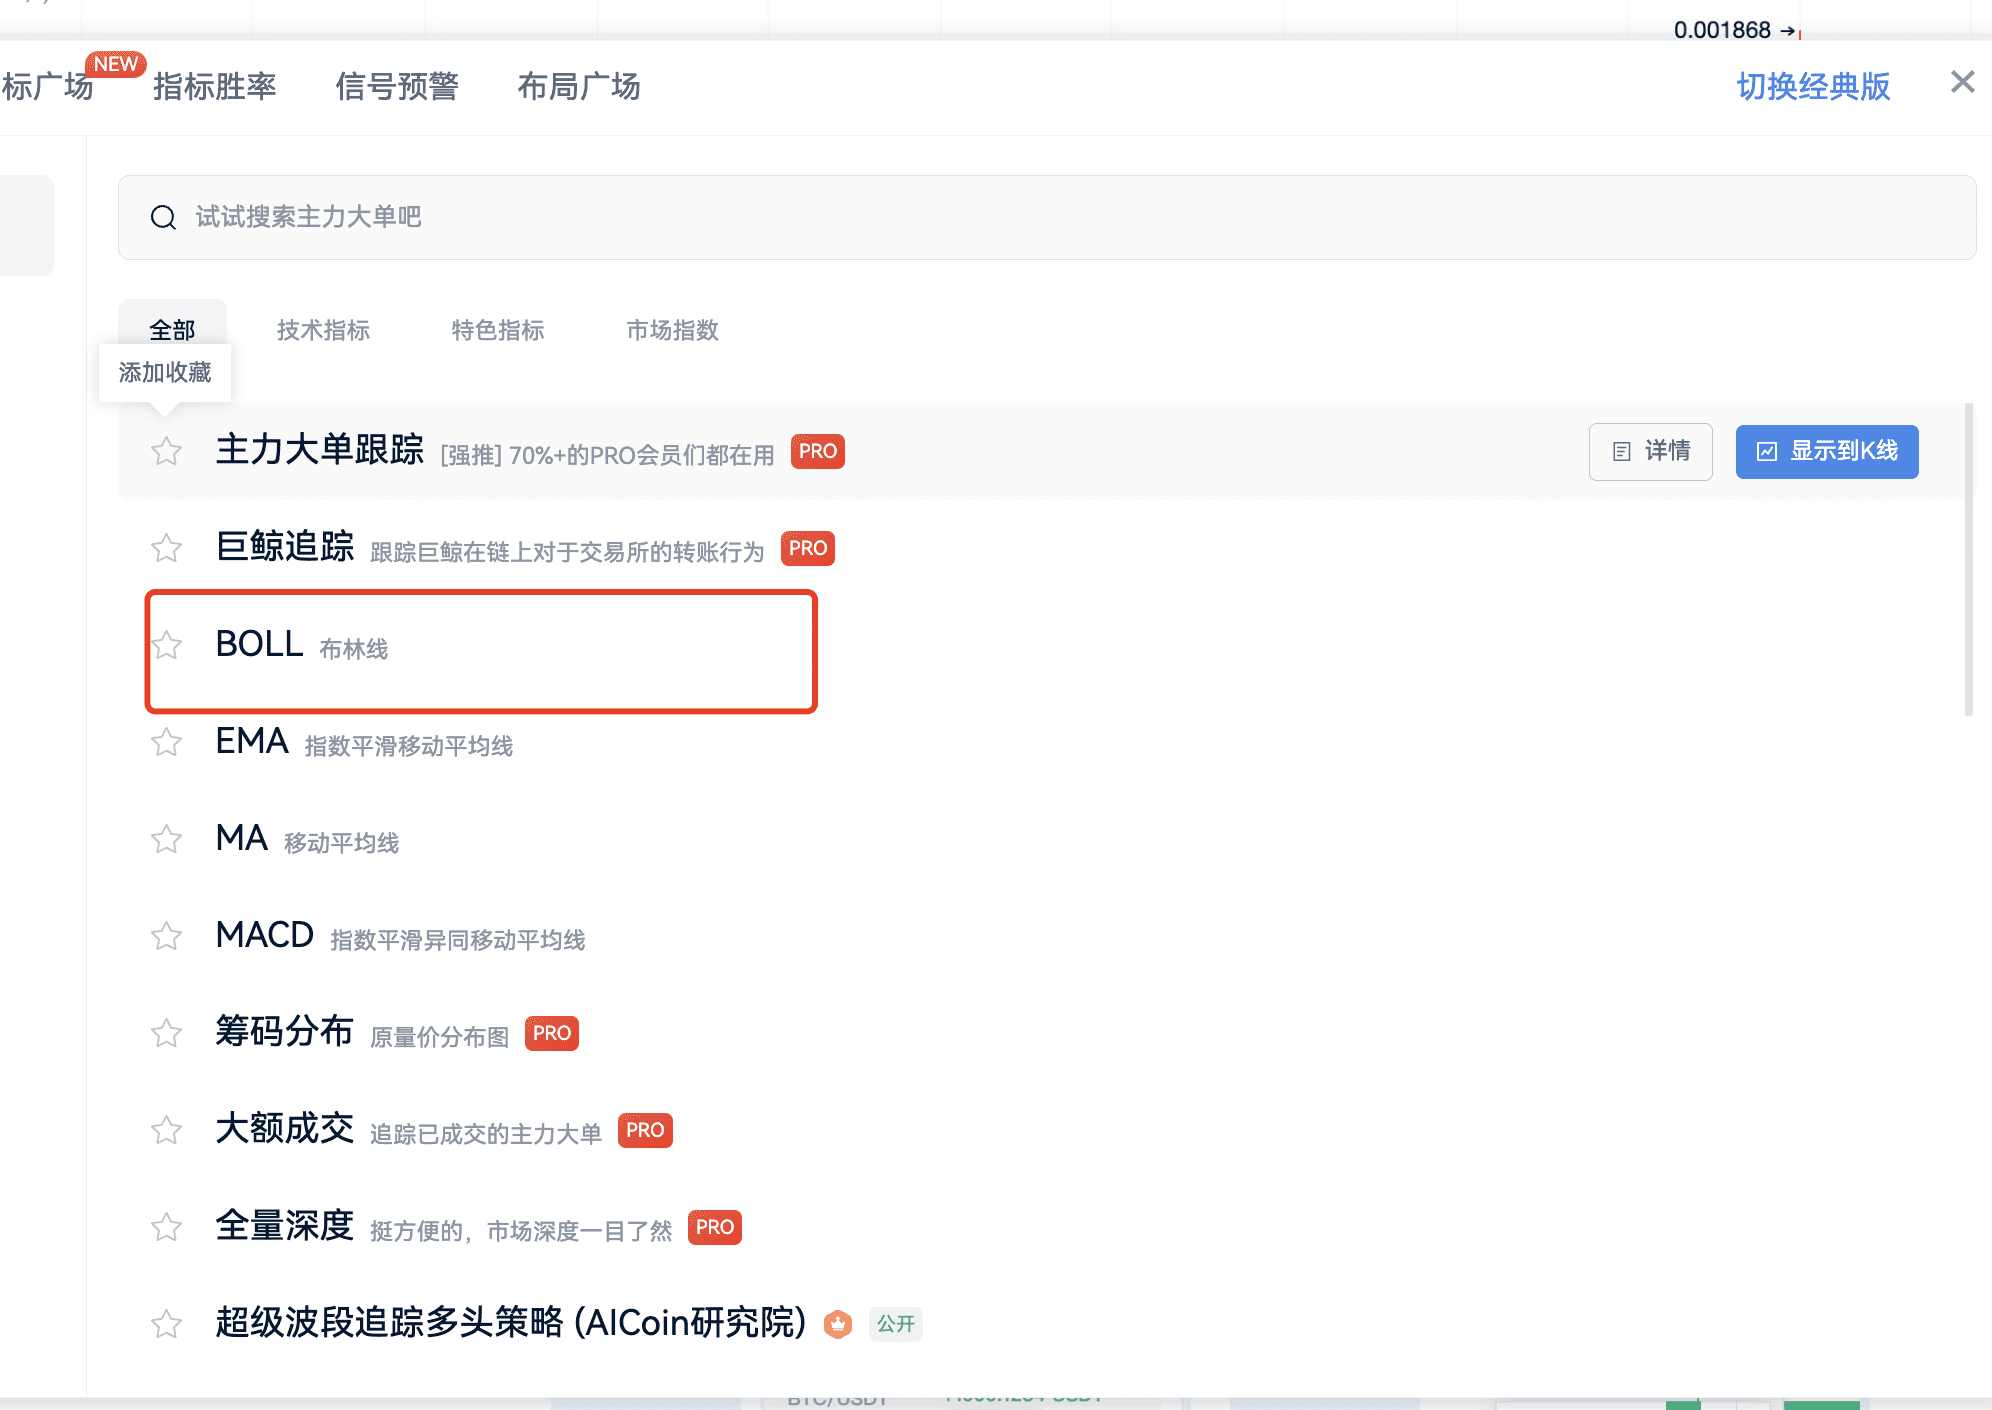
The reason why BOLL is placed third in the indicator library is self-evident.
This is a free indicator. If you want to view special periods and customize the BOLL indicator, you can place an order for PRO membership (63U) in the live room.
Bollinger Bands include upper band, middle band, and lower band, with the middle band usually being the 20-day moving average, and the upper and lower bands being the range of 2 times the standard deviation of the middle band, forming a "channel" for price movement.
Let's look at the chart directly.
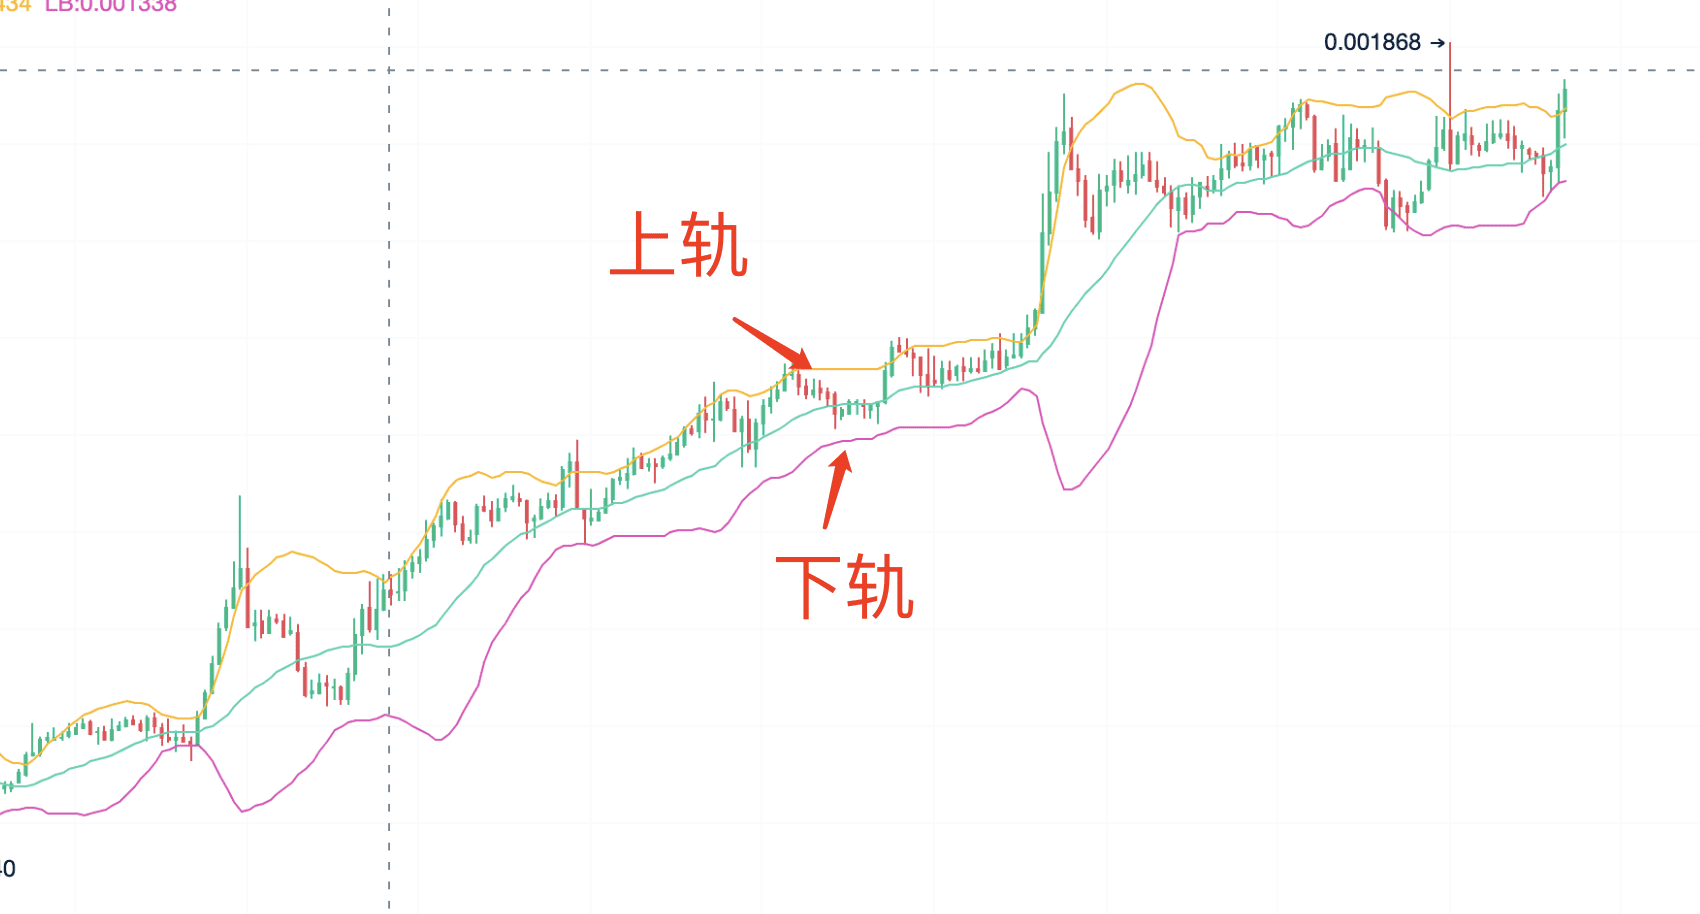
The line above is the upper band, the middle one is the middle band, and the line below is the lower band.
Parameter Meanings
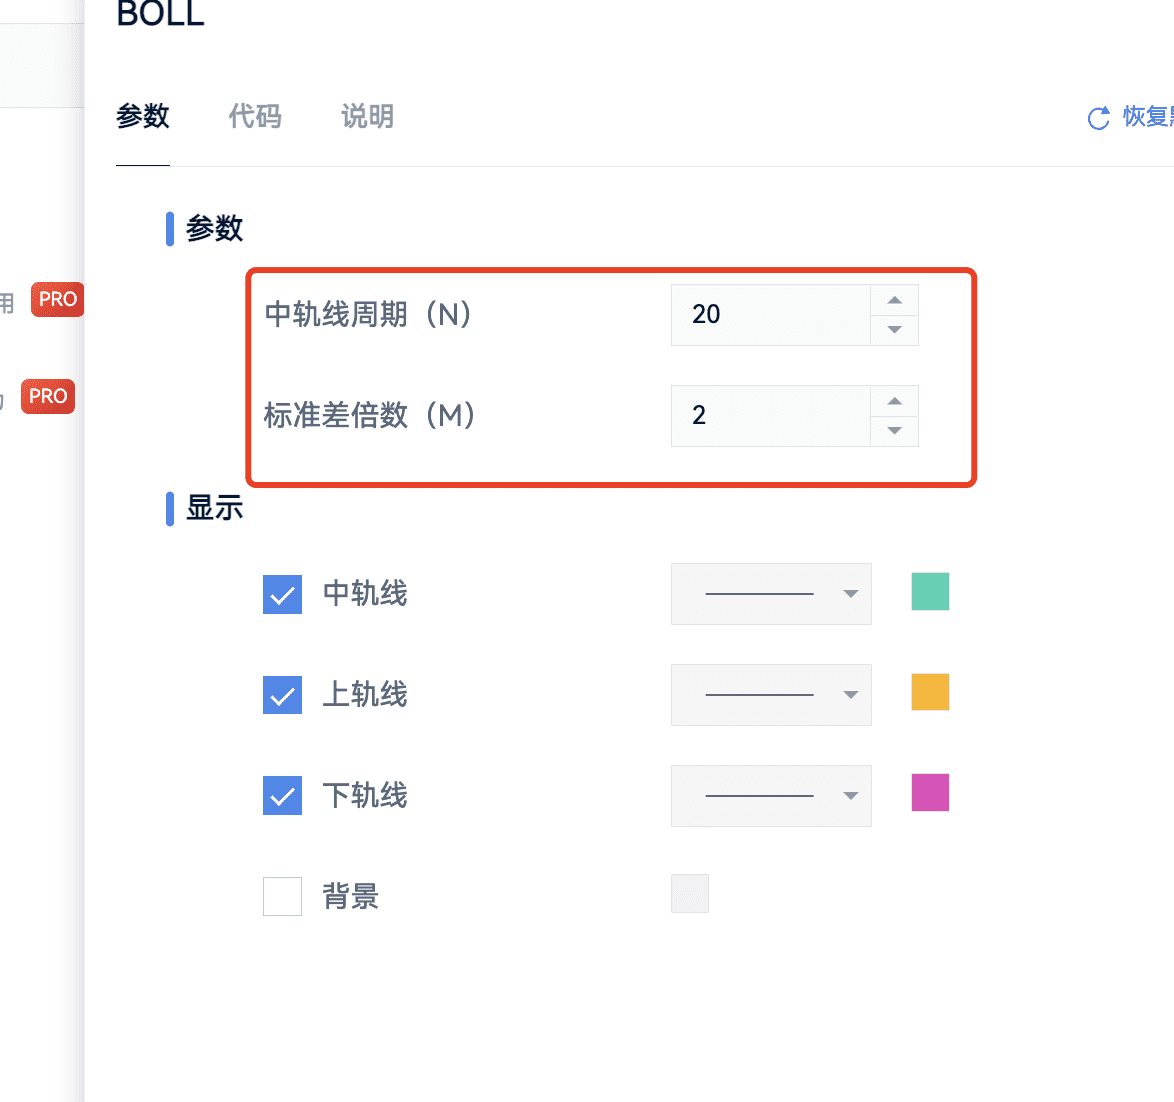
From its formula, we can see that the BOLL indicator uses the 20-day moving average as the middle band and, based on it, calculates its 2 times standard deviation to form the upper and lower bands, thereby enclosing the price within a range to judge potential price changes or the degree of fluctuation in the future.
Basic Calculation Rules
The upper and lower bands mentioned here can be regarded as upper and lower limits. In the calculation of Bollinger Bands, the standard deviation is indeed based on the closing price. The middle band usually refers to the 20-day moving average, representing the average level.
How to Use the Channel
If the price is between the upper and middle bands, and both lines are moving upward, it is considered a good trend.
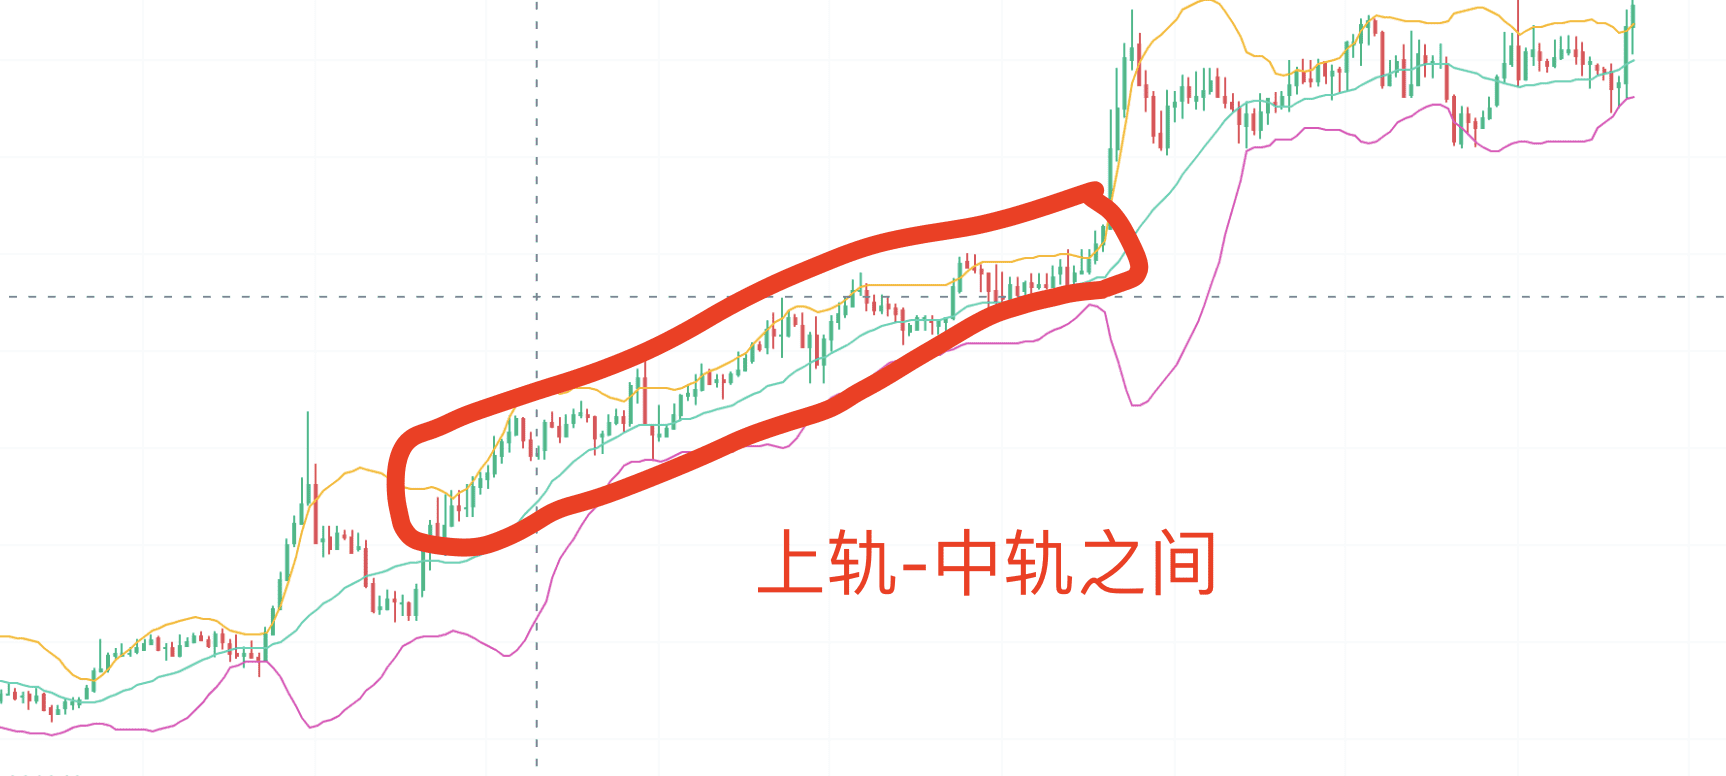
The image shows an upward trend between the upper and middle bands.
If the price is between the middle and lower bands, and both lines are moving downward, then the trend is not expected to be good.
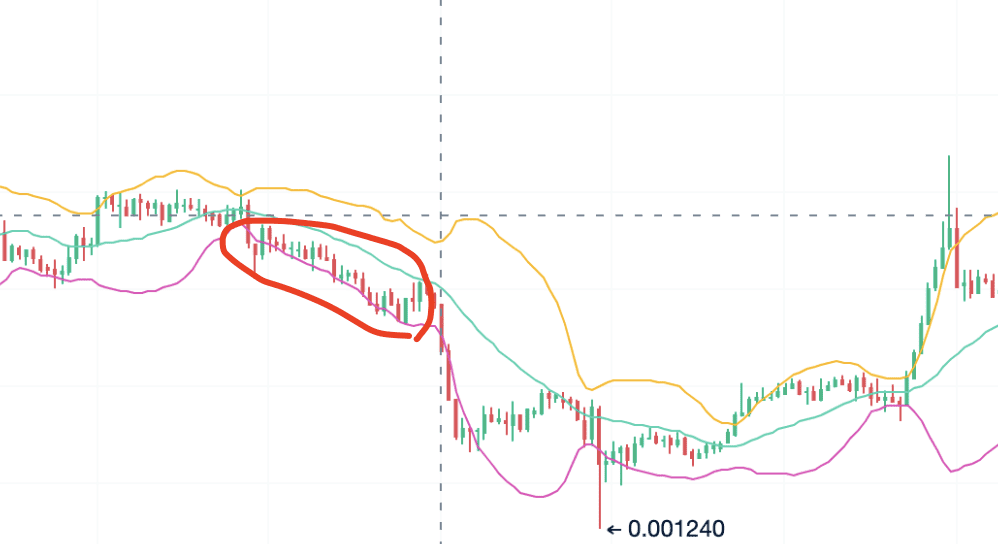
Under default parameters,
The BOLL indicator uses the 20-day moving average as the middle line for price movement, the upper band as the price resistance level, and the lower band as the price support level; this depends on the position of the price. When the price is between the upper and middle bands, the middle band is the price support level; when the price is between the middle and lower bands, the middle band is the price resistance level.
Application Rules
When the price crosses above the upper band, it is likely to encounter resistance, indicating a sell signal.
When the price crosses below the lower band, it is likely to find support, indicating a buy signal.
When the price crosses from above to below the middle band, it is likely to be suppressed by the middle band, indicating a sell signal.
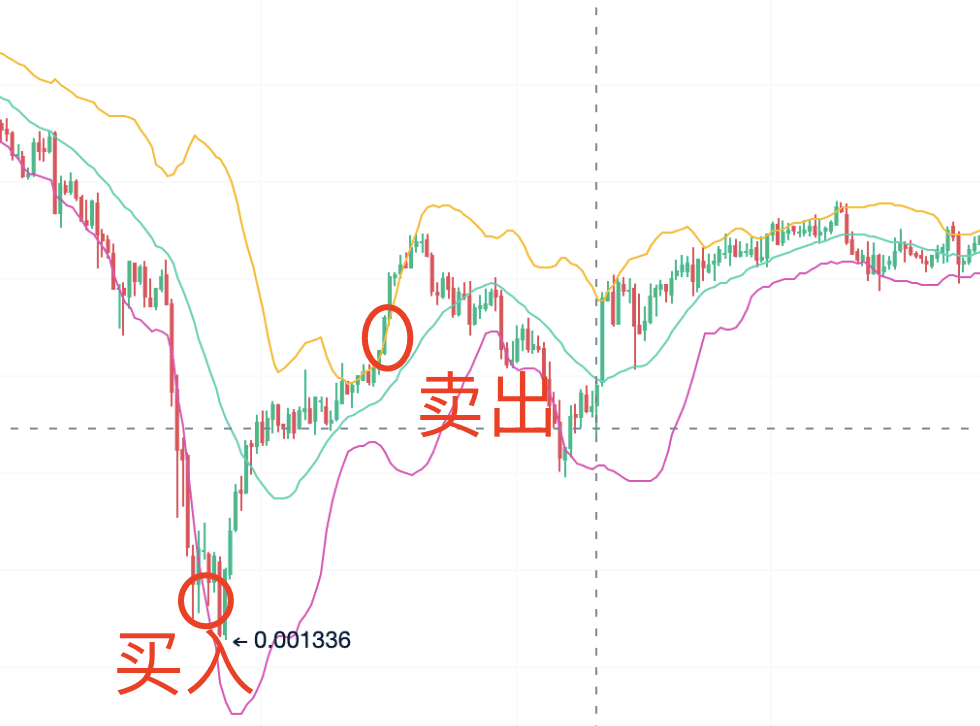
Bollinger Bands are relatively easy to capture trend swings, with commonly used profitable periods being 15 minutes, 1 hour, 45 minutes, and 90 minutes.
In summary, there are four basic application rules:
When the price crosses above the upper band, it is likely to encounter resistance, indicating a sell signal.
When the price crosses below the lower band, it is likely to find support, indicating a buy signal.
When the price crosses from below to above the middle band, it is likely to find support from the middle band, indicating a buy signal.
When the price crosses from above to below the middle band, it is likely to be suppressed by the middle band, indicating a sell signal.
It is recommended to conduct indicator backtesting using 45-minute and 90-minute periods. According to statistical data, these are the two periods most favored by AICoin major traders.
However, in practical use, extreme market conditions are likely to occur when the price breaks above the upper band or below the lower band. Premature buying and selling can lead to losses. It is advisable to enter the market in batches to reduce losses.
Since the BOLL indicator expresses the regular price fluctuation range, when the price is running below the lower band, a buy signal should be set when the price crosses above the lower band; when the price is running above the upper band, a sell signal should be set when the price crosses below the upper band.
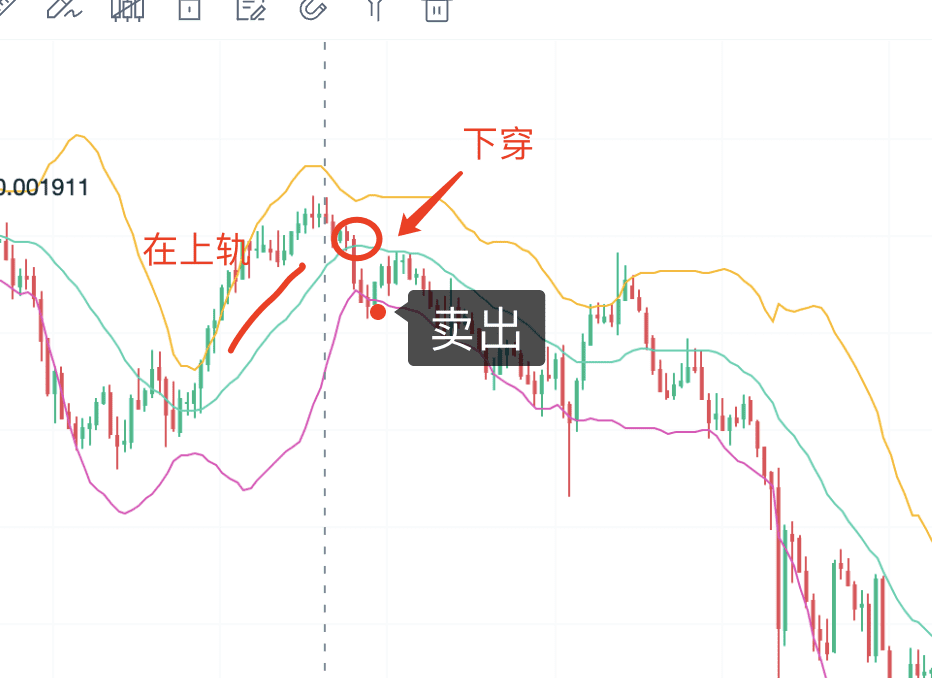
In simple terms, crossing the middle line represents a trading opportunity, and the middle line is the wealth line.
In addition, if the price is close to the upper or lower band and has not broken through, the price at the beginning of the turn should be used as a sell and buy signal, fully implementing the right-side trading rule.
The direction of the 20-day moving average also expresses the overall price trend. The BOLL indicator uses the 20-day moving average as the middle band, forming a trend channel with the upper and lower bands:
Price running between the BOLL upper and lower bands is a normal range;
Price running between the BOLL upper and middle bands is a strong range;
Price running between the BOLL middle and lower bands is a weak range;
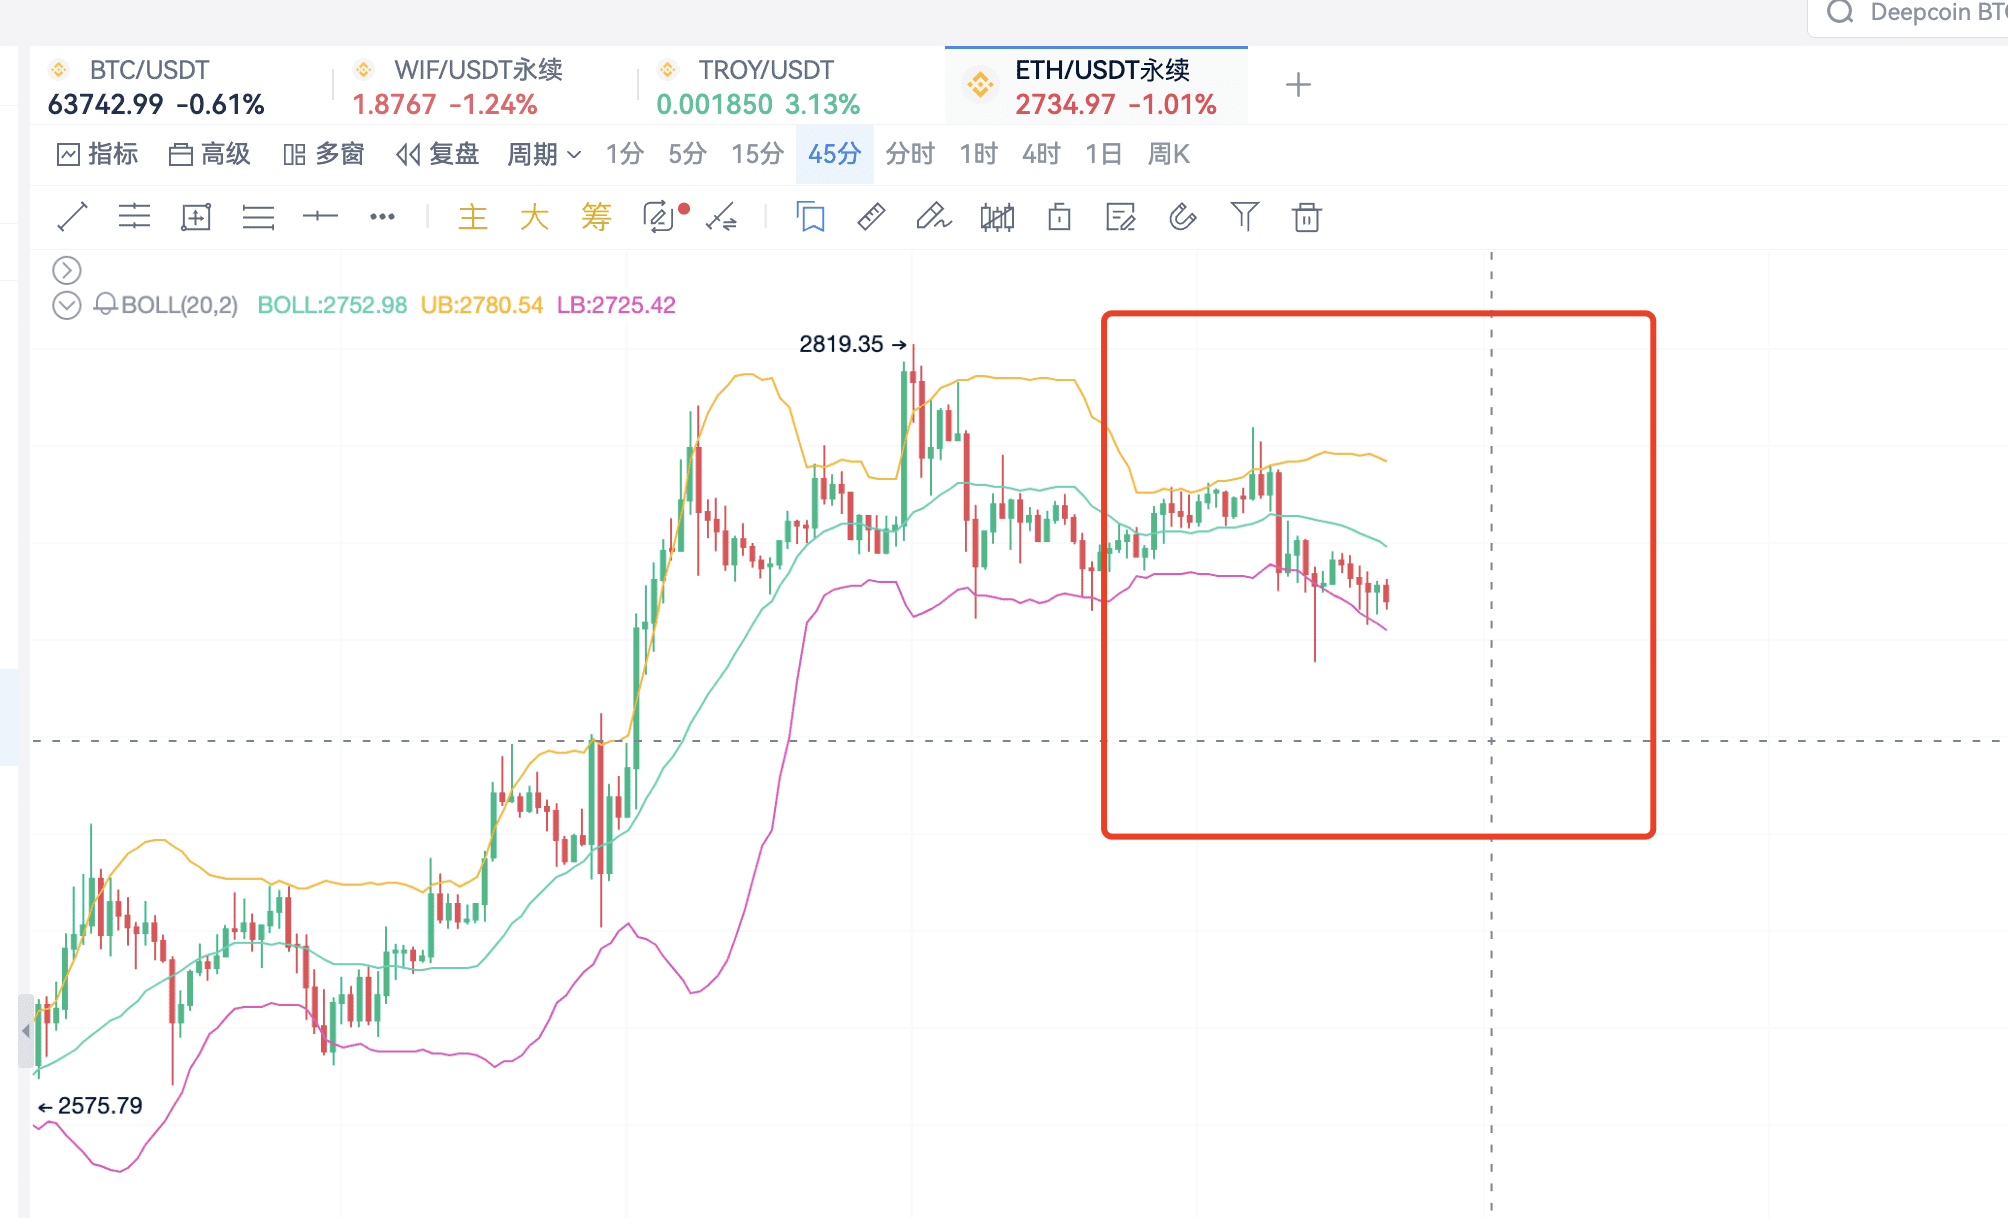
Take a look at the 1-hour period for WIF: WIF is still stable, as the leader of Dogecoin, it has risen several times during market fluctuations.
When the BOLL middle band is running upward and the price is almost running close to the BOLL upper band, it is a unilateral upward range;
When the BOLL middle band is running downward and the price is almost running close to the BOLL lower band, it is a unilateral downward range;
When the price is running above the BOLL upper band and below the BOLL lower band, it indicates an extreme market condition. However, extreme market conditions generally do not last long, as only during sharp rises and falls is it possible for the price to run above the BOLL upper band or below the BOLL lower band.
For the 20-day moving average, it is greatly affected by short-term price fluctuations, and the upper and lower bands are generated based on 2 times the standard deviation of the middle band, resulting in a volatility that is 2 times that of the middle band, so it can follow price fluctuations for a short time.
II. BOLL Patterns: Opening, Closing, Tightening
We have just learned about the simple usage of BOLL. Observant friends will surely notice that the three BOLL bands change according to the price, and the curve shapes of the BOLL upper and lower bands vary depending on the position of the price. If we were to put it figuratively, it's like a horn, sometimes gradually opening and sometimes gradually shrinking.
We divide this horn mouth into three patterns: opening, closing, and tightening, which can help us seize opportunities in a timely manner and avoid risks.
1. Opening Pattern
The opening pattern usually appears at the beginning of an uptrend. When the price breaks through the consolidation range upward, the price movement drives the BOLL upper band to accelerate upward, while the lower band accelerates downward in the opposite direction, making this the best entry point.
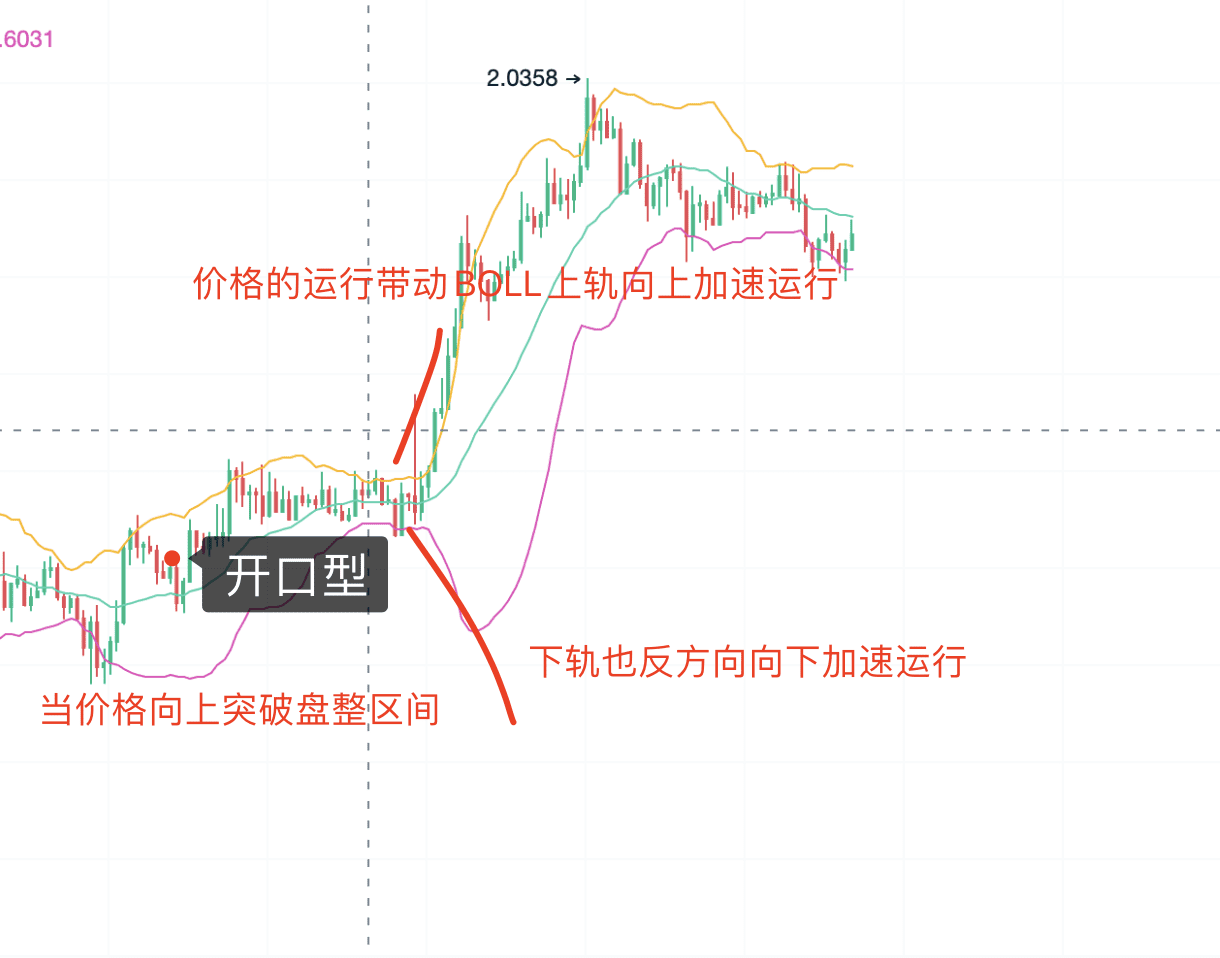
To confirm the reliability of the opening pattern, attention should be paid to the following two points:
Before the opening pattern appears, there is usually a long period of decline and consolidation, with very small price fluctuations, shrinking trading volume, and the BOLL bands gradually approaching and narrowing. The narrower the consolidation, the higher the strength of the subsequent uptrend after the opening pattern appears.
When the opening pattern appears, the price must effectively rise above the BOLL middle band, and the middle band must start to rise from a flat position, with short-term moving averages showing a golden cross and a significant increase in trading volume.
Closing Pattern
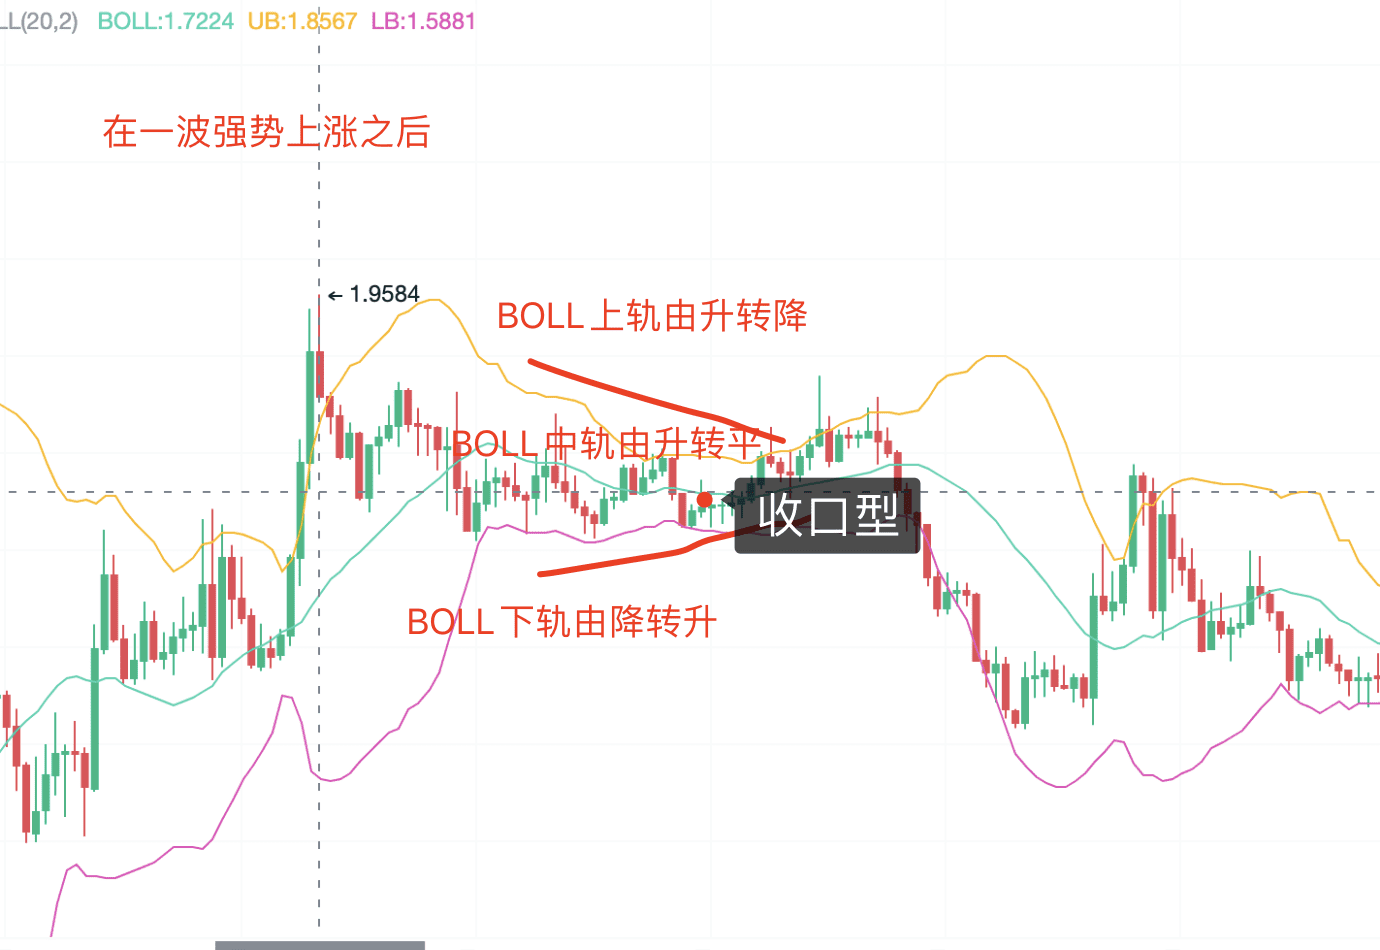
The closing pattern usually appears after a strong uptrend, with the BOLL upper band transitioning from rising to falling, the BOLL lower band transitioning from falling to rising, and the BOLL middle band transitioning from rising to flat, gradually forming the closing pattern, which is the opposite of the horn.
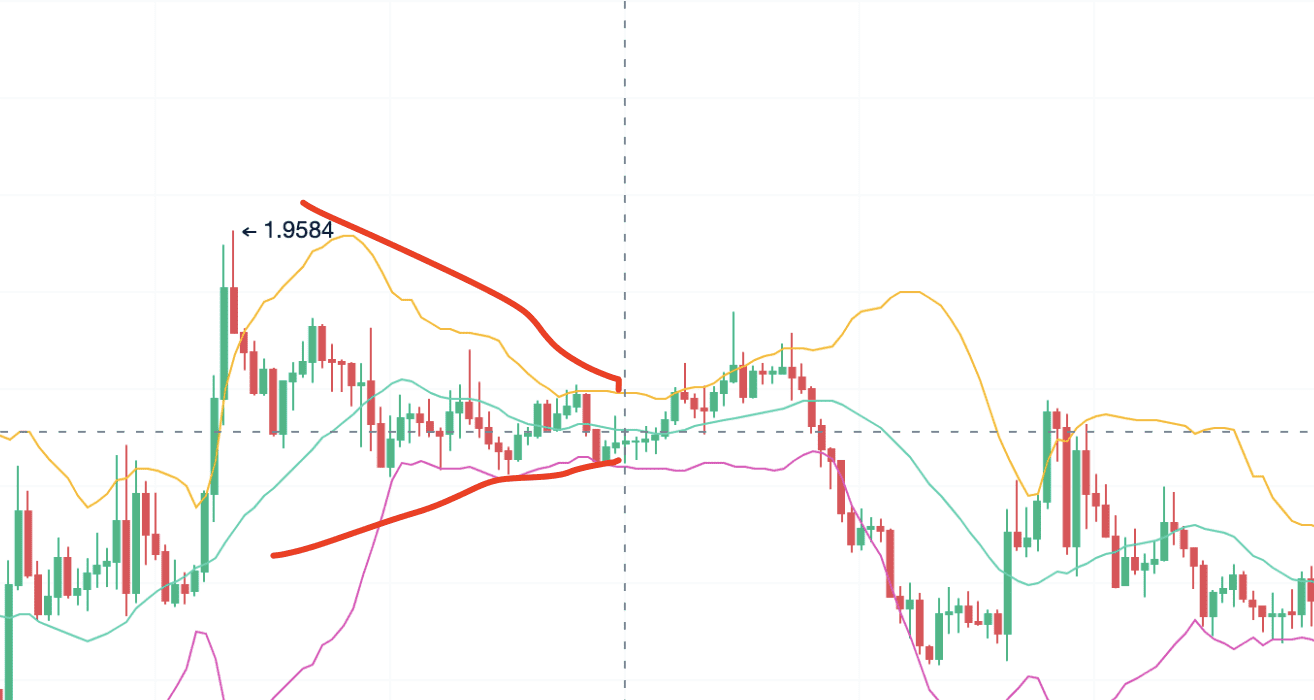
When the closing pattern appears, it does not necessarily mean the end of the entire uptrend, but at least it signifies the end of the uptrend phase and the beginning of a short-term adjustment, making it the best profit-taking point.
To confirm the reliability of the closing pattern, attention should also be paid to two points:
Before the closing pattern appears, there must have been a round of significant uptrend, and the larger the uptrend, the higher the reliability of the closing pattern and the stronger the signal for a short-term decline.
When the closing pattern appears, the BOLL upper band clearly descends, the lower band clearly ascends, the middle band remains flat or even shows signs of descending, and the price also falls below the short-term moving average to form a death cross, or even falls below the BOLL middle band.
3. Tightening Pattern
Both the closing pattern and the tightening pattern have similar curve shapes, with the BOLL three bands gradually narrowing.
The focus is on the flatness.
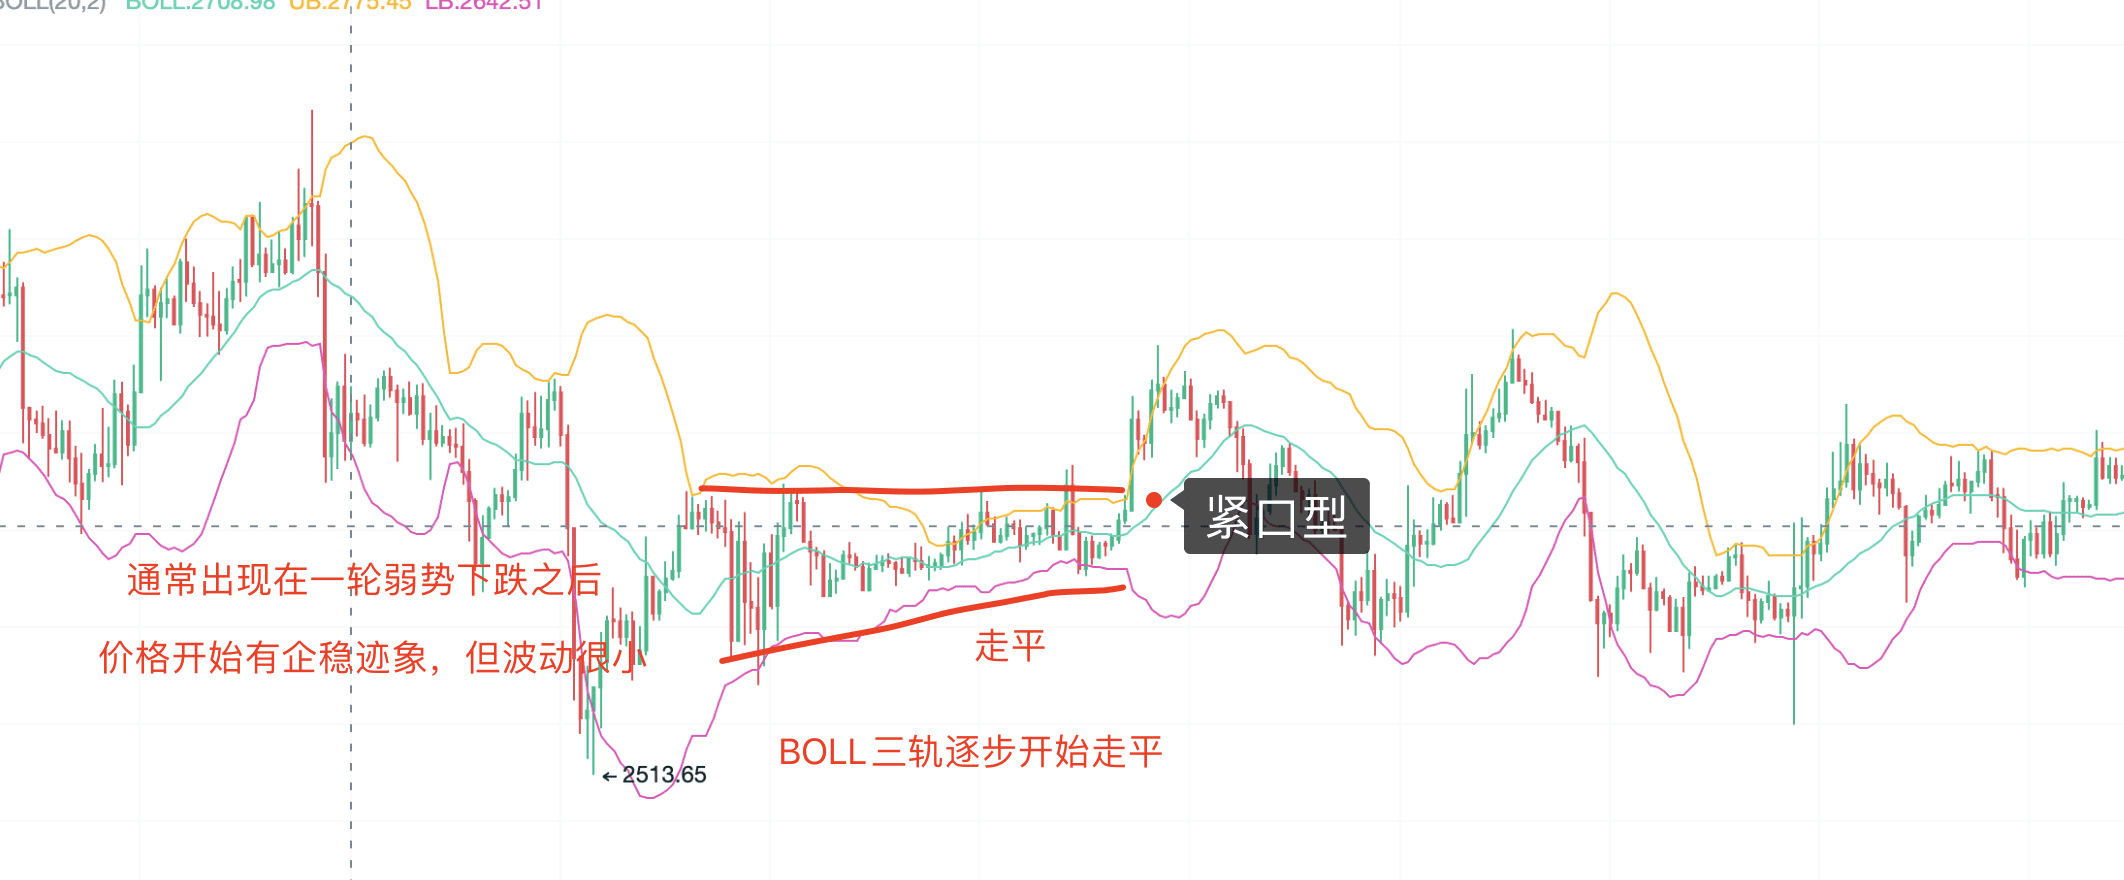
The appearance of the tightening pattern means that the price will enter a phase of consolidation and bottoming. The tightening pattern often lasts a long time, during which holding and waiting for observation is necessary. Three points should be noted:
Before the tightening pattern appears, there must have been a round of significant downtrend.
When the tightening pattern appears, the distance between the BOLL three bands becomes smaller and smaller.
During the tightening pattern, trading volume remains low for a long time.
The closing pattern and the tightening pattern have similar curve shapes, with the BOLL three bands gradually narrowing. However, they appear in different positions. The closing pattern appears after a round of uptrend, presenting a form during the phase of periodic adjustment, while the tightening pattern appears after a long-term downtrend, as the price gradually stabilizes, entering a phase of long-term consolidation. These two have essential differences.
After the appearance of the closing pattern and the tightening pattern, the BOLL three bands will widen again. After the closing pattern, the widening often leads to a price decline, causing the BOLL lower band to move downward; after the tightening pattern, the widening often leads to a price increase, causing the BOLL upper band to move upward. Therefore, the closing pattern appears for a shorter time and the narrowing is often larger, while the tightening pattern appears for a longer time and the narrowing is often smaller. However, whether it is the closing pattern or the tightening pattern, the smaller the narrowing, the greater the space for the subsequent rise or fall after the widening.
That's all the content of this live broadcast. Building and perfecting a personal trading system is a key factor in successful investment. We hope that every AICoin user can find a suitable indicator strategy and achieve financial success!
Recommended Reading
For more live broadcast content, please follow the AICoin "News/Information-Live Review" section, and feel free to download AICoin PC-end.
免责声明:本文章仅代表作者个人观点,不代表本平台的立场和观点。本文章仅供信息分享,不构成对任何人的任何投资建议。用户与作者之间的任何争议,与本平台无关。如网页中刊载的文章或图片涉及侵权,请提供相关的权利证明和身份证明发送邮件到support@aicoin.com,本平台相关工作人员将会进行核查。


