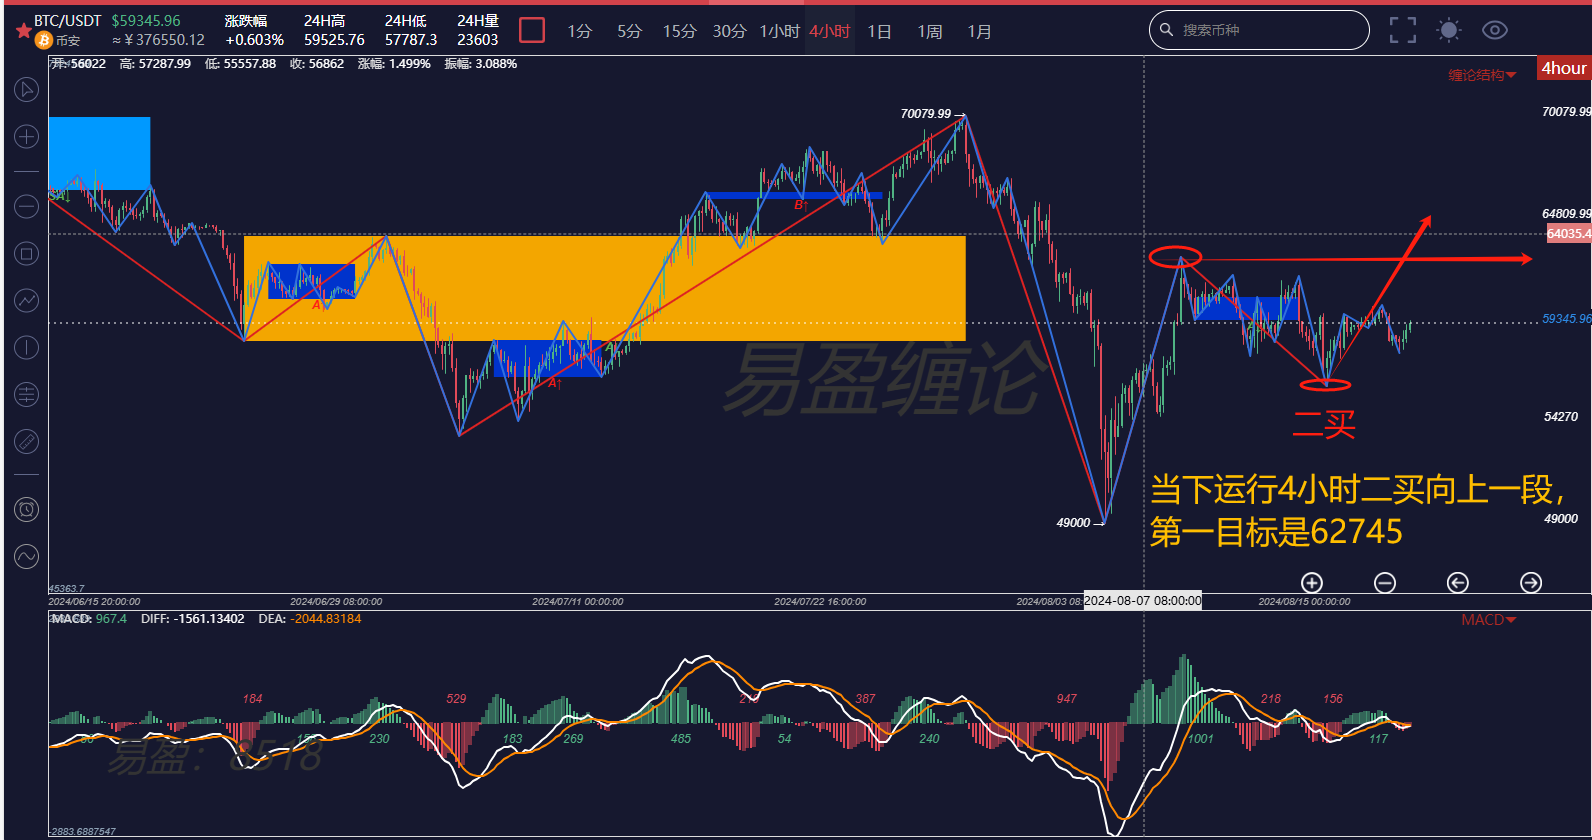
Since the sharp drop on August 5th, BTC plunged to 49000, and then rebounded strongly to a rebound high of 62475 on the 9th, and has been oscillating narrowly between 58000-61000 for more than 10 days. Structurally, it is oscillating at the hourly level, and in terms of time period, the oscillation time has been relatively sufficient, and it is highly likely to show direction in the middle and later days of this week.
From the perspective of the daily and 4-hour structural levels, this analysis tends to choose a higher probability of breaking through the high point of 62745 to complete an upward segment of the 4-hour level. To complete the upward segment of the 4-hour level, it is necessary to first break through 60285, and also observe the strength after the breakthrough.

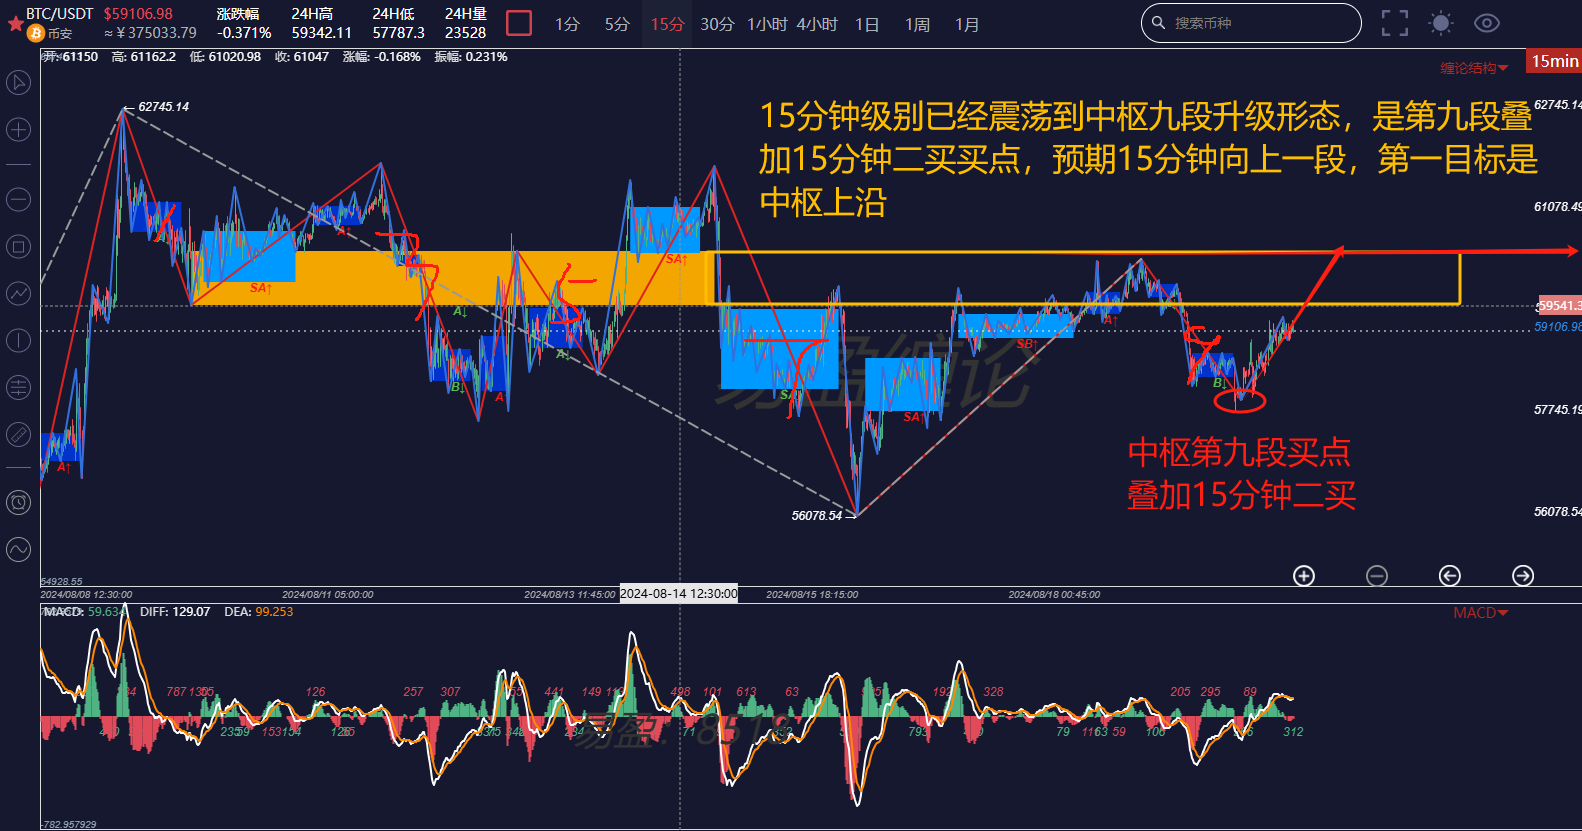
Looking at the 15-minute level corresponding to the 4-hour level, the downward trend type has already shown a non-new low second buy, and the 15-minute level central axis has oscillated to the ninth-stage upgraded buying point. This is also the fundamental reason why this analysis tends to have a higher probability of breaking through in the coming days.

The above analysis is for reference only and does not constitute any investment advice!
If you are interested in the theory of winding, want to get free learning materials, watch public live broadcasts, participate in offline training camps, improve your trading skills with the theory of winding, and build your own trading system to achieve stable profit goals, and use the theory of winding technology to timely escape the top and bottom, you can scan the code to follow the following public account and add the WeChat of this analysis for free learning materials and to chat!

免责声明:本文章仅代表作者个人观点,不代表本平台的立场和观点。本文章仅供信息分享,不构成对任何人的任何投资建议。用户与作者之间的任何争议,与本平台无关。如网页中刊载的文章或图片涉及侵权,请提供相关的权利证明和身份证明发送邮件到support@aicoin.com,本平台相关工作人员将会进行核查。


