As a senior figure in the cryptocurrency industry, I have been deeply involved in this charming and challenging field for many years. Having experienced the ups and downs of the cryptocurrency market and witnessed the rise and fall of numerous currencies, I have accumulated rich practical experience and unique market insights. Investment is a long-term practice, and this is especially true in the cryptocurrency industry. Only by continuously learning and improving one's cognitive and judgment abilities can one steadily progress in this challenging field.
Yang's Analysis of Bitcoin Market on August 16, 2024
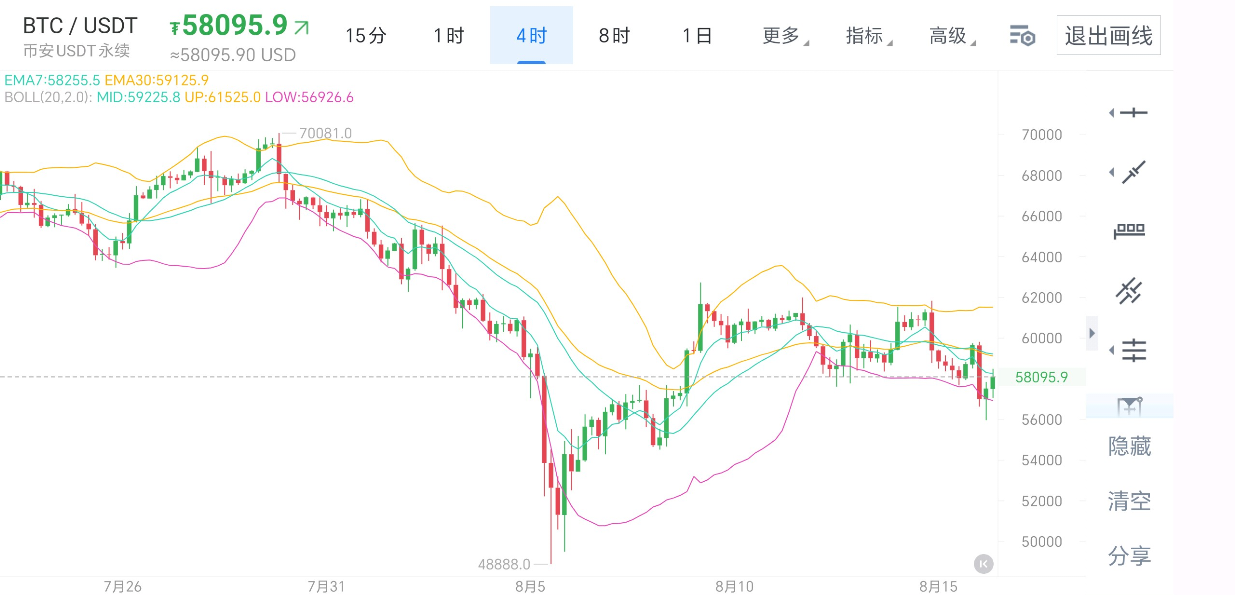
Bitcoin nearly broke through the 60,000 mark early this morning, but after failing to reach a new high, the trend quickly fell by nearly 4,000 points. The volatile market has caused some panic, and the subsequent rebound repaired the coin price to around 57,500. The midline of the Bollinger Bands is relatively strong, with both the DIF and DEA being negative, and the KDJ forming a bearish cross. The four-hour Bollinger Bands are smoothly downward, with the coin price touching the lower-middle range, the MACD showing a bearish volume, and the KDJ forming a bullish cross. Attention should be paid to whether the price can break through the 60,000 mark in the future, and the support level below the large cycle is still around 55,000. It is currently possible to enter the market with a position, but be sure to set up stop-loss and take-profit orders to ensure the safety of the principal.

Short-term Strategy:
Long in the range of 57,500 to 57,000, with a target near 61,000 and a stop loss of 500 points.
Short in the range of 59,000 to 58,500, with a target near 56,000 and a stop loss of 500 points.
Yang's Analysis of Ethereum Market on August 16, 2024
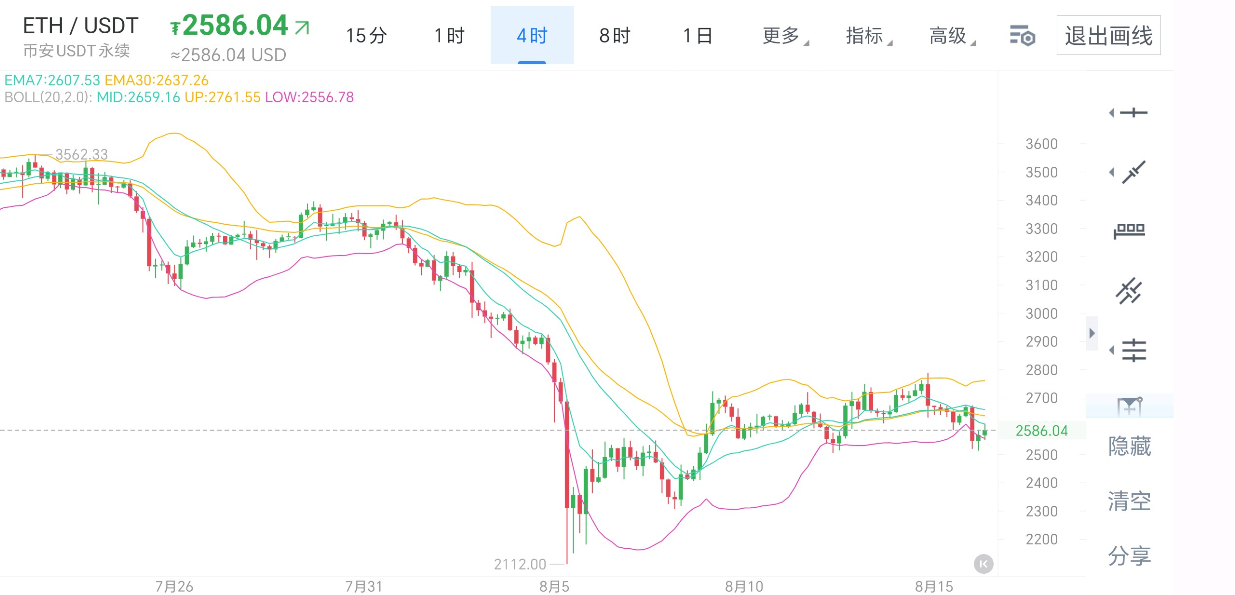
The Ethereum market has seen two consecutive declines, with the highest point of 2,785 falling to around 2,515 early this morning. The overall trend remains within a range, with a bearish EMA arrangement, and the daily chart facing resistance at the fast line of 2,675, leading to a retreat. The Bollinger Bands are widening, and the MACD shows an increase in volume. On the four-hour chart, the DIF and DEA have formed a bearish cross, probing below 0, and the coin price has broken through the lower band of 2,553 to form a support level. Currently, it is possible to take a small long position with a well-placed stop loss.

Short-term Strategy:
Long in the range of 2,500 to 2,550, with a target near 2,680 and a stop loss of 50 points.
Short in the range of 2,670 to 2,620, with a target near 2,550 and a stop loss of 50 points.
Disclaimer: The analysis and insights provided in this article are solely the author's personal opinions and do not constitute specific operational guidance. Any profits or losses resulting from acting on this information are the sole responsibility of the individual. Investment carries risks, so caution is advised when entering the market.
This article is exclusively planned and published by Yang. For more real-time investment strategies, spot contract trading techniques, and operational skills, you can consult the author for learning and communication. With years of focus on BTC, ETH, and altcoin spot contracts, I hope to help you achieve brilliant results!

Friendly reminder: The content above is created solely by the author. Any advertisements at the end of the article and in the comments section are unrelated to the author. Please discern carefully, and thank you for reading.
免责声明:本文章仅代表作者个人观点,不代表本平台的立场和观点。本文章仅供信息分享,不构成对任何人的任何投资建议。用户与作者之间的任何争议,与本平台无关。如网页中刊载的文章或图片涉及侵权,请提供相关的权利证明和身份证明发送邮件到support@aicoin.com,本平台相关工作人员将会进行核查。


