Macro News Interpretation:
① Former New York Fed Chairman Dudley stated that there is increasing evidence in the past two weeks that the U.S. labor market is weakening and inflation is further slowing down. The longer the Fed waits, the greater the potential damage. He expects that the Fed may cut interest rates by 25 or 50 basis points in September. Interest rate cuts represent a reduced expectation for future economic health, increasing market concerns, and a general decline in the market last night.
② In the U.S. stock market, all three major stock indexes closed lower. Most popular tech stocks fell, with Nvidia dropping over 5% and Tesla dropping over 4%. Globally, LME copper prices reached their lowest closing level since March, with the largest increase in inventory in four years, highlighting weak demand. As an economic indicator, the decline in copper prices indicates that the future economic trend is becoming uncertain again, affecting global markets, including a synchronized decline in the cryptocurrency market.
③ The founder of the "Sam Rule" stated that despite recent economic data being weaker than expected, the Fed does not need to urgently cut interest rates. However, there are sufficient reasons to cut rates by 50 basis points. Sam warned that central banks need to remain vigilant and not wait too long to cut rates, as changes in interest rates take a long time to impact the economy. Overall, Sam's remarks are somewhat ambiguous, from not needing an urgent interest rate cut to having sufficient reasons to cut rates by 50 basis points, and then to not waiting too long to cut rates. This has made the market appear more anxious, and the cryptocurrency market has shown a fluctuating trend, such as BTC experiencing rises and falls.
Data Analysis:

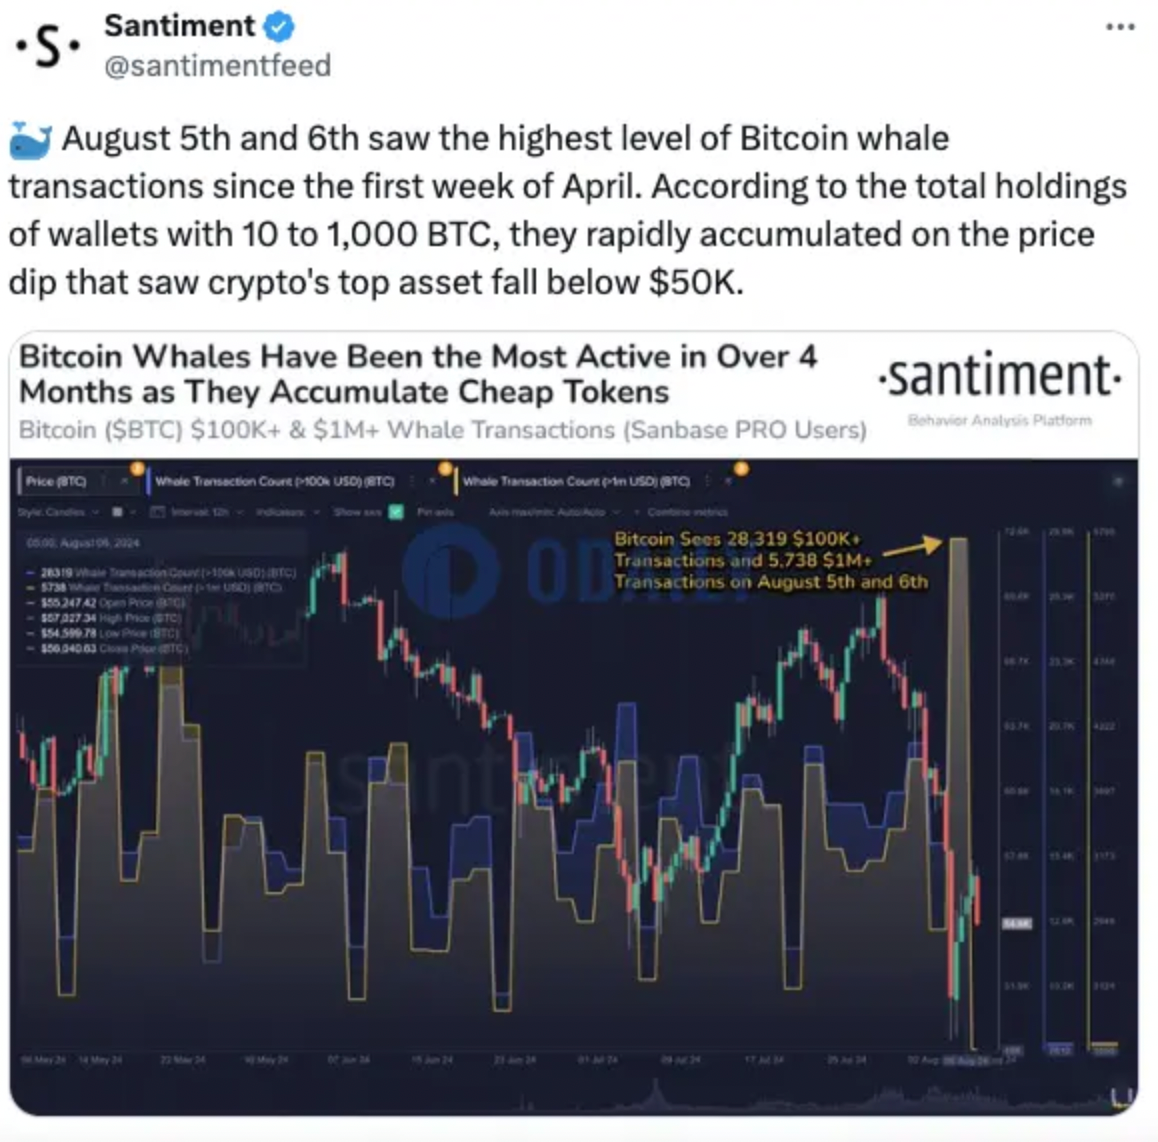
① Santiment data shows that during this decline, Bitcoin whales' activity reached its highest level since early April. Based on the total holdings of wallets with 10 to 1000 BTC, these whales quickly bought the dip in the market.
② Yesterday, we discussed that the whales bought 30,000 BTC during the decline. Currently, this is the largest buying behavior of main funds since the drop from 73777. Generally, major holders can influence the direction of the market, and we can follow their trading trends for potential opportunities.
SOL News Summary and Interpretation:

① SOL's market value is close to $710 billion, surpassing BNB once again and rising to fourth place, second only to BTC, ETH, and USDT.
② The Brazilian Securities and Exchange Commission has approved the first Solana spot ETF, which will begin trading on the B3 exchange within three months.
③ SOL/ETH has once again reached a historical high, breaking the previous high of 0.0591 in March, indicating that SOL's recent overall increase far exceeds ETH. This can be used as a reference for our trading strength and weakness, and can also be used for arbitrage trading, such as prioritizing buying SOL in the short term and simultaneously shorting/selling ETH, and then buying ETH and simultaneously shorting/selling SOL when the exchange rate diverges significantly in the future.
④ Top trader Eugene stated that looking back at the 2023-2024 period, it will be consistently referred to as the "SOL super cycle." From the price trend, it is almost the only major currency that has substantially repriced against any trading pair in the high timeframe.
Technical Analysis:
SOL Technical Analysis

Weekly Level:
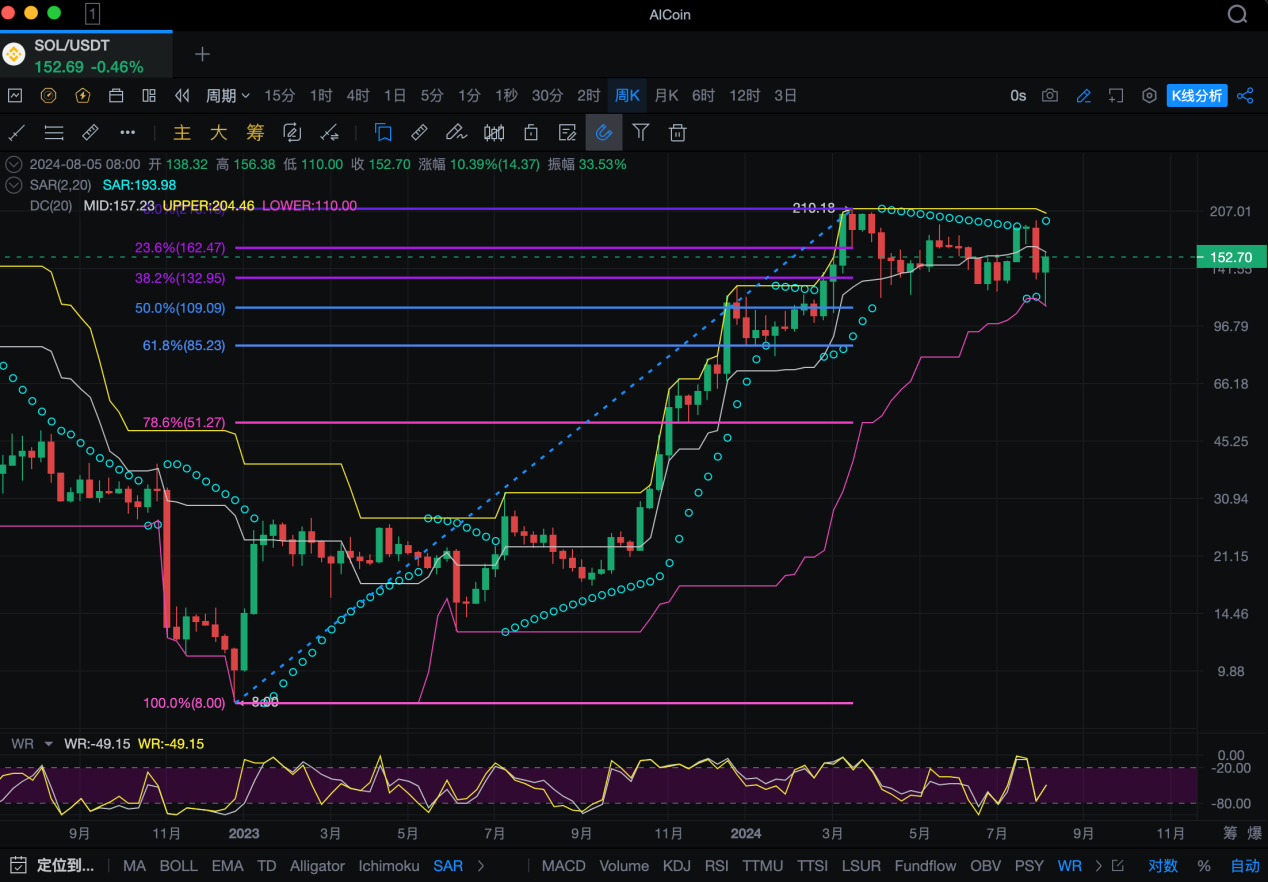
After the overall market decline, SOL's rebound is currently stronger than ETH and BTC, as can be seen from the exchange rate mentioned earlier, and the exchange rate against BTC is also rising (SOL/BTC chart). Currently, the weekly candlestick has a hammer line with a lower shadow, which, if closed in this manner by next Monday, can be considered a short-term stabilization signal. Let's do some technical analysis to determine important resistance and support levels as trading reference points.
First, looking at the SOL weekly chart, the SAR indicator shows that it has already turned into a bearish trend after the early Monday close, and the reversal point is near $193. It will maintain a bearish trend until a breakthrough occurs.
The recent decline bottomed out near $110, which is the Fibonacci 50% support level around $109. It rebounded strongly from this level and has currently risen above the 38.2% level, around $133. The short-term resistance is around the 23.6% level, around $162.5.
Looking at the DC Donchian Channel indicator (a pressure support judgment indicator, similar to the Bollinger Bands), the weekly low touched the lower channel support near $110 and rebounded. This is also near the SAR indicator reversal point at $116-117.5. The current upper resistance is near the DC channel midline at $157.23. The current high of $156.38 is already close, so we need to pay attention to the resistance effect. If it is under pressure, there may be another pullback. If it breaks through and stays above the midline, there is a chance to test the upper channel resistance near $204.46 in the future. There may be slight changes in the future with price fluctuations.
Currently, looking at the Williams %R (WR) indicator, as a sensitive overbought/oversold type indicator, it had already reached the oversold area before the recent major drop and has started to turn upward this week, confirming the rebound trend. The rebound is expected to continue, and we need to pay attention to the gains and losses near the above-mentioned resistance levels to seek entry opportunities.

Daily Level:
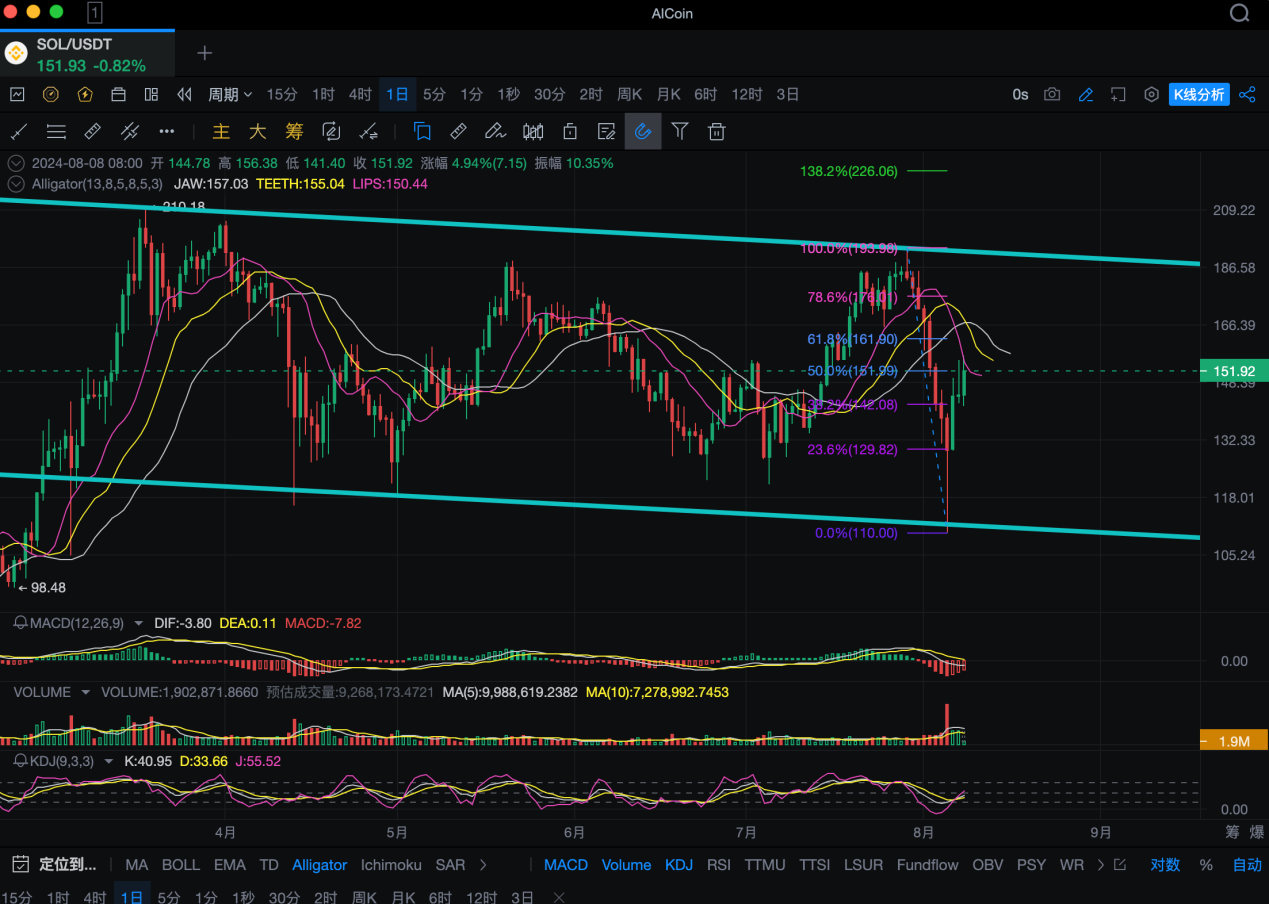
Currently, the overall daily chart is running within a descending channel, indicating a bearish trend of lower highs and lower lows since the new high in mid-March. The recent low touched the lower channel support and rebounded, currently oscillating near the midline at $152. If it breaks above the midline, it may test the downward resistance near $190. If it is under pressure near the midline, it will continue to oscillate and accumulate strength.
From a technical indicator perspective, the alligator indicator has opened downward, indicating a change to a bearish trend during the previous downtrend. Currently, it has stalled near the lips line of the alligator, with resistance above at the teeth and jaw lines near $155-157.
Looking at the Fibonacci retracement levels from the recent decline and rebound, it has now risen above the 50% level, around $152. The upper resistance is near the 61.8% and 78.6% levels, around $162 and $176. The lower support is near the 38.2% and 23.6% levels, around $142 and $130.
Looking at the secondary chart indicators, the MACD bearish momentum column is shrinking. If the price continues to oscillate without a significant decline, it may gradually form a golden cross and sustain the rebound, boosting market confidence.
The KDJ indicator's J value has turned upward after reaching the oversold area, and it has formed a golden cross. In this regard, the KD indicator is more sensitive than the MACD and can be used as a precursor reference. It is conducive to the price's rebound.
Looking at the trading volume, as we mentioned yesterday, high volume accompanies high prices and low volume accompanies low prices. This can also be verified in SOL. The trading volume on Monday set a new high since January 23, 23 years ago, allowing the bears to release, which may also be a signal of a temporary bottom.

Four-Hour Level:
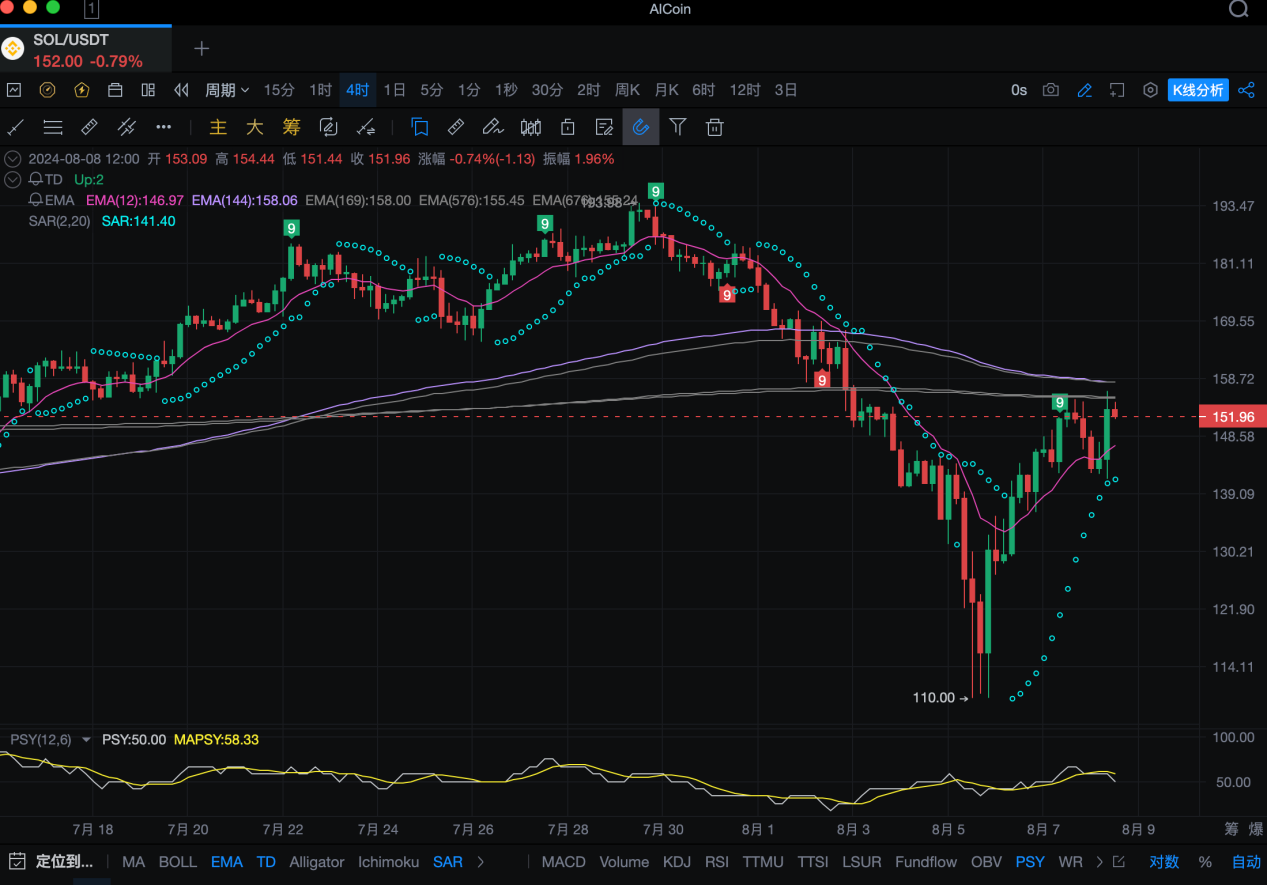
Looking at the four-hour chart, the current rebound has turned the SAR indicator into a bullish trend. The lower reversal point can be considered as support near $141.1.
The upper resistance is near the two resistance levels of the Vegas channel, at $155.5 and $158. There may be slight fluctuations with price changes.
Currently, the PSY psychological line indicator is in a normal distribution range, indicating a phase of equilibrium between long and short positions, which is relatively healthy. However, a death cross signal has appeared, which may indicate a price pullback. Additionally, the TD sequence has previously shown a 9-to-1 signal, and after the pullback, the rebound may return to this level. In the short term, it may continue to be suppressed, and we need to wait for a significant fluctuation to break the deadlock.
In summary, SOL rebounded this week after the market decline, showing strength compared to ETH and BTC. Major technical indicators show a bearish trend, but short-term indicators maintain a rebound pattern. Both upper resistance and lower support are clear, and a high-short, low-long approach can be adopted.
Follow us: Lao Li Mortar
免责声明:本文章仅代表作者个人观点,不代表本平台的立场和观点。本文章仅供信息分享,不构成对任何人的任何投资建议。用户与作者之间的任何争议,与本平台无关。如网页中刊载的文章或图片涉及侵权,请提供相关的权利证明和身份证明发送邮件到support@aicoin.com,本平台相关工作人员将会进行核查。


