Macro News Interpretation:
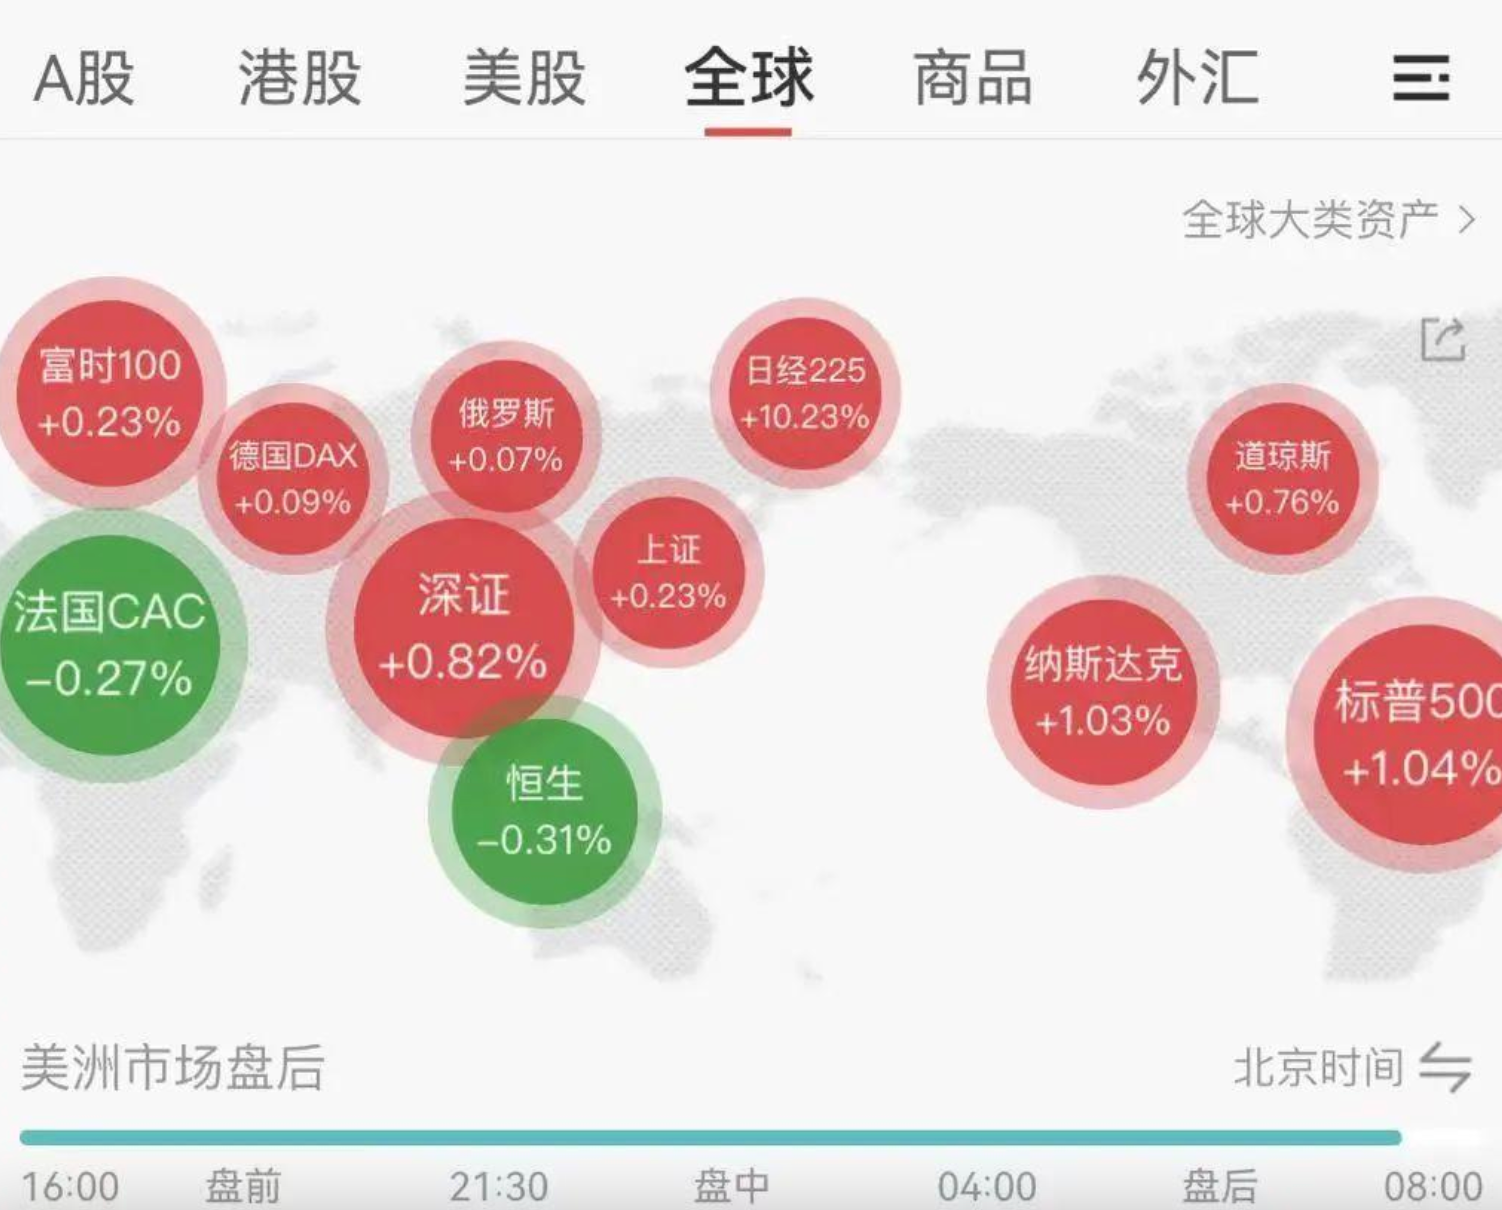
① Due to the easing of concerns about economic recession and the over 10% surge of the Nikkei 225 in the Japanese stock market, major stock indices ended their three-day decline, with the S&P 500 and Nasdaq both rising by over 1% overnight. As the arbitrage trading of the Japanese yen continues to weaken, various markets may continue to experience volatile rebounds in the short term, which is also an external factor maintaining the rebound of our cryptocurrency market.
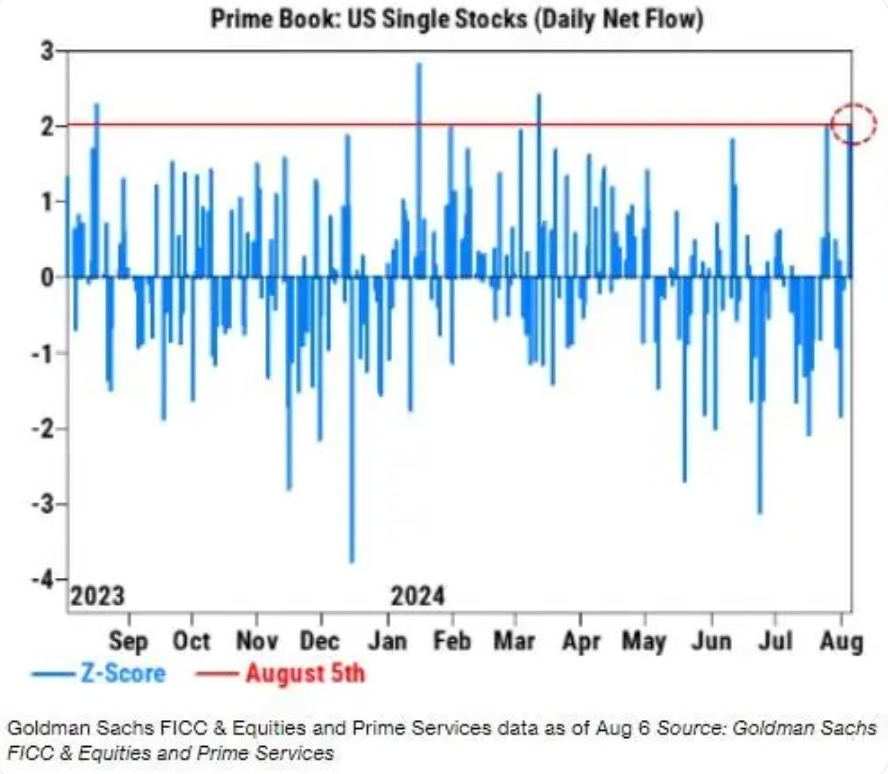
② During the global market downturn on Monday, large institutional investors are buying on dips. According to Goldman Sachs data, hedge funds have been buying U.S. stocks at the fastest pace since March, reversing the selling frenzy. Morgan Stanley analysis shows that institutional investors have net purchased $14 billion worth of stocks during the downturn. This also provides financial support for the global market rebound.
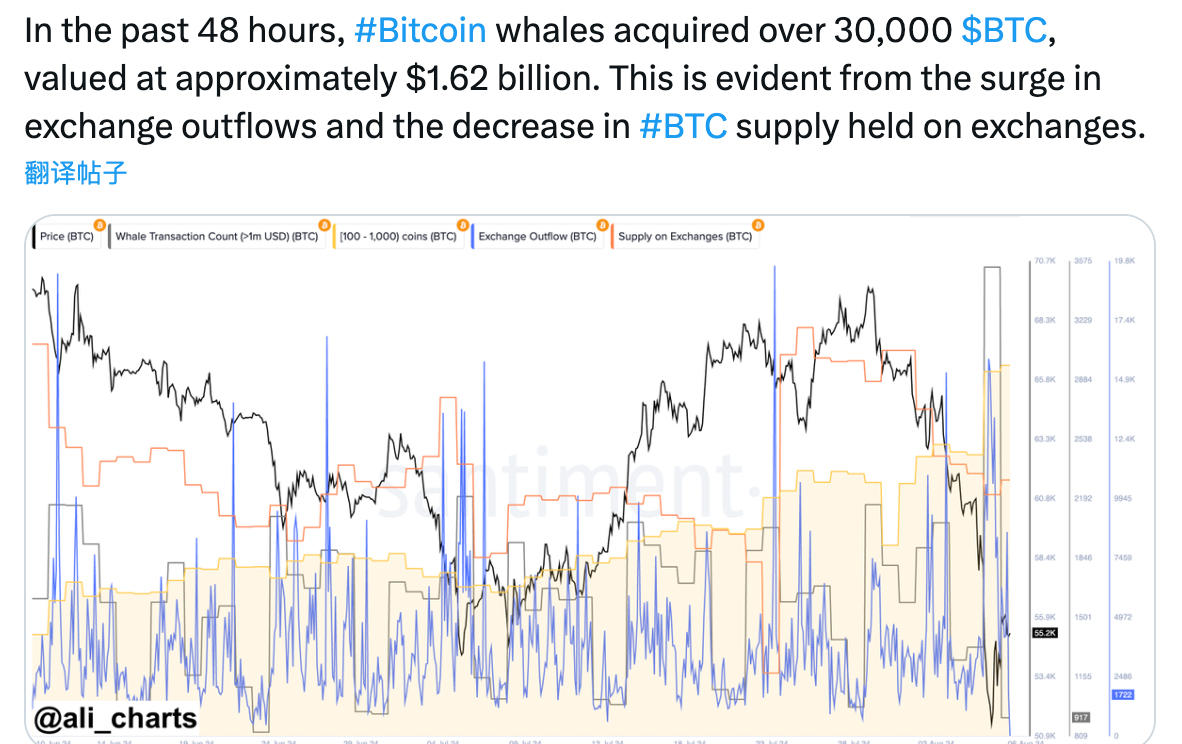
③ Not only in the U.S. stock market, but also in our cryptocurrency market, there are large whales hoarding a large amount of coins. In the past 48 hours, Bitcoin whales have acquired over 30,000 BTC, worth approximately $1.62 billion. This can be seen from the sharp increase in outflow from exchanges and the decrease in the supply of BTC held by exchanges.
Data Analysis:
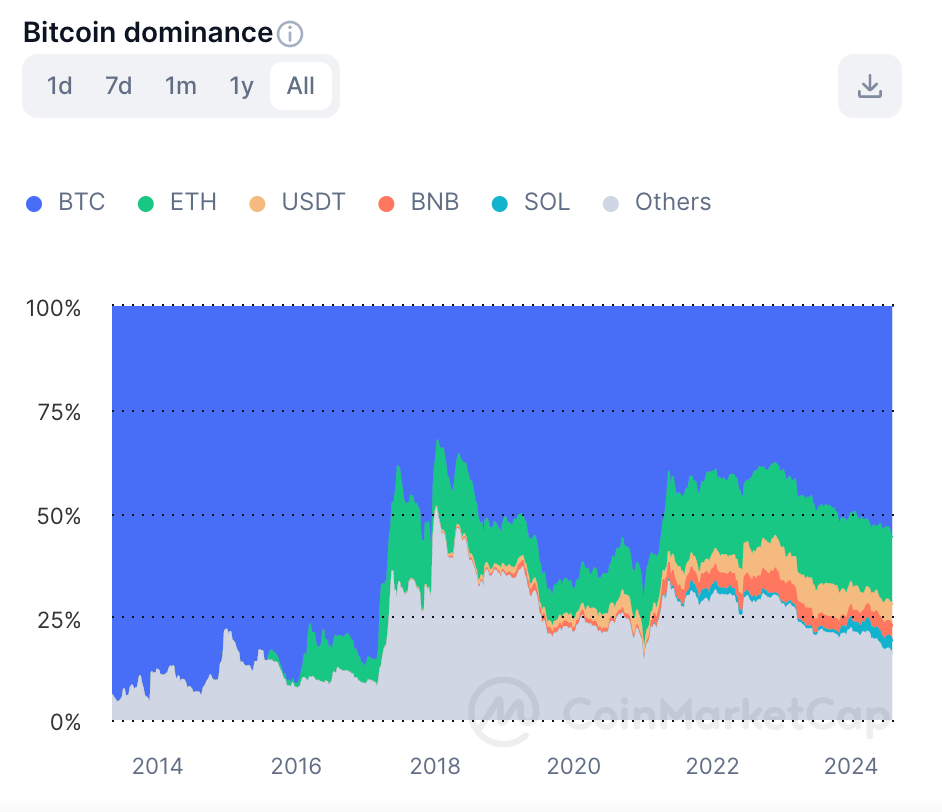
① The market value of Bitcoin accounts for 55.9% of the total market value of cryptocurrencies, reaching a new high since April 2021, while the market share of ETH is approximately 15%. It is worth noting that the market share of SOL reached a historical high of 3.62% on July 29th.
② The market value of BTC has reached a new high in nearly three and a half years, indicating that the short-term rebound of Bitcoin is attracting capital. Additionally, this has also led to a much larger decline in the overall market of altcoins compared to BTC.
③ Generally, after Bitcoin attracts funds, there will be some liquidity diffusion, which is a game of existing funds. When funds flow back into altcoins, it will also lead to a general rise and rotational market. We will also seek opportunities to buy altcoins at low levels in the near future to participate in the rebound market.
BTC Technical Analysis
Weekly Level: (Logarithmic Coordinates)
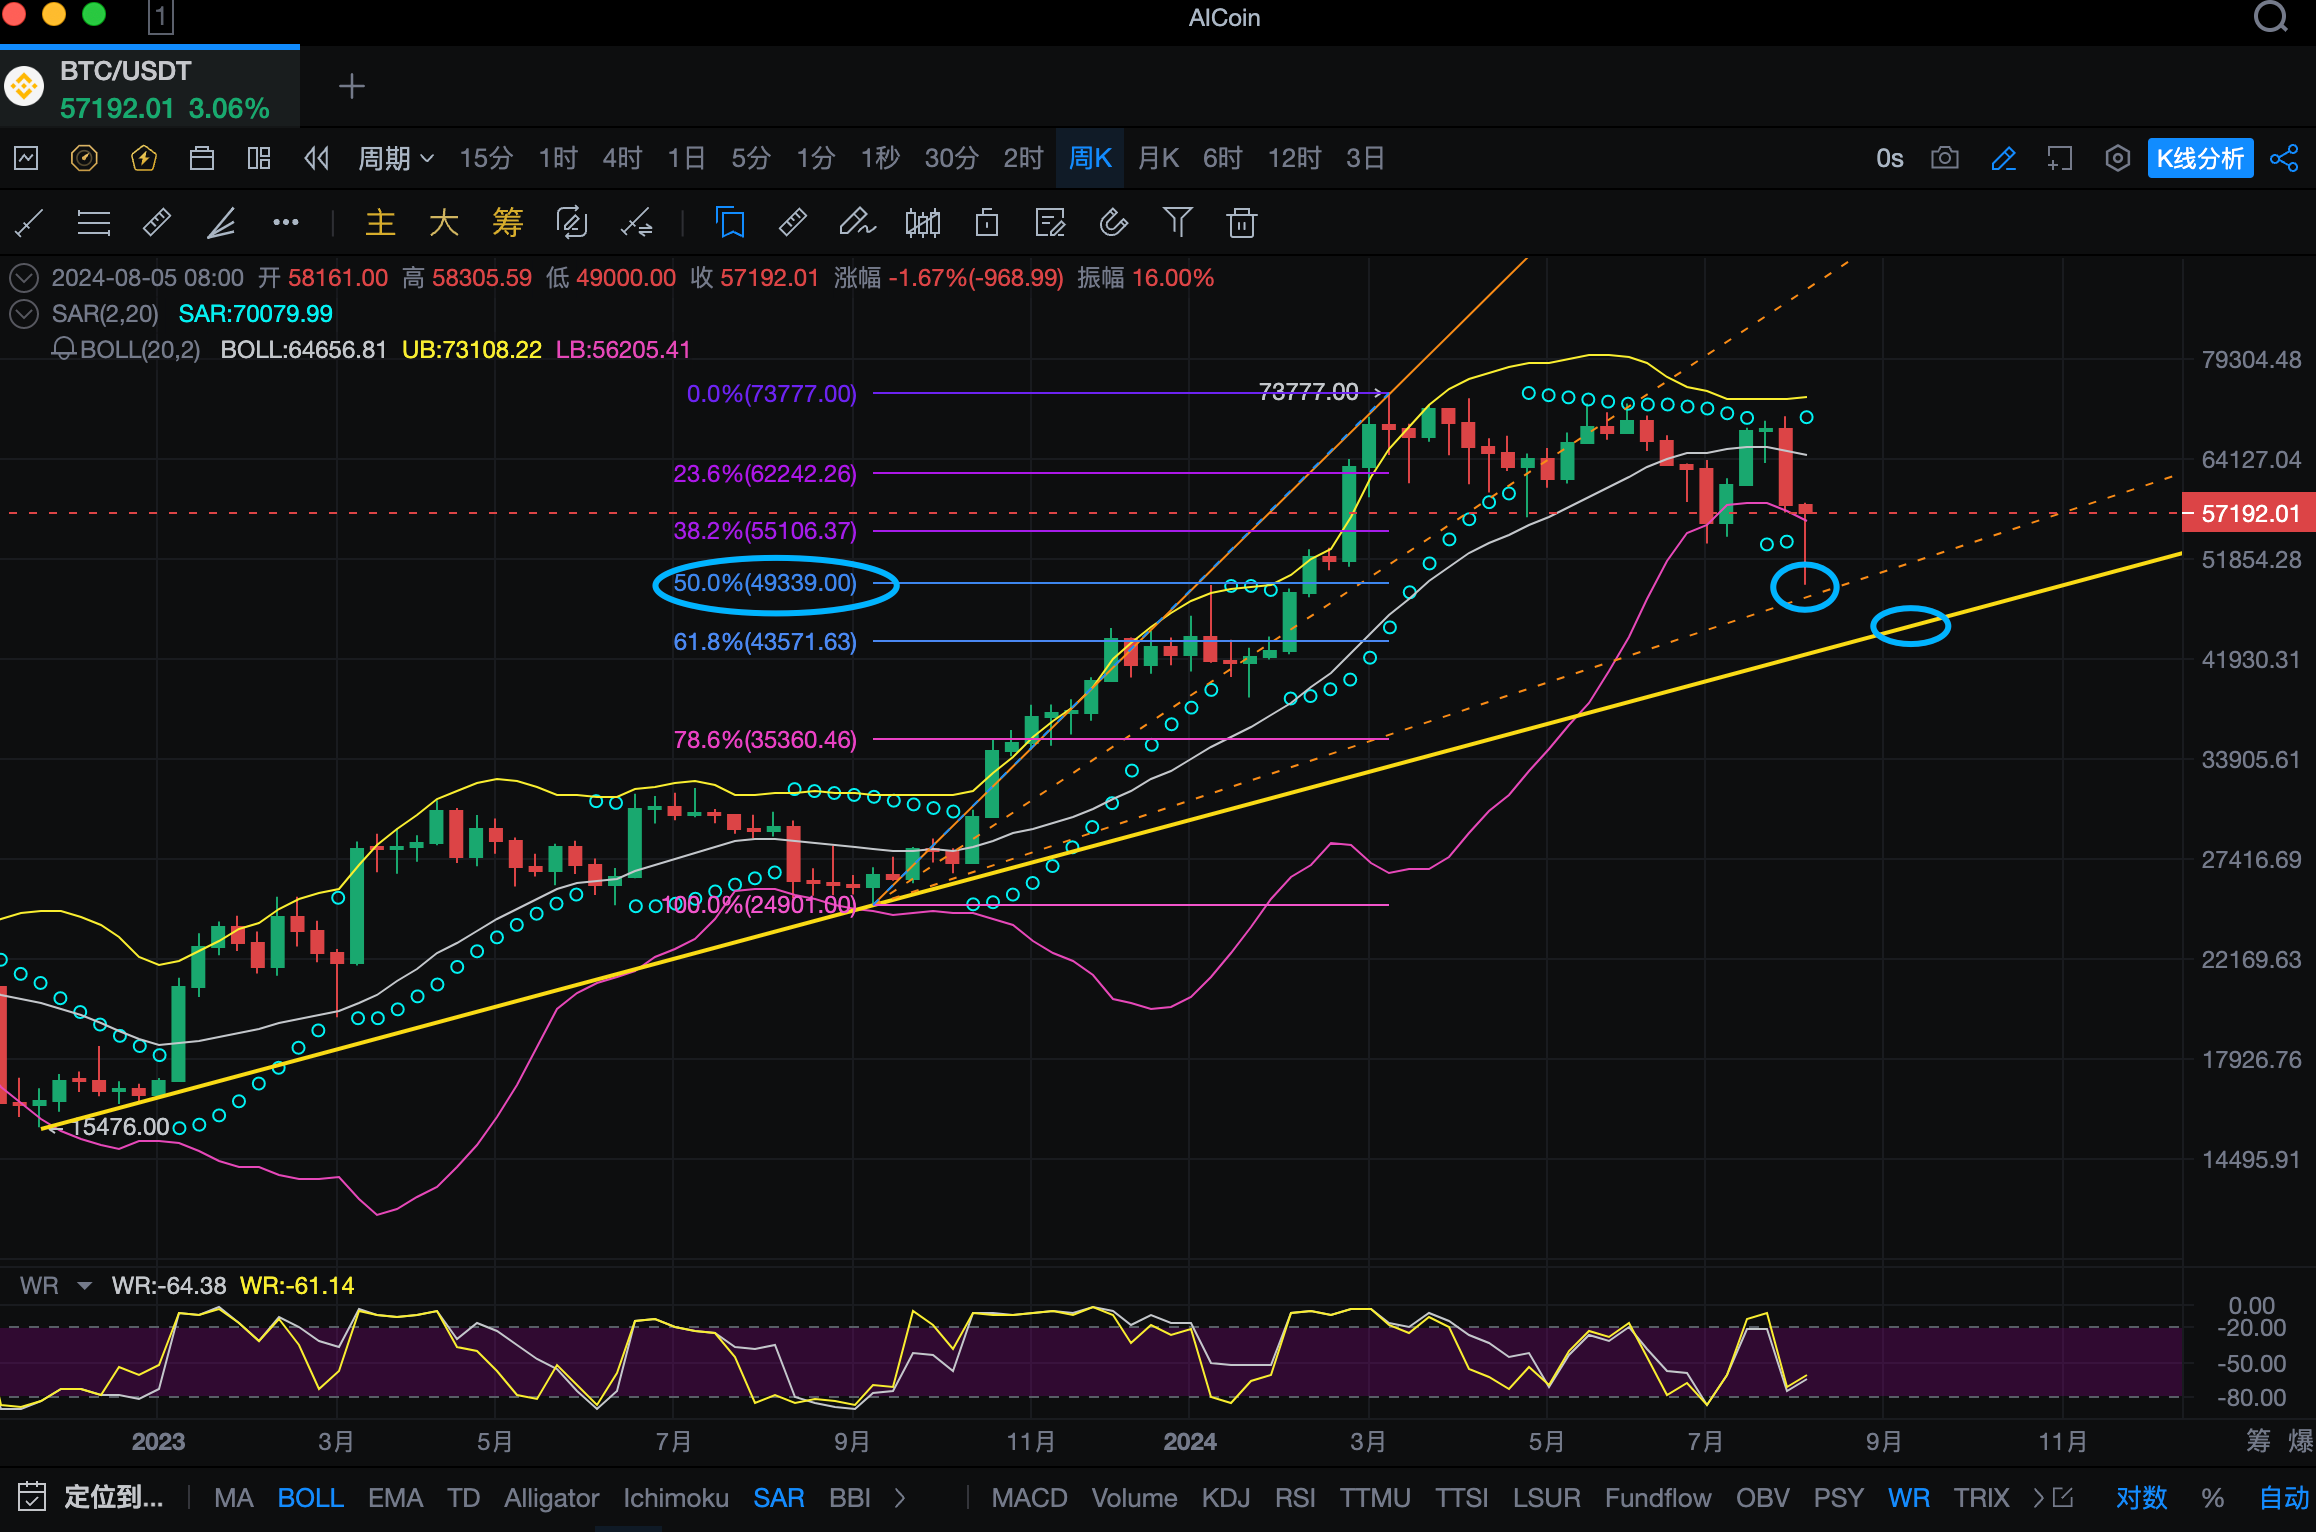
The recent trend at the weekly level has rebounded according to the support level analyzed earlier. Currently, it has reached a high near $57,288, almost recovering the opening price of $58,160 for the week, leaving a long lower shadow, which can be considered a short-term bottom signal. Overall, it is necessary to wait for the specific K-line at the close of next Monday to evaluate. It is important to pay attention to the resistance above and the support below. We will conduct a detailed analysis to seek trading direction and entry/exit points.
Let's first determine the trend. Currently, the SAR indicator has turned into a bearish trend this week, and it will maintain a bearish trend until the SAR indicator moves downward without a breakthrough.
From the Bollinger Bands perspective, it has almost recovered the lower band position, providing some traction support. The previous excessive deviation has also been corrected. However, in recent weeks, the Bollinger Bands have been narrowing, and there is the first sign of a downward turn in the midline since January 23, 2023, which may also indicate a future downward trend. This view will be maintained until it breaks through the resistance at the midline of $64,650.
From the Fibonacci sequence perspective, the starting point of the rally from $24,900 since September last year to the highest point of this round of rally at $73,777 after the approval of the ETF has drawn a line. The lowest point this week fell to around $49,340, which is also the second speed resistance line and resonant support level. This can be considered as a stage support, and it will maintain a volatile rebound trend until it is not broken. If it later falls below the support below, the reference is around 61.8% near $43,570, which is also the resonant support level near $43,000, the future uptrend line.
Currently, the Williams %R indicator is turning up before approaching the oversold zone, indicating that the recent rebound may continue, and there is no need to panic about breaking new lows in the short term. Because the Williams %R indicator is relatively sensitive, there is still a risk of entering the oversold zone in the medium to long term, and the market may experience a second decline at that time.
Daily Level:
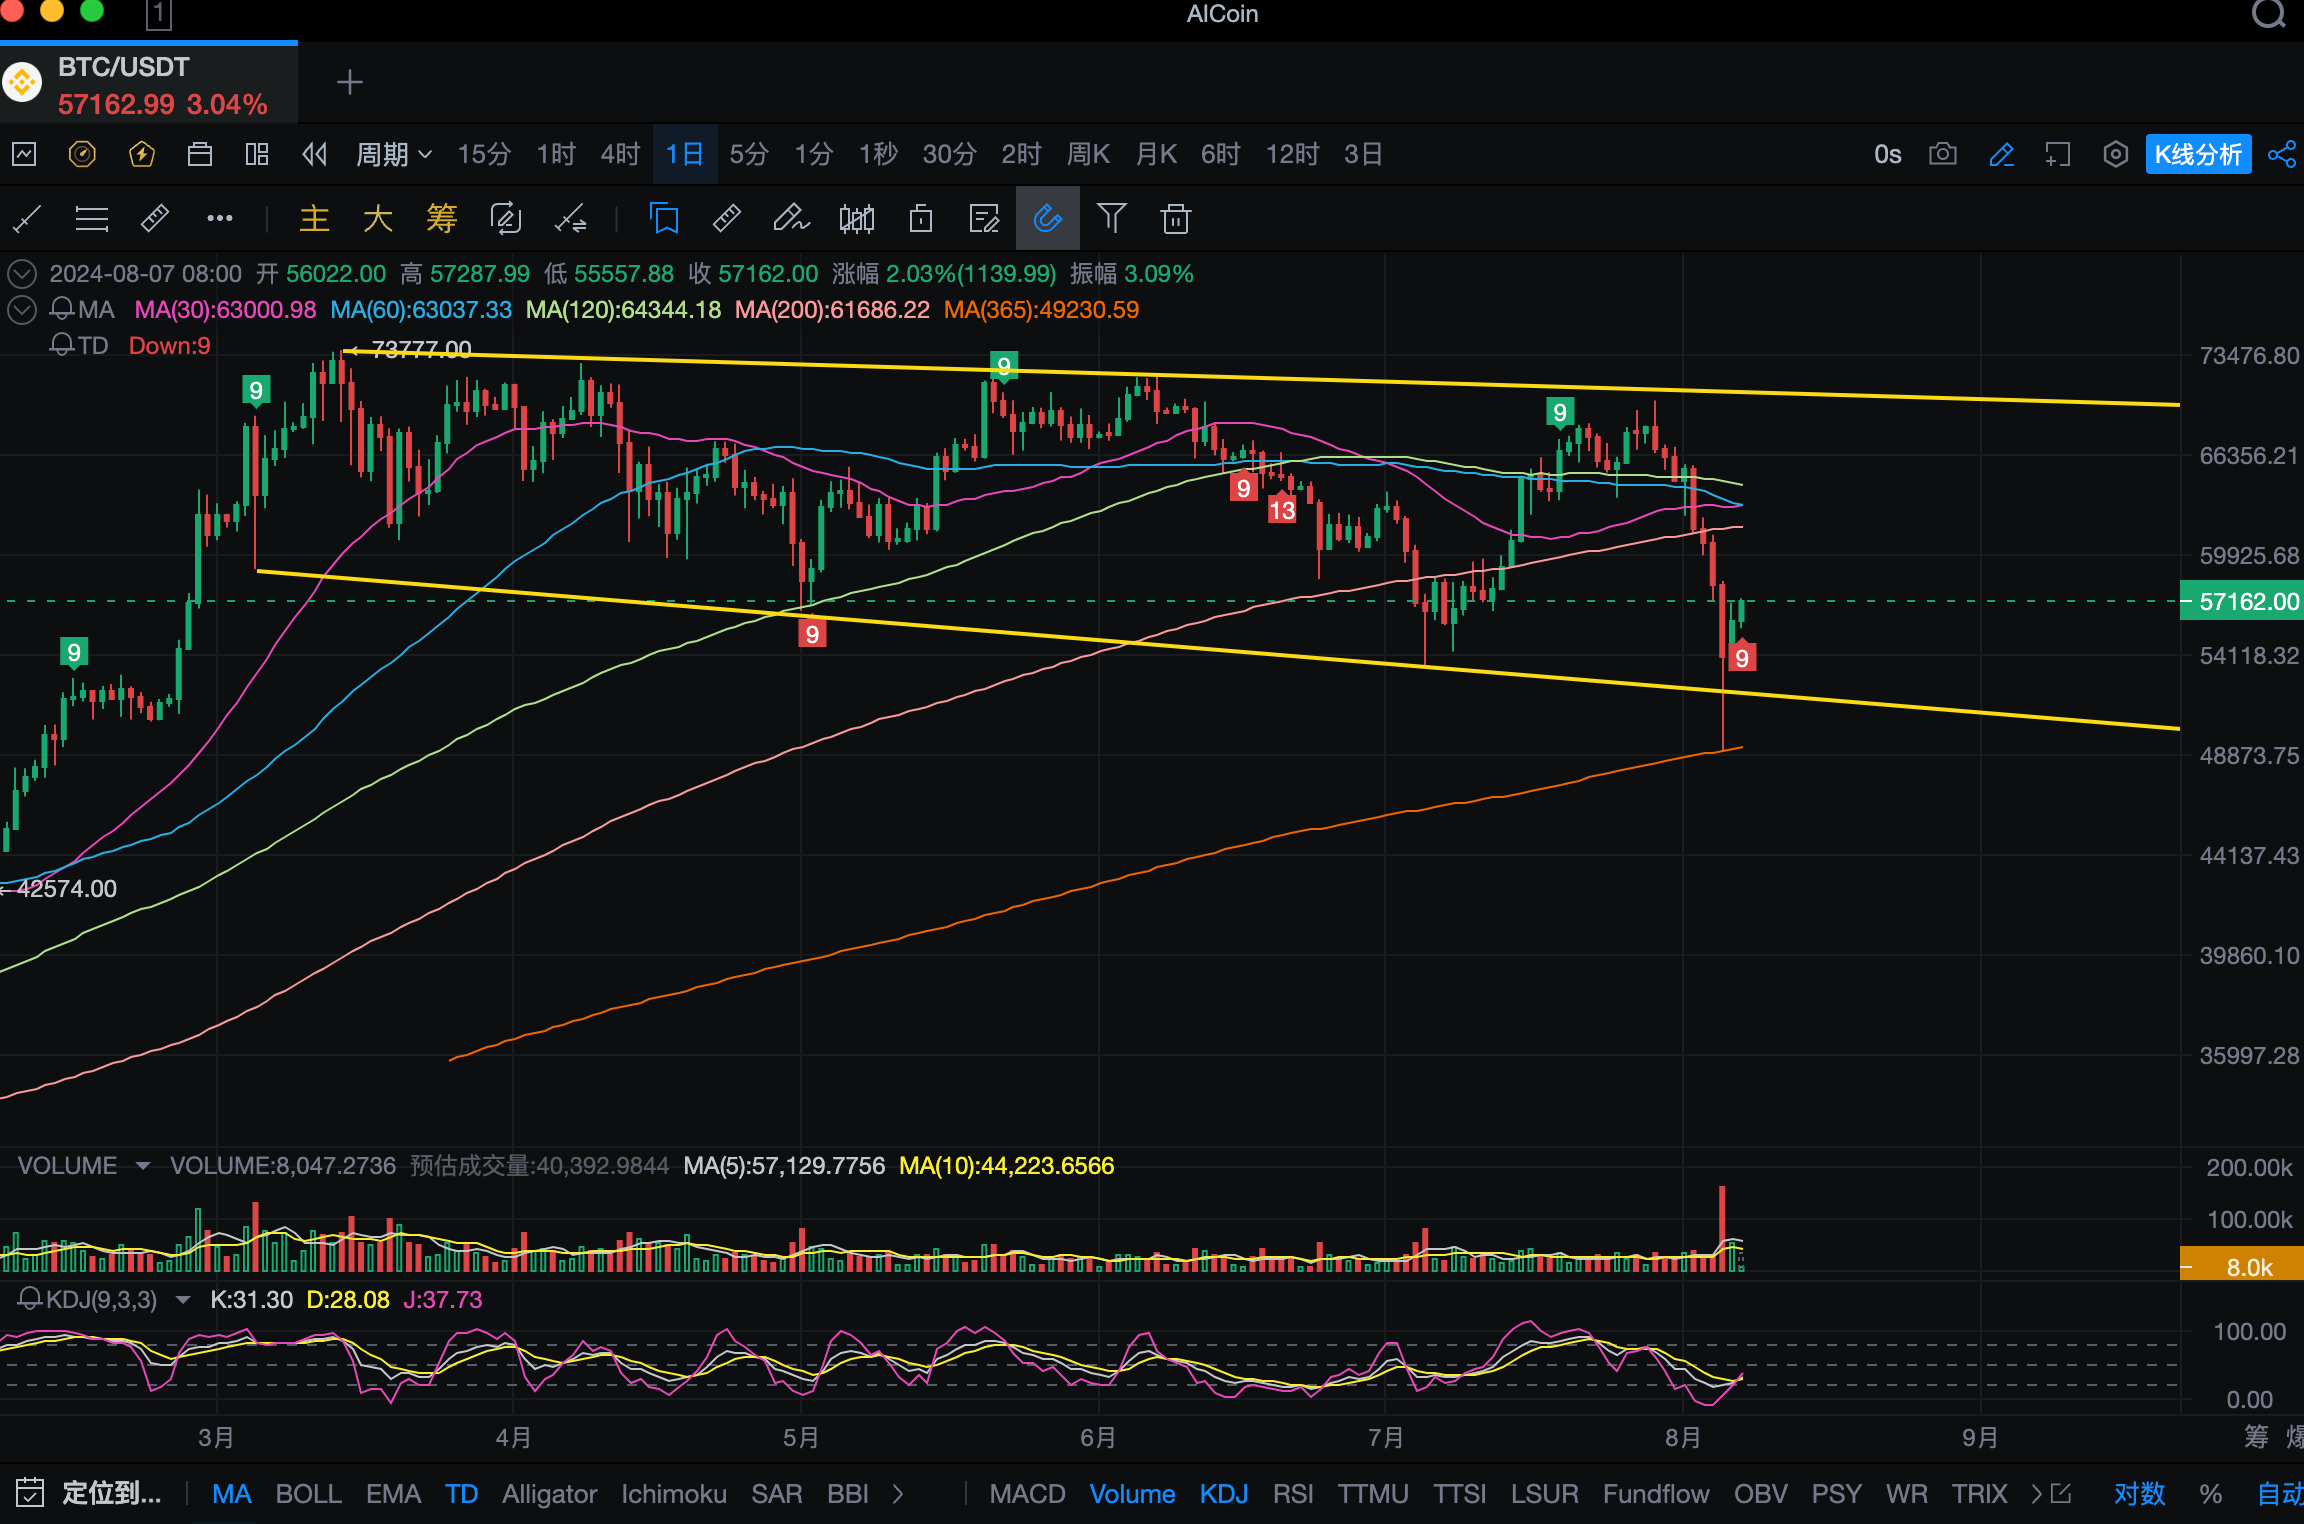
Let's talk about the trend first. The daily chart has continuously broken through the MA30/60/120/200 and other multi-period moving averages, undoubtedly in a bearish trend, but it has found support near the annual line, MA365, currently around $49,080, and a rebound has occurred.
From the daily chart's trading volume, there was a significant increase in volume on Monday, far exceeding the trading volume at the historical high of $73,777, and the selling pressure reached a new high since March 23, 1999. The bearish sentiment has been largely released. According to the logic of "volume precedes price," this may also indicate the bottom of the medium-term stage.
After breaking through the lower channel in the short term on Monday, it quickly recovered above the recent closing price, which was below the lower channel. Based on the previous three performances, there has been a relatively strong rebound after each touch of the lower channel or the second test. We can also expect a relatively strong rebound this time.
Currently, the TD sequence has shown a 9-turn signal, and the KDJ indicator is about to form a golden cross signal, which is conducive to boosting market confidence. It is expected that this rebound may continue for a period of time.
Four-hour Level:
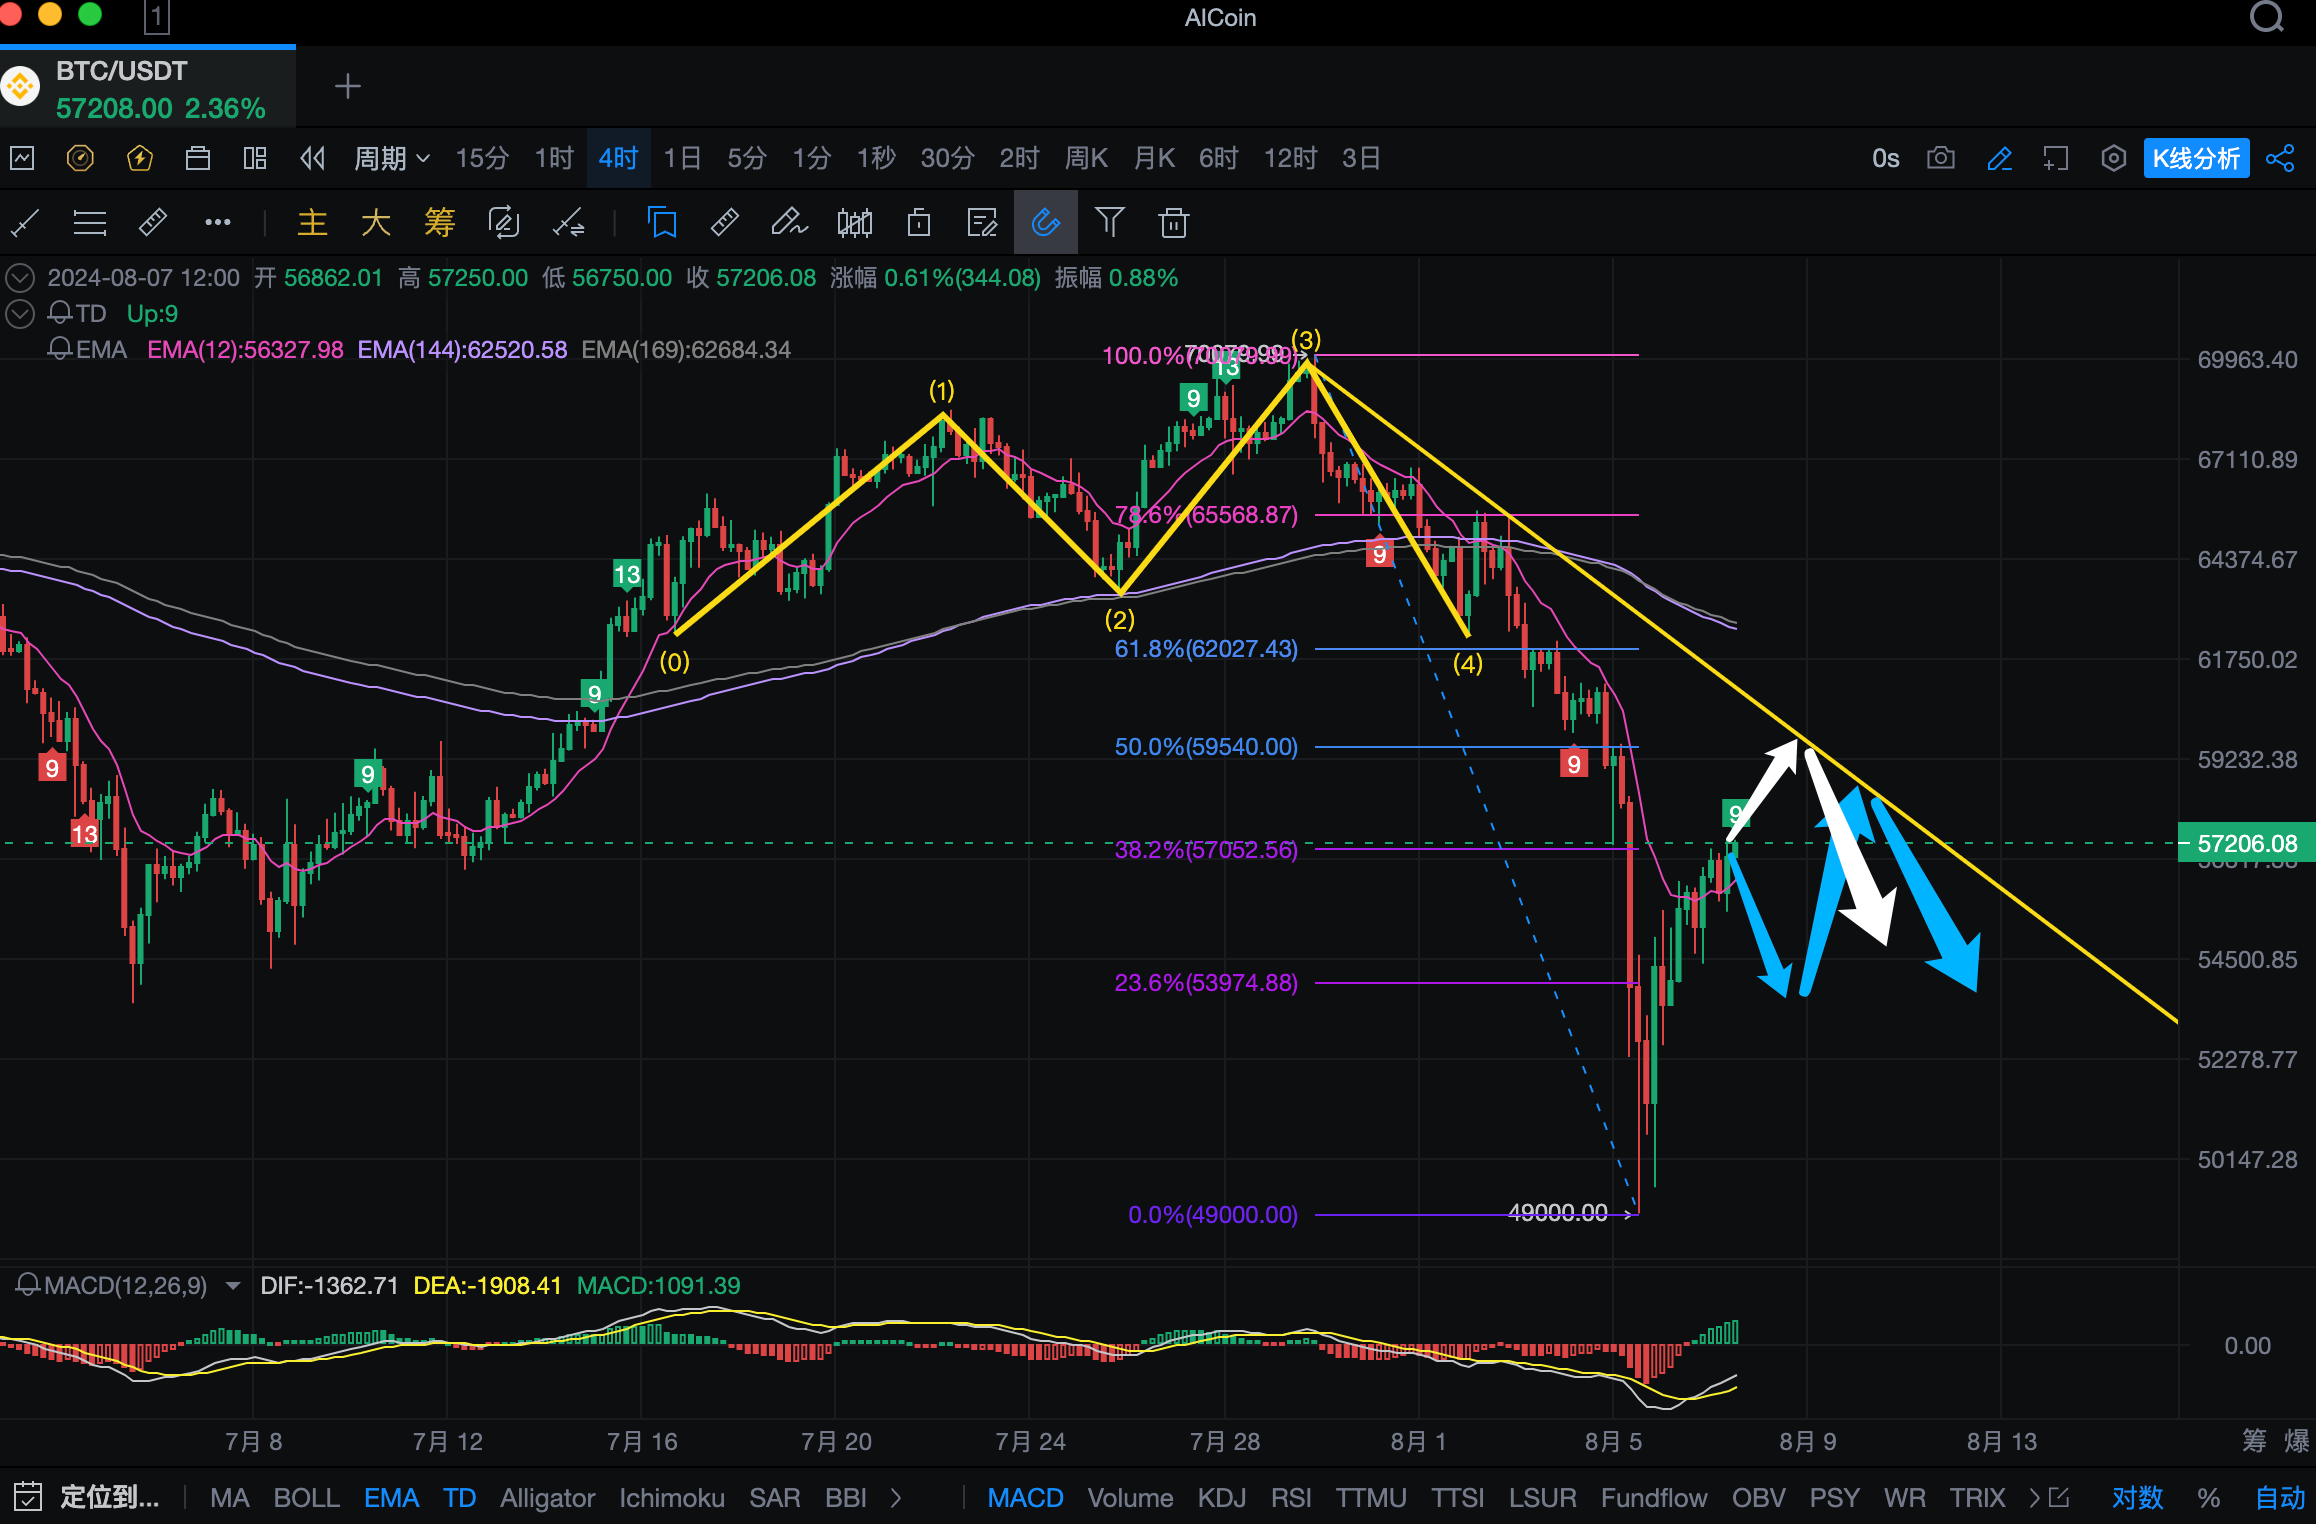
The four-hour MACD of BTC continues the rebound in a golden cross state. It has reached the Fibonacci 38.2% level, around $57,050, with a small upward breakthrough. It still needs to be observed. The resistance above can be referenced at 50%, around $59,540, which is also the potential resistance of the descending trend line. In addition, there is also 61.8%, around $62,027.5, which is the resonant resistance level of the Vegas channel. These resistance levels can be considered for partial shorting, or as reference for key stop-loss for short positions and profit-taking for long positions.
We have predicted two possible trends: because the TD sequence has shown a 9-turn signal, it may start to pull back near the Fibonacci 38.2% resistance, which is the blue line trend; if it breaks through, it may encounter resistance near 50% or 61.8%, which is the white line trend, and can be used as a trading reference.
The short-term support below can be referenced at Fibonacci 23.6%, around $53,975, as well as the retracement position near $52,555 after the rebound on Monday, and the important support near the area of the recent low and the second low, around $49,000-$49,550. This can be used as a reference for profit-taking targets for short positions, stop-loss reference for long positions, or as a reference for auxiliary buying on the left side.
In summary, the weekly and daily charts are still in a bearish trend, and BTC is rebounding at a key support level, presenting a short-term bottom signal. The four-hour level needs to pay attention to the gain or loss of resistance above and support below as a trading reference. Continue to focus on shorting, with auxiliary long positions.
免责声明:本文章仅代表作者个人观点,不代表本平台的立场和观点。本文章仅供信息分享,不构成对任何人的任何投资建议。用户与作者之间的任何争议,与本平台无关。如网页中刊载的文章或图片涉及侵权,请提供相关的权利证明和身份证明发送邮件到support@aicoin.com,本平台相关工作人员将会进行核查。


