Macro News Interpretation:
① Last night, the ISM non-manufacturing PMI index announced by the United States at 10 p.m. rose from 48.8 to 51.4, exceeding expectations. We may not usually pay much attention to this data, but in the extreme panic atmosphere yesterday, the PMI index seemed to bring a glimmer of hope to the market, alleviating investors' concerns about economic recession, and the U.S. stock market also rebounded, which in turn affected BTC to start rebounding from below $50,000.
② Last night, Chicago Fed President Guersby mentioned in his speech that the Fed would not overreact. Let's also discuss that Guersby has always been a representative of the dovish faction of the Fed, so even the most dovish individuals did not hint at a rate cut, indicating the relatively firm attitude of the Fed. As a result of this statement, the probability of a 50 basis point rate cut in September, as indicated by the Fed's observation tool, has decreased from 100% to 83%. This means that the Fed does not believe that the current monetary policy will cause the U.S. economy to collapse, and it is still relatively healthy, which has also boosted market sentiment to some extent, and this is also one of the factors for the market rebound.
Data Analysis:

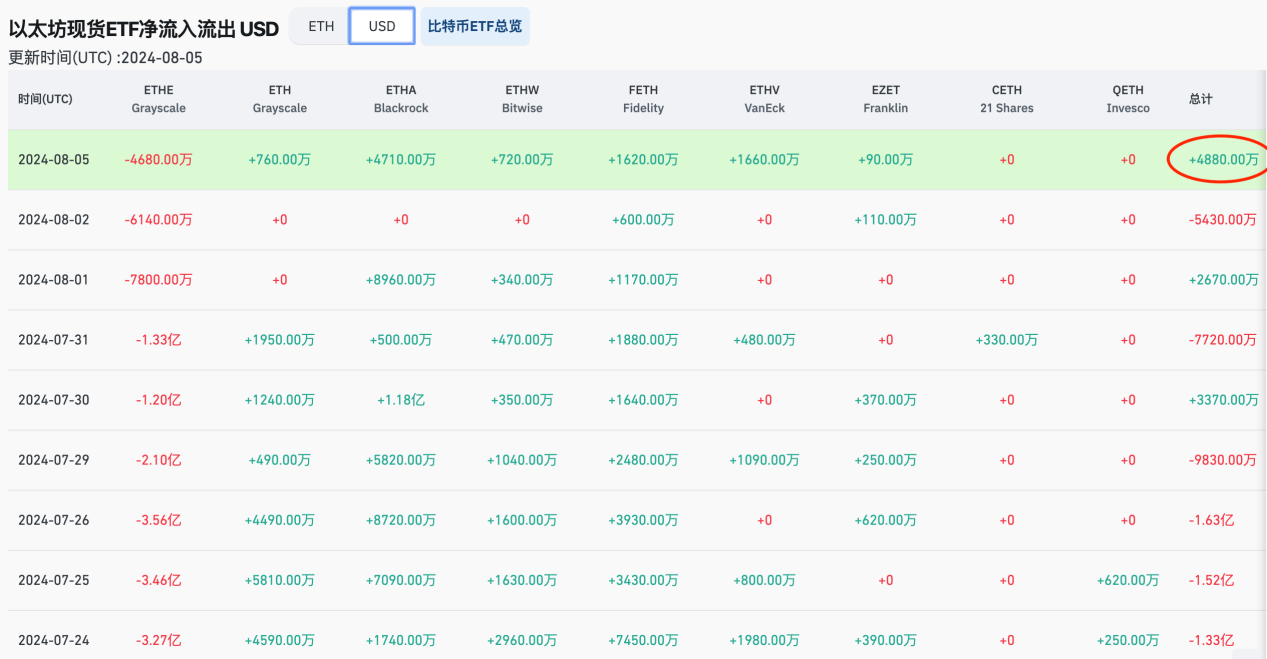
① The net inflow of the U.S. spot Ethereum ETF was $48.8 million yesterday.
② Looking at the overall trend of fund flows during this period, there has been a continuous net outflow for four trading days since July 24, with a barely net inflow at the end of July, but then another outflow, alternating in this way. This indicates a slowing trend of outflows.
③ In terms of the scale of net outflows, it has gradually decreased from around $150 million in the early stage to around $50 million in the final outflow; and the scale of net inflows has also increased recently, from around $20-30 million to nearly $50 million, almost equivalent to the daily net outflow. This indicates that there may be a gradual shift from net outflows to net inflows, which is conducive to slowing down the decline in ETH prices and causing a rebound to some extent.
④ Grayscale's ETHE continues to experience net outflows, a situation similar to the previous GBTC. Moreover, it mostly belongs to arbitrage funds from the previous period, because before the official trading of the ETH spot ETF, Grayscale's ETHE has been in a state of -40% discount. With the ETF going live for trading, the discount has been eliminated, and arbitrage funds have started to sell on a large scale.
Technical Analysis:
ETH Technical Analysis
Weekly Level:

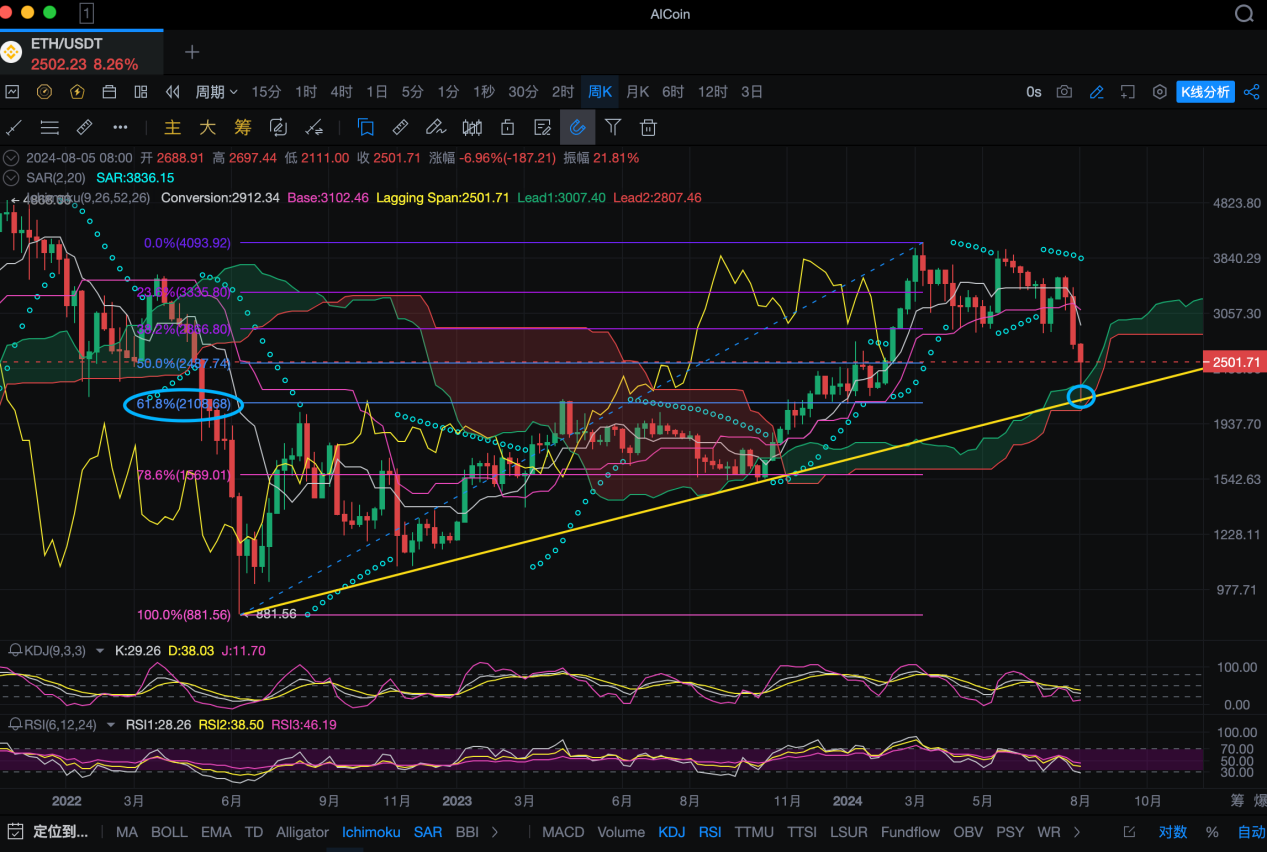
This week, the weekly K-line of ETH has dropped significantly, reaching near $2111 yesterday, erasing all the gains since January 1st of this year. $2100 is the starting point of the recent rally, and there is currently a rebound. We will analyze the key support below by combining indicators and trend lines.
The SAR indicator has been showing a bearish trend since July and has been gradually moving downward to the reversal point, currently near $3836. As long as the SAR indicator continues to move downward and fails to break through, the bearish trend will be maintained.
Looking at the Fibonacci sequence, the recent low of the decline is close to the 61.8% level of the previous bull market, near $2108.7, where a rebound occurred (i.e., from the low of $881.5 in June 2022 to the high of $4094 this year). $2100 is also crucial, and as long as it is not broken, the rebound will be maintained. If it breaks, the next major support below will be around 78.6%, near $1570.
In logarithmic coordinates, near $2100 is the support line of the uptrend since $881.5 (solid yellow line), and it is also a resonant support position predicted by the leading band of the Ichimoku indicator (combination of red and green lines).
The KDJ indicator shows that the J value has reached the oversold zone and is flattening at a low level, indicating a possible rebound in the future. However, looking at the RSI indicator, only the fast line has entered the oversold zone, while the medium and slow lines have not yet reached the oversold zone, so using both indicators together will provide a more accurate judgment. It is expected that the probability of a rebound will increase after the oscillation adjustment moves into the oversold zone.
Daily Level:

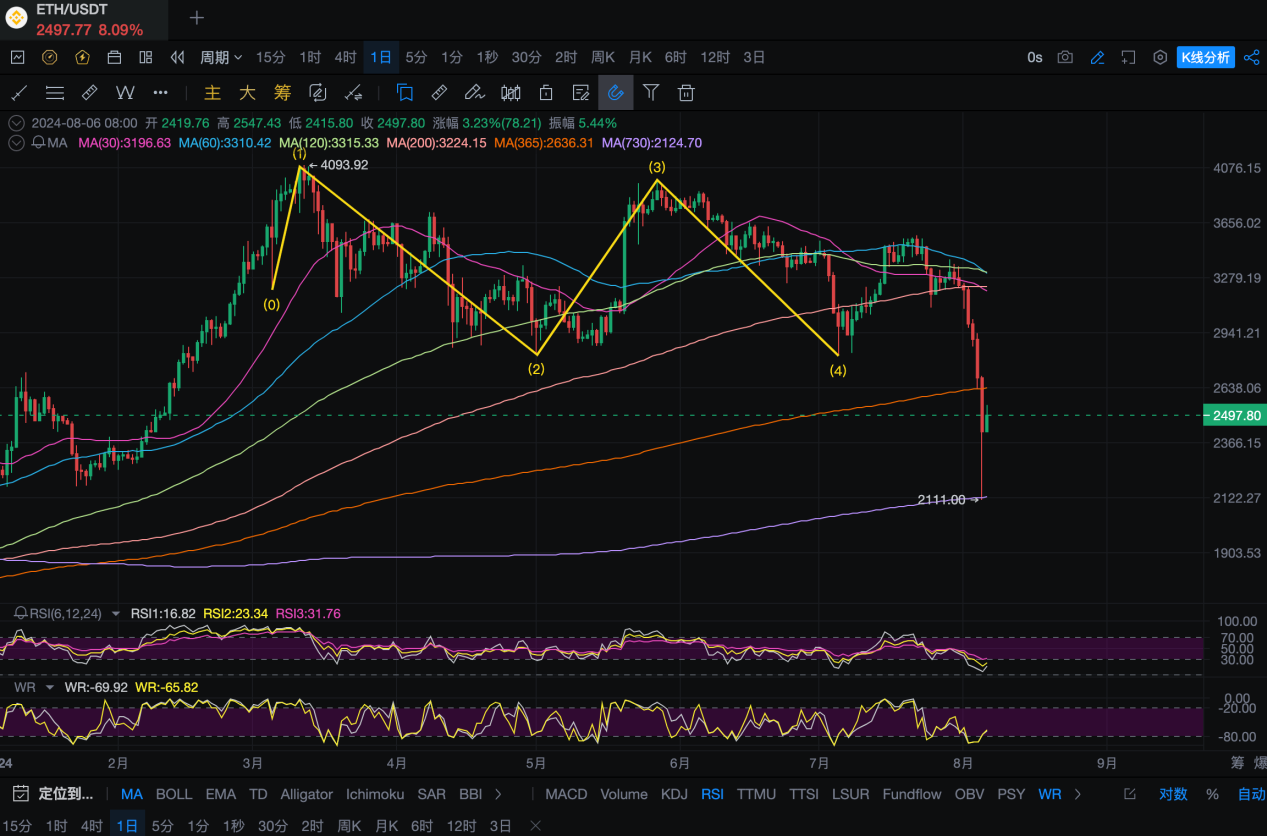
Looking at the daily chart, ETH broke below the previous daily M-top pattern's neckline, around $2810-2865, over the weekend, which has now turned into a platform resistance.
The daily chart has continuously broken through the MA30/60/120/200/365 and other multi-period moving averages, especially the MA120 and MA200, which are important bull-bear dividing lines in the previous period. The annual support MA365 has also failed to hold (from this perspective, it is clearly weaker than BTC, rebounding near the MA365 at around $49,000), and breaking through will make the market sentiment relatively more fearful. The next support below is the two-year line, MA730, currently near $2124.7.
Today, the fear and greed index has dropped to around 17, a new low since July 2022, indicating extreme fear in the market. Every time the value is extremely low, there will be a certain rebound, and a strong rebound occurred after we hinted at it yesterday. When others are fearful, I am greedy. The index has a certain lag and reflects yesterday's sentiment, so we can anticipate it in advance and enter the market in ambush.
The RSI indicator shows that all three lines entered the oversold zone yesterday, and are currently turning upward. In addition, the Williams %R indicator entered the oversold zone and also turned upward in advance, indicating that the rebound may continue.
The short-term resistance above is near the annual line MA365, around $2637, and the resistance near the rebound high of $2772.7 and the double top neckline resistance near $2810-2865. Shorting on the rebound is the priority, with long positions as a secondary option.
Four-hour Level:

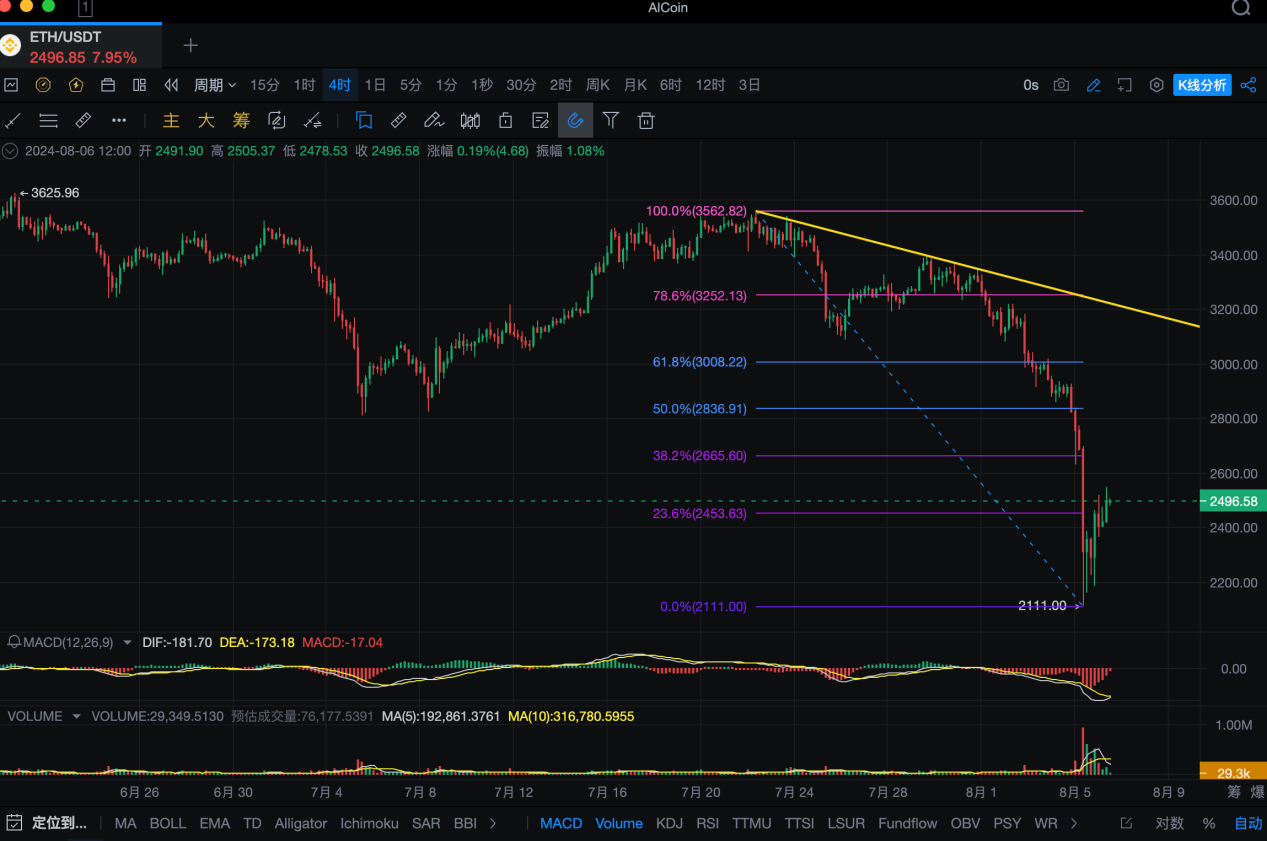
Looking at the four-hour chart, the MACD indicator's bearish momentum column continues to shrink, with signs of a golden cross at the bottom, indicating a possible continuation of the rebound in the short term.
The volume (vol) indicator showed a rare increase in volume on the four-hour chart during yesterday's decline, with high volume indicating high prices and low volume indicating low prices, which may also indicate a short-term bottom.
Currently, the resistance above is near the 38.2% and 50% Fibonacci levels of the recent decline, around $2666 and $2837. This is also the resonant resistance as the downward trend line gradually moves down.
The support below refers to the large single order data of the ETH contract's main force, with the short-term dense area currently near $2400 and $2200, and the secondary peak near $1900.
Follow us: Lao Li Mortar
免责声明:本文章仅代表作者个人观点,不代表本平台的立场和观点。本文章仅供信息分享,不构成对任何人的任何投资建议。用户与作者之间的任何争议,与本平台无关。如网页中刊载的文章或图片涉及侵权,请提供相关的权利证明和身份证明发送邮件到support@aicoin.com,本平台相关工作人员将会进行核查。


