This article is exclusively analyzed by Baiqi & Guanyuyu, representing the exclusive viewpoints of Baiqi & Guanyuyu. They have in-depth research and practical experience in BTC, ETH, and various altcoins. Due to the timing of the article, the following viewpoints and suggestions are not real-time and are for reference only. Please bear the risks and indicate the source when reposting. Reasonably control your position when trading, and avoid heavy or full positions. For more cryptocurrencies and spot strategies, please follow the official account.
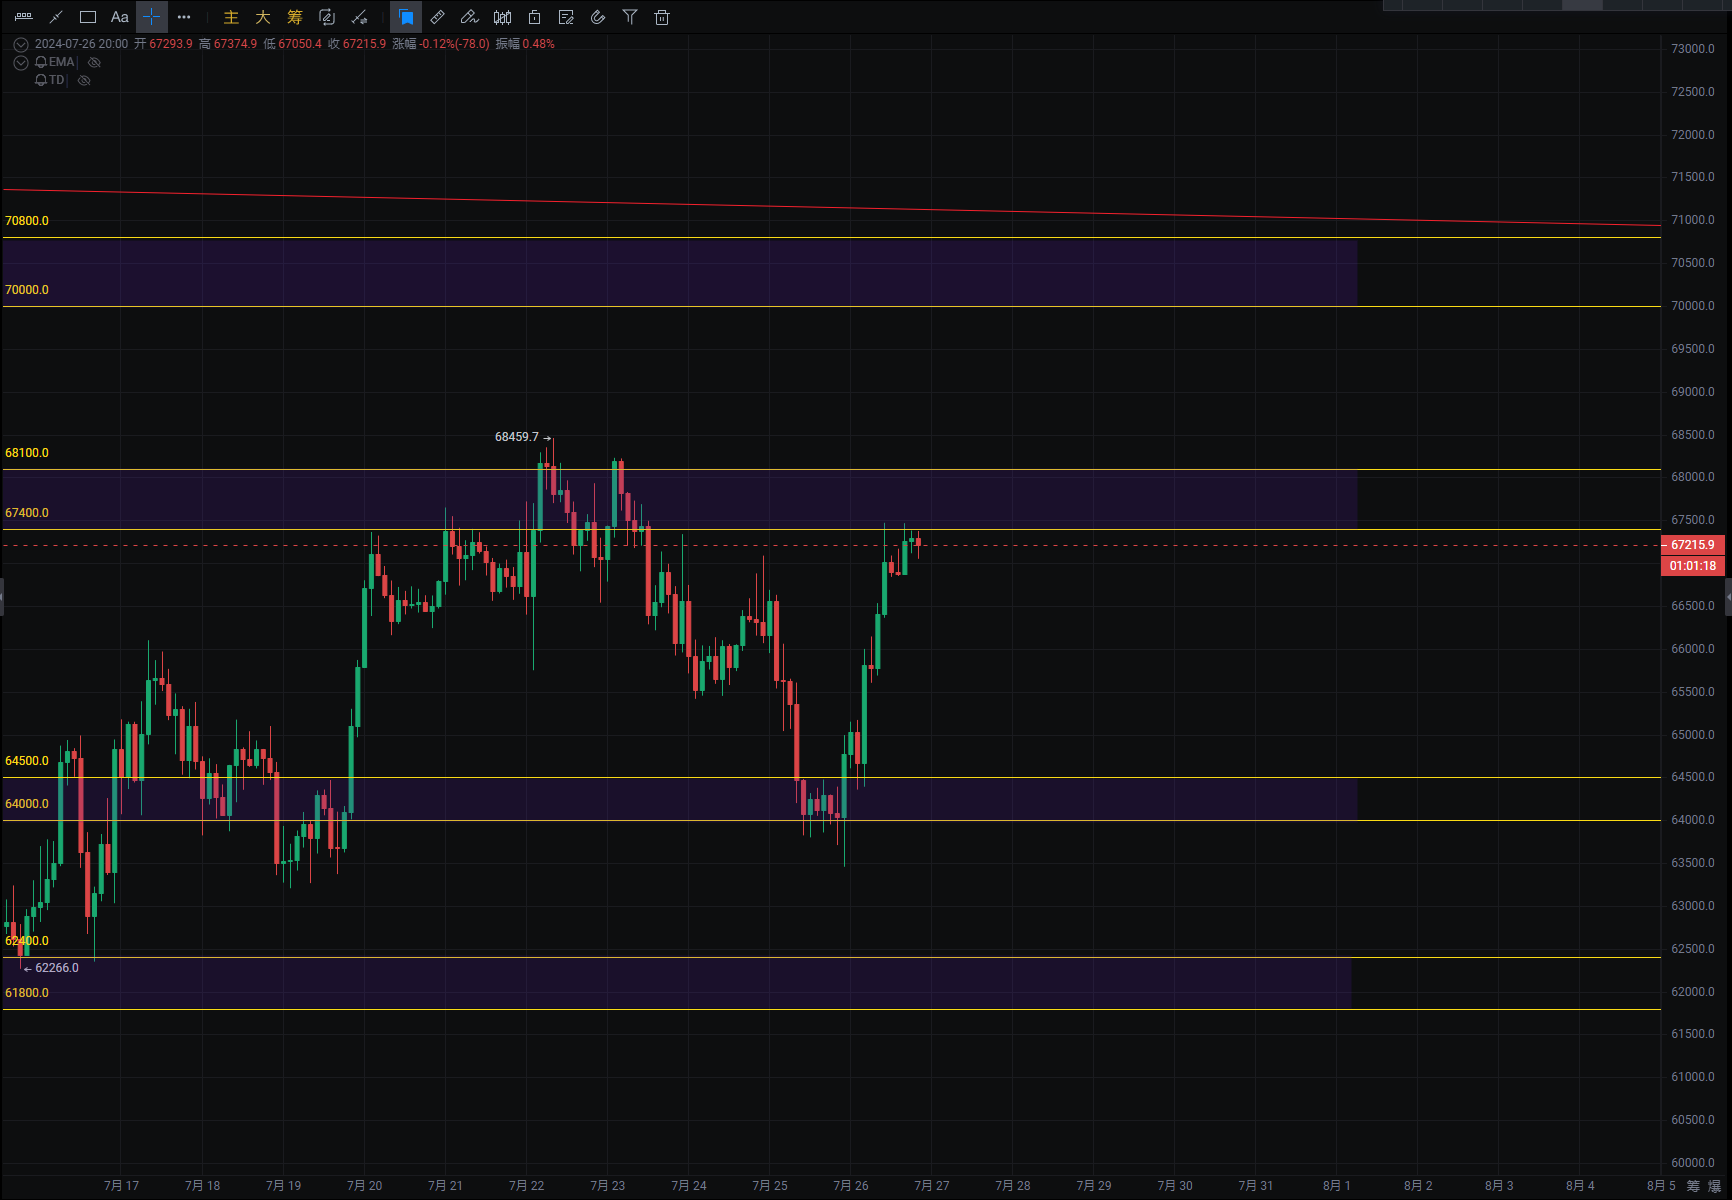
BTC
Yesterday's Review: The 2-hour chart formed a horizontal bottom structure yesterday, hitting a new low after a false breakthrough, followed by a rapid 4000-point surge.
Recent Focus: Watch the range of 67400-68100 on the upside and the support range of 64500-64000 on the downside.
Structural Form: The daily chart formed a bullish engulfing pattern (closed at 8 am) and a modified bottom pattern (closed at 0 am). After the V-shaped reversal on the 2-hour chart, it has formed a double-pin top pattern.
Points to Note: Resistance at the range of 67400-68100, breakthrough may accelerate the upward movement. Pay attention to the pressure range of 70000-70700. If the rebound fails to break through, it may accelerate the downward movement, with focus on the range of 64500-64000 on the downside.
Trading Ideas<<<<<<
Long: Buy in the range of 64500-64000 on a pullback without breaking through, and go long when a bottom pattern signal appears on the 5-minute or 30-minute chart.
Long: Buy in the range of 62400-61800 on a pullback without breaking through, and go long when a bottom pattern signal appears on the 5-minute or 30-minute chart.
Short: Sell in the range of 67400-68100 on a rebound without breaking through, and go short when a top pattern signal appears on the 5-minute or 30-minute chart.
Short: Sell in the range of 70000-70700 on a rebound without breaking through, and go short when a top pattern signal appears on the 5-minute or 30-minute chart.
Key Focus: Resistance at the range of 67400-68100 on the upside, and support at the range of 64500-64000 on the downside.
Personal View:
Currently, the 2-hour chart has formed a high-level horizontal pattern with a double-pin top. If there is positive news (such as the Bitcoin conference), it may accelerate the test of the 70000 level.
The consecutive bearish trend on the daily chart aligns with our expectations. However, the rapid surge has provided a good shorting opportunity. If the range of 67400-68100 is broken, there may be a better entry point for shorting. Strictly manage position size in the volatile market and avoid going all in at any time.
A successful trader only seeks limited profits, so avoid trying to buy at the lowest or sell at the highest. Control greed and fear.
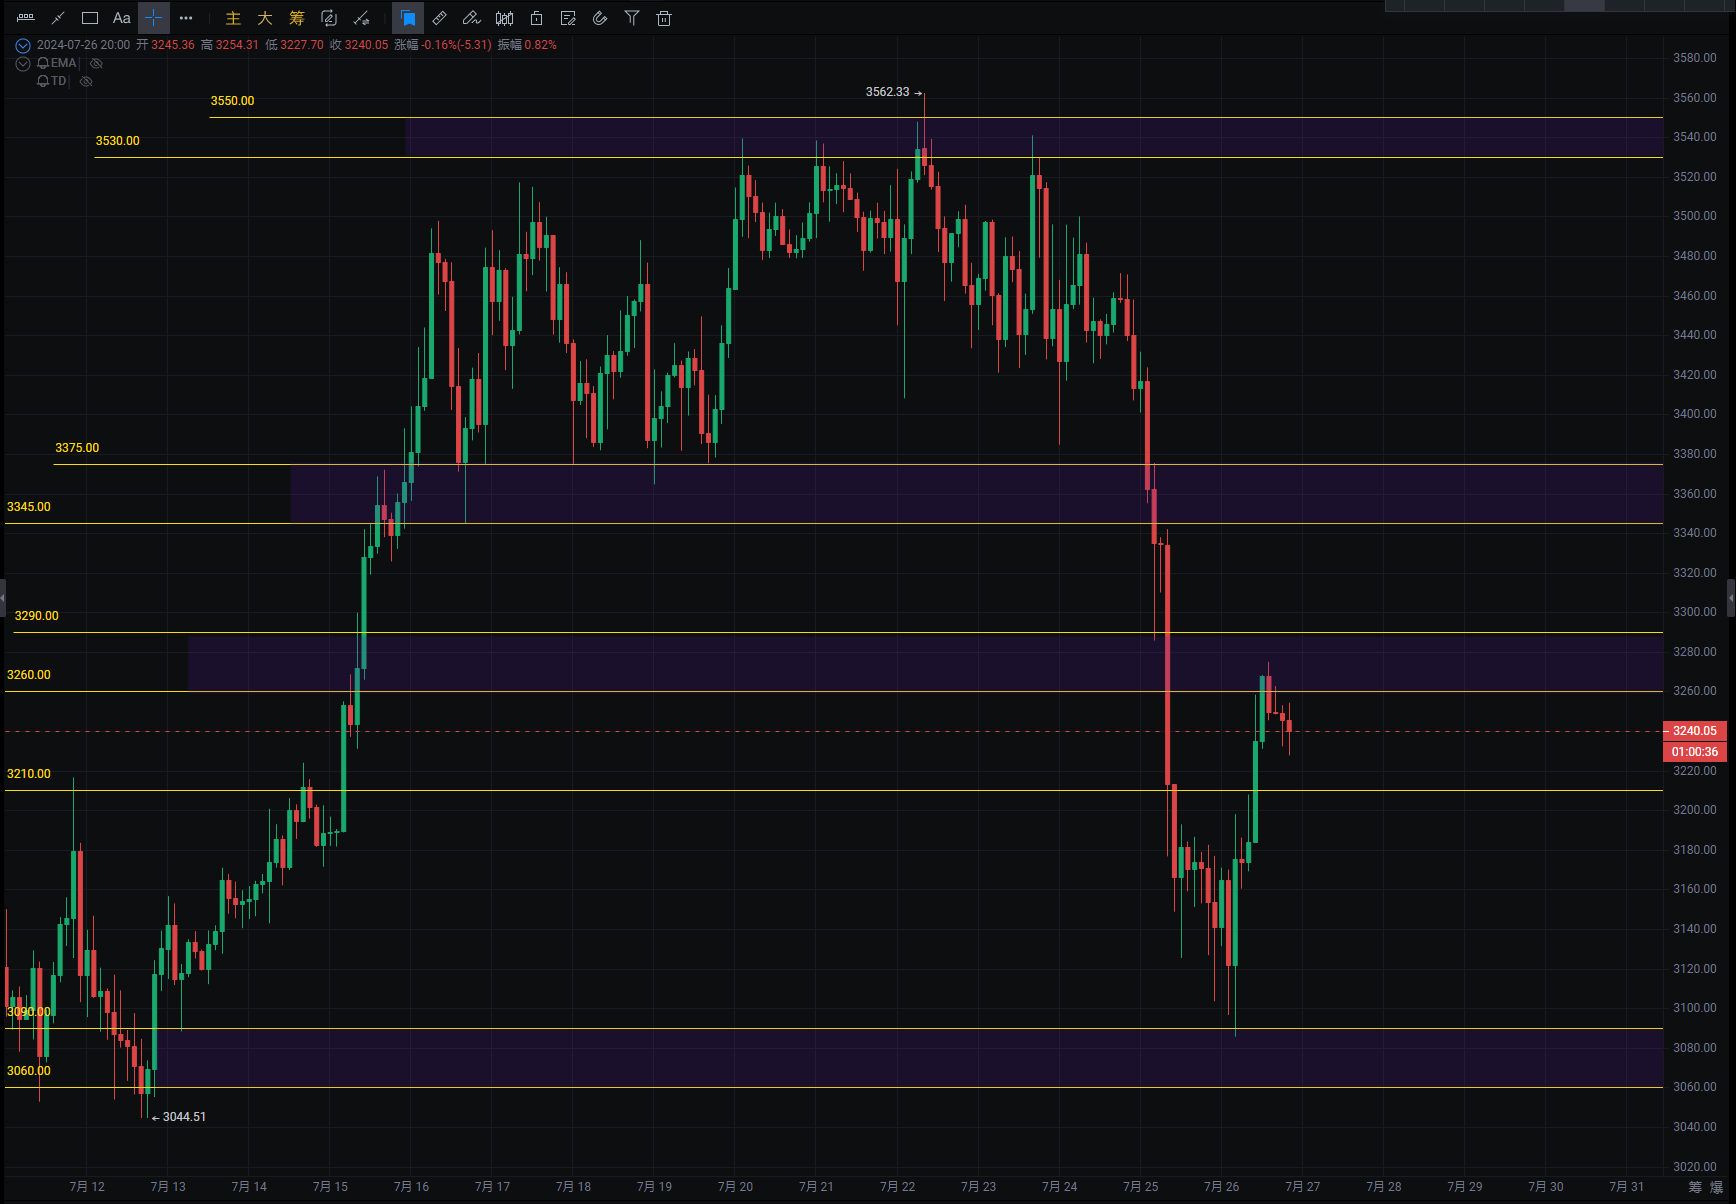
ETH
Yesterday's Review: After a downward oscillation trend on the 2-hour chart in the evening, a strong V-shaped reversal occurred after hitting a new low, and it is currently in a high-level horizontal phase.
Recent Focus: Watch the range of 3290-3260 on the upside and the range of 3090-3060 on the downside. The recent minor support level is at 3185.
Structural Form: The 2-hour chart shows a bearish 3+1 engulfing pattern.
Points to Note: Pay attention to the 2-hour chart closing, whether the 3+1 pattern is established, and the subsequent test of the high point. If not broken, it remains a bearish pattern. If there is a breakthrough, there may be an accelerated test of the resistance range of 3345-3375.
Trading Ideas<<<<<<
Short: Sell in the range of 3260-3290 on a rebound without breaking through, and go short when a top pattern signal appears on the 5-minute or 30-minute chart.
Short: Sell in the range of 3345-3375 on a rebound without breaking through, and go short when a top pattern signal appears on the 5-minute or 30-minute chart.
Long: Buy in the range of 3185-3165 on a pullback without breaking through, and go long when a bottom pattern signal appears on the 5-minute or 30-minute chart.
Long: Buy in the range of 3060-3090 on a pullback without breaking through, and go long when a bottom pattern signal appears on the 5-minute or 30-minute chart.
Key Focus: Resistance at 3290 and 3375, support at 3090.
Personal View:
The bullish candle on the daily chart indicates a short-term halt and rebound, testing the pressure area halfway of the previous large bearish candle, which aligns with the market's expectations. Pay close attention to whether the support range below is effective. Due to the selling pressure after the ETF positive news, there may be an accelerated downward trend, retesting the bottom range. When trading, focus on shorting during rebounds, and if considering bottom fishing, control position size and set stop-loss orders.
Always respect the market and make objective analysis. Trade what you see, not what you imagine.
In the highly volatile market, pay attention to position management.
A successful trader only seeks limited profits, so avoid trying to buy at the lowest or sell at the highest. Control greed and fear. Trading is a form of self-cultivation, so avoid impatience and restlessness. Slow down from within and enjoy life. Make peace with life and treat yourself well.
Analysis and strategies are time-sensitive. Please refer to real-time guidance on the official account!
[Friendly Reminder]: The above content is original work by Baiqi & Guanyuyu. Advertisements at the end of the article and in the comments section are unrelated to Baiqi & Guanyuyu. Please discern carefully. Thank you for your appreciation. Investors are welcome to follow Baiqi & Guanyuyu's WeChat official account for more real-time market analysis.

免责声明:本文章仅代表作者个人观点,不代表本平台的立场和观点。本文章仅供信息分享,不构成对任何人的任何投资建议。用户与作者之间的任何争议,与本平台无关。如网页中刊载的文章或图片涉及侵权,请提供相关的权利证明和身份证明发送邮件到support@aicoin.com,本平台相关工作人员将会进行核查。


