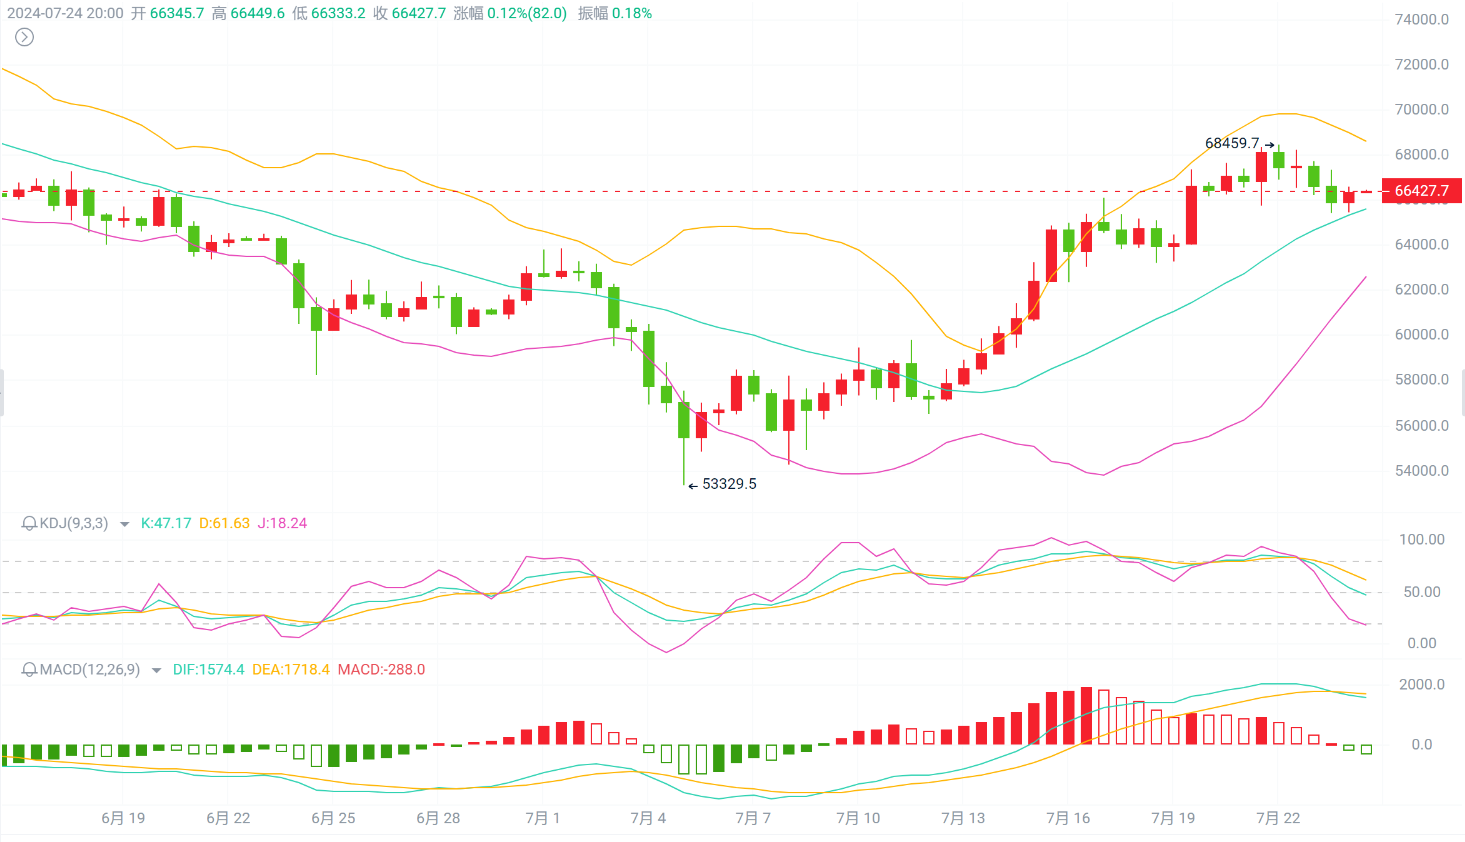
From a technical perspective, looking at the daily chart of Bitcoin/Ethereum, the current KDJ and MACD indicators are showing a continued shrinking volume of the bullish trend. The BOLL technical changes are also not significant, overall not much different from yesterday. In the main chart, the MA5 moving average line is showing a downward pressure, and the coin price is also closing below the MA5 moving average line, forming a bearish TD2 pattern. On the 12-hour chart, the current MACD is showing a bearish crossover at a high level, with the KDJ indicating a continued increase in bearish trading volume. In the BOLL chart, the current coin price is in a struggle to break through the midline. In the short term, we continue to expect a downward adjustment in a range-bound manner. For trading, it is advisable to consider a short position on a rebound. Specific reference points can be found below:
Bitcoin: Short at 67000-67500, target 65500
Ethereum: Short near 3500-3530, target 3420
The above is a personal intraday market analysis, first released on "Public Number: Mu Feng Looks at Trends". Welcome to exchange and learn together!

免责声明:本文章仅代表作者个人观点,不代表本平台的立场和观点。本文章仅供信息分享,不构成对任何人的任何投资建议。用户与作者之间的任何争议,与本平台无关。如网页中刊载的文章或图片涉及侵权,请提供相关的权利证明和身份证明发送邮件到support@aicoin.com,本平台相关工作人员将会进行核查。


