Title: AICoin
Macro News Analysis:
① This week, the focus will be on financial data and events, including the US second-quarter GDP on Thursday, the US core PCE price index for June and the opening of the Paris Olympics on Friday. There are also significant events in the cryptocurrency industry: the potential official trading launch of the Ethereum spot ETF on Tuesday, and the participation and speeches of Trump and Musk at the Bitcoin 2024 conference from Thursday to Saturday.
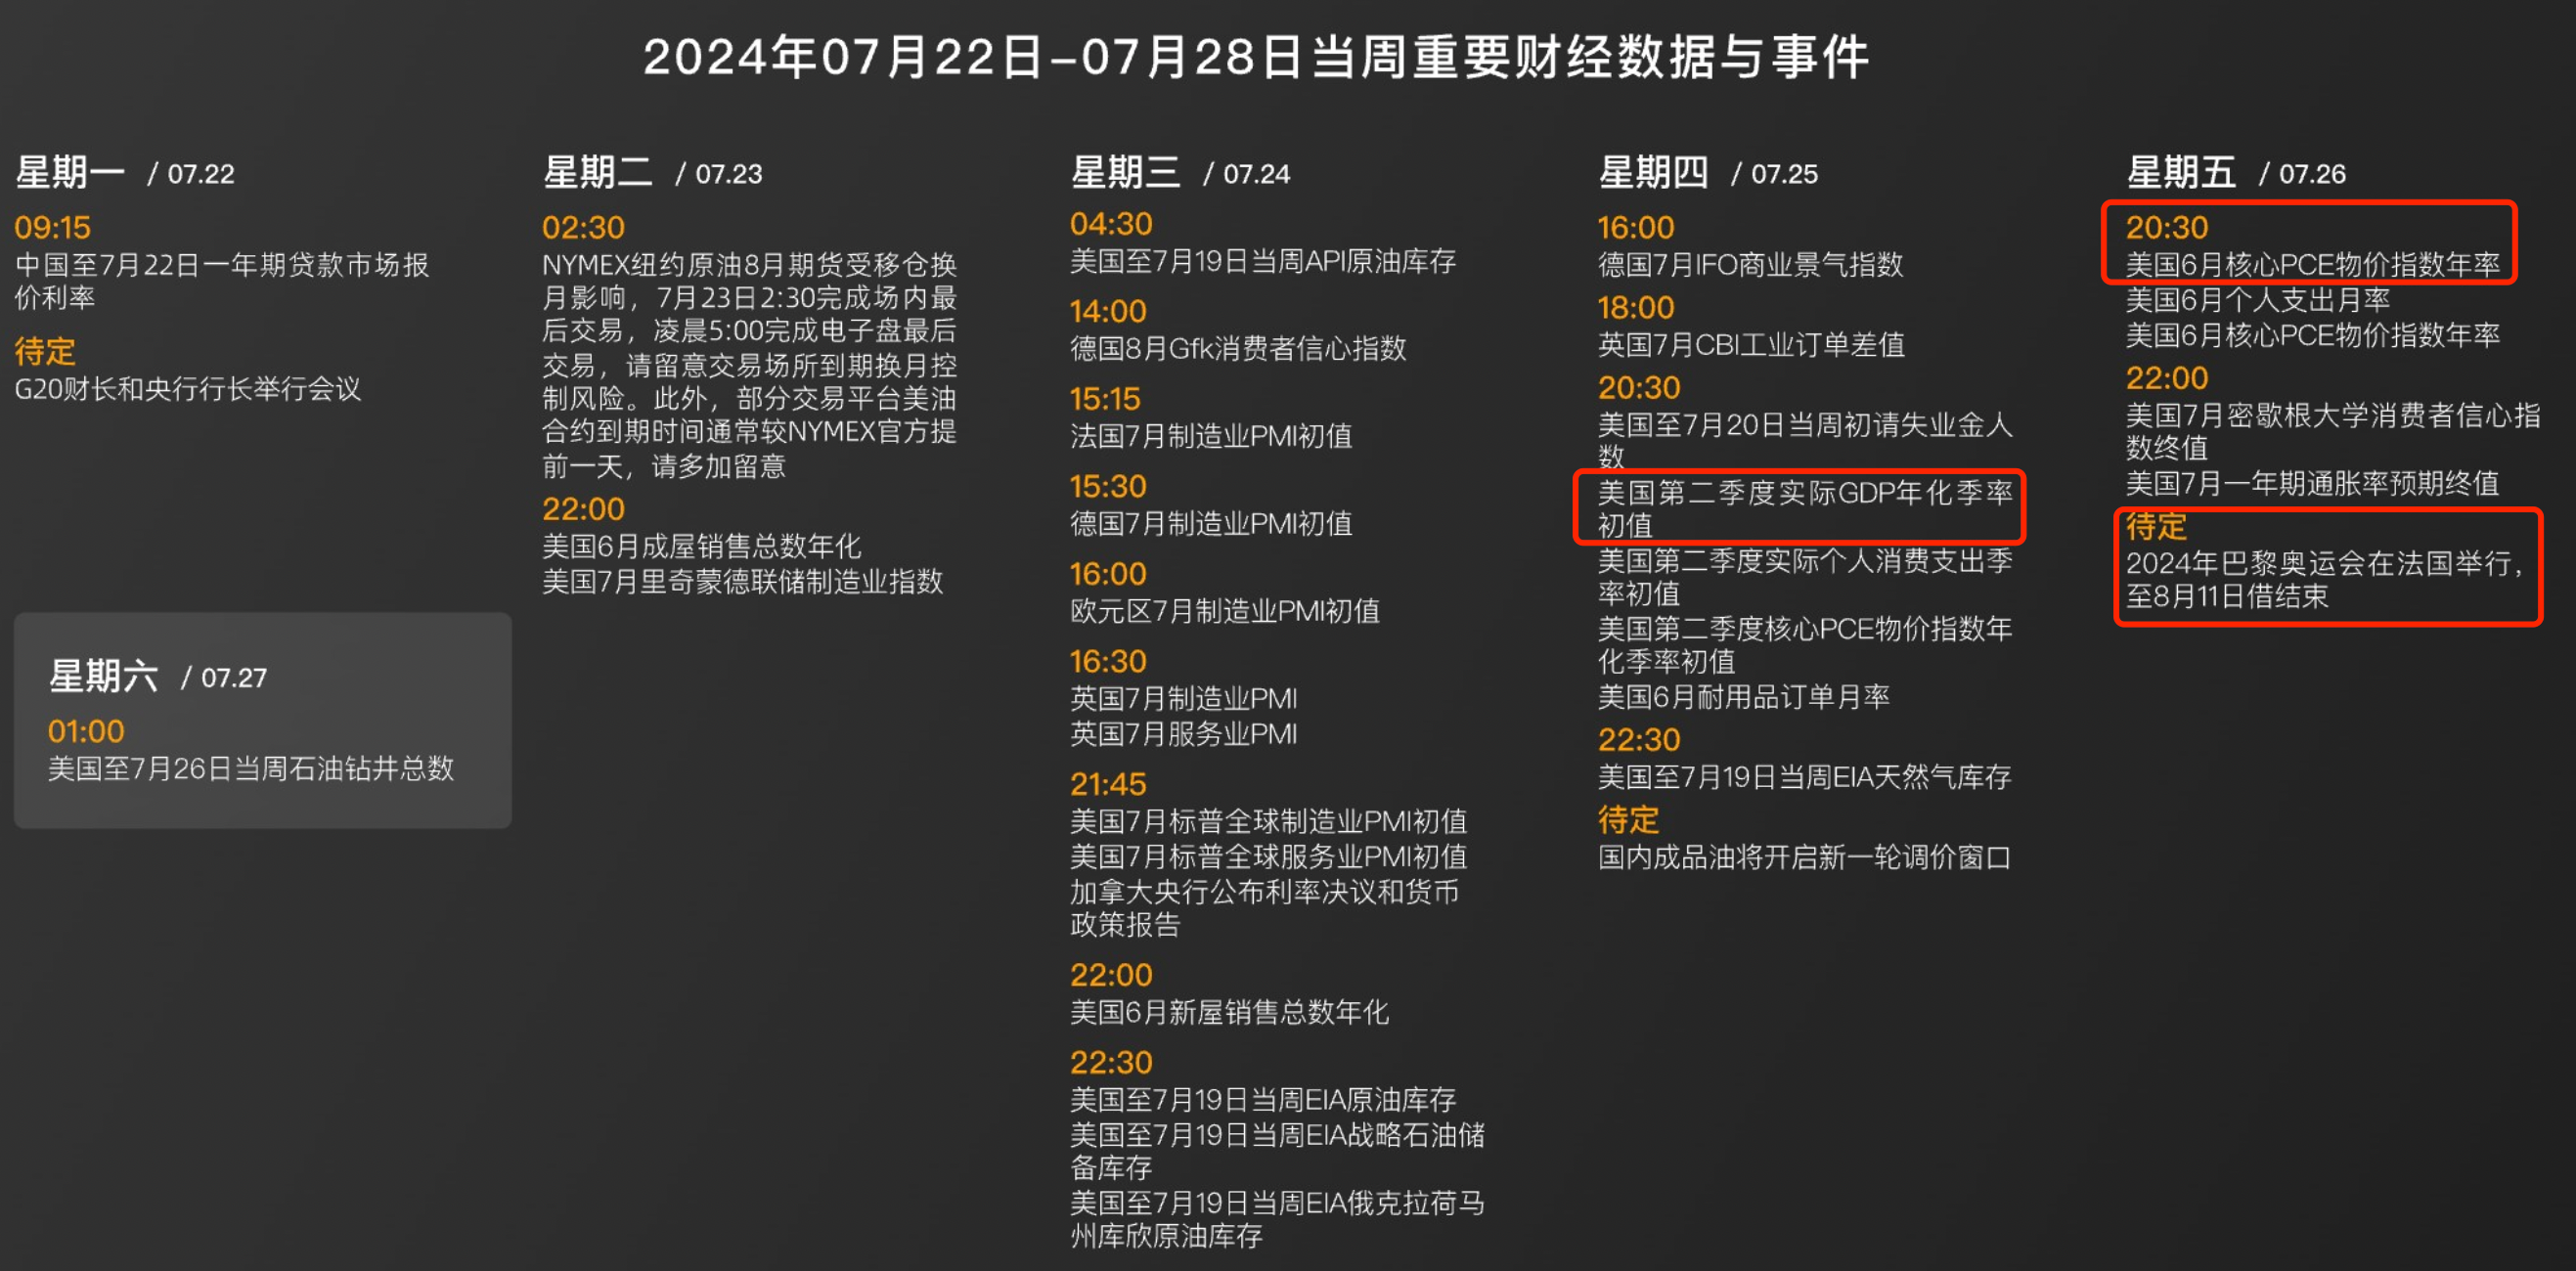
② Last week, due to the Trump assassination incident, both the US stock market and gold experienced initial increases, followed by three consecutive days of significant declines, with the S&P 500 posting its largest single-day drop in a year and a half, while the US dollar index recorded its largest increase since early June.
③ At 2 am this morning, Biden announced his withdrawal from the election. BTC initially fell and then rose. It is expected to have further impact on the cryptocurrency market in the future, so we need to pay more attention to the development and evolution of macro events.
BTC On-Chain Data Analysis:
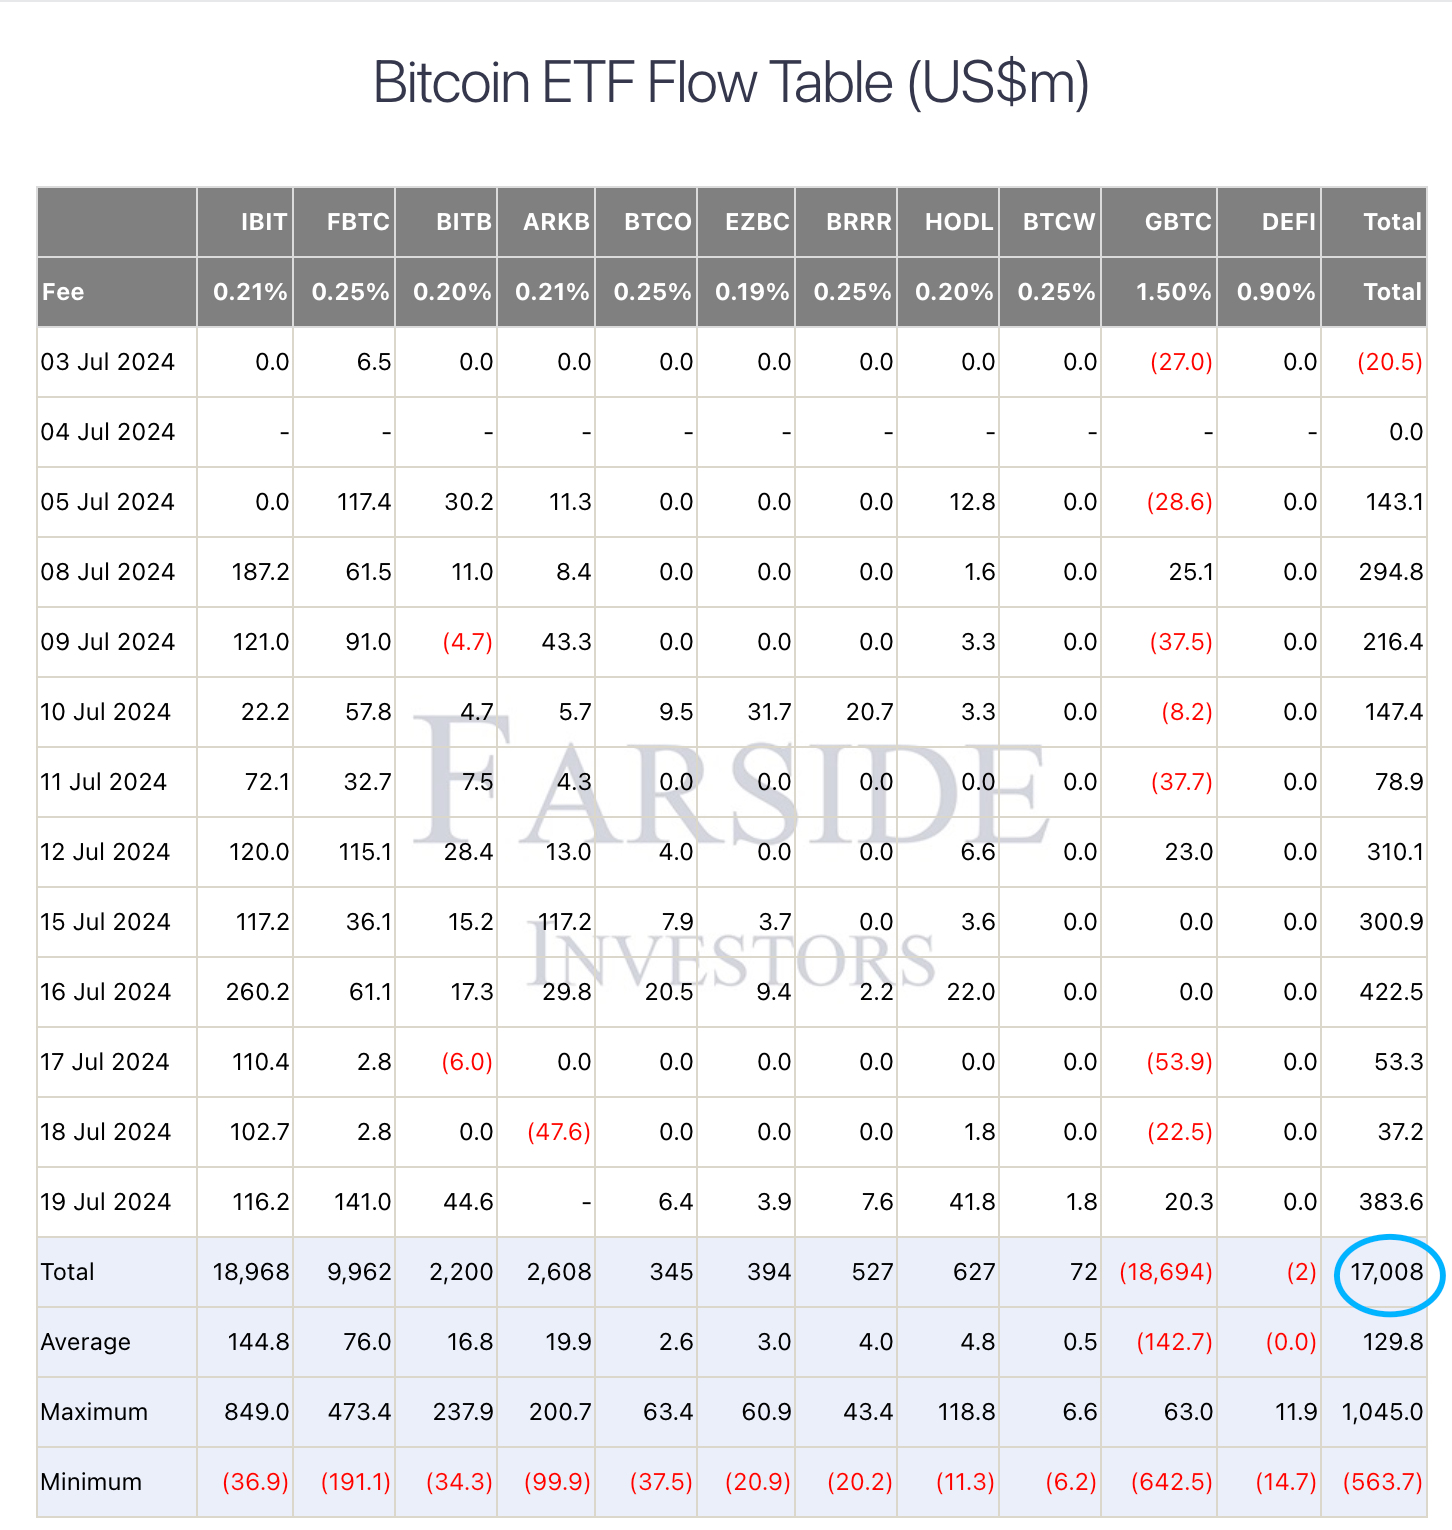
① The US Bitcoin spot ETF saw a net inflow of $1.196 billion last week, marking its third consecutive week of net inflows.
② The cumulative net inflow of the US Bitcoin spot ETF since its launch has reached $17.008 billion, continuing to set a new historical high.
③ With the continuous net inflow of ETF funds and the increase in long positions in contracts, BTC has been rising all the way. According to the current cumulative open interest of mainstream exchanges, if Bitcoin breaks through $70,000, an estimated $15.22 billion in short positions will be liquidated. If Bitcoin falls to $64,000, an estimated $13.82 billion in long positions will be liquidated.
Technical Analysis:
BTC Weekly Level:
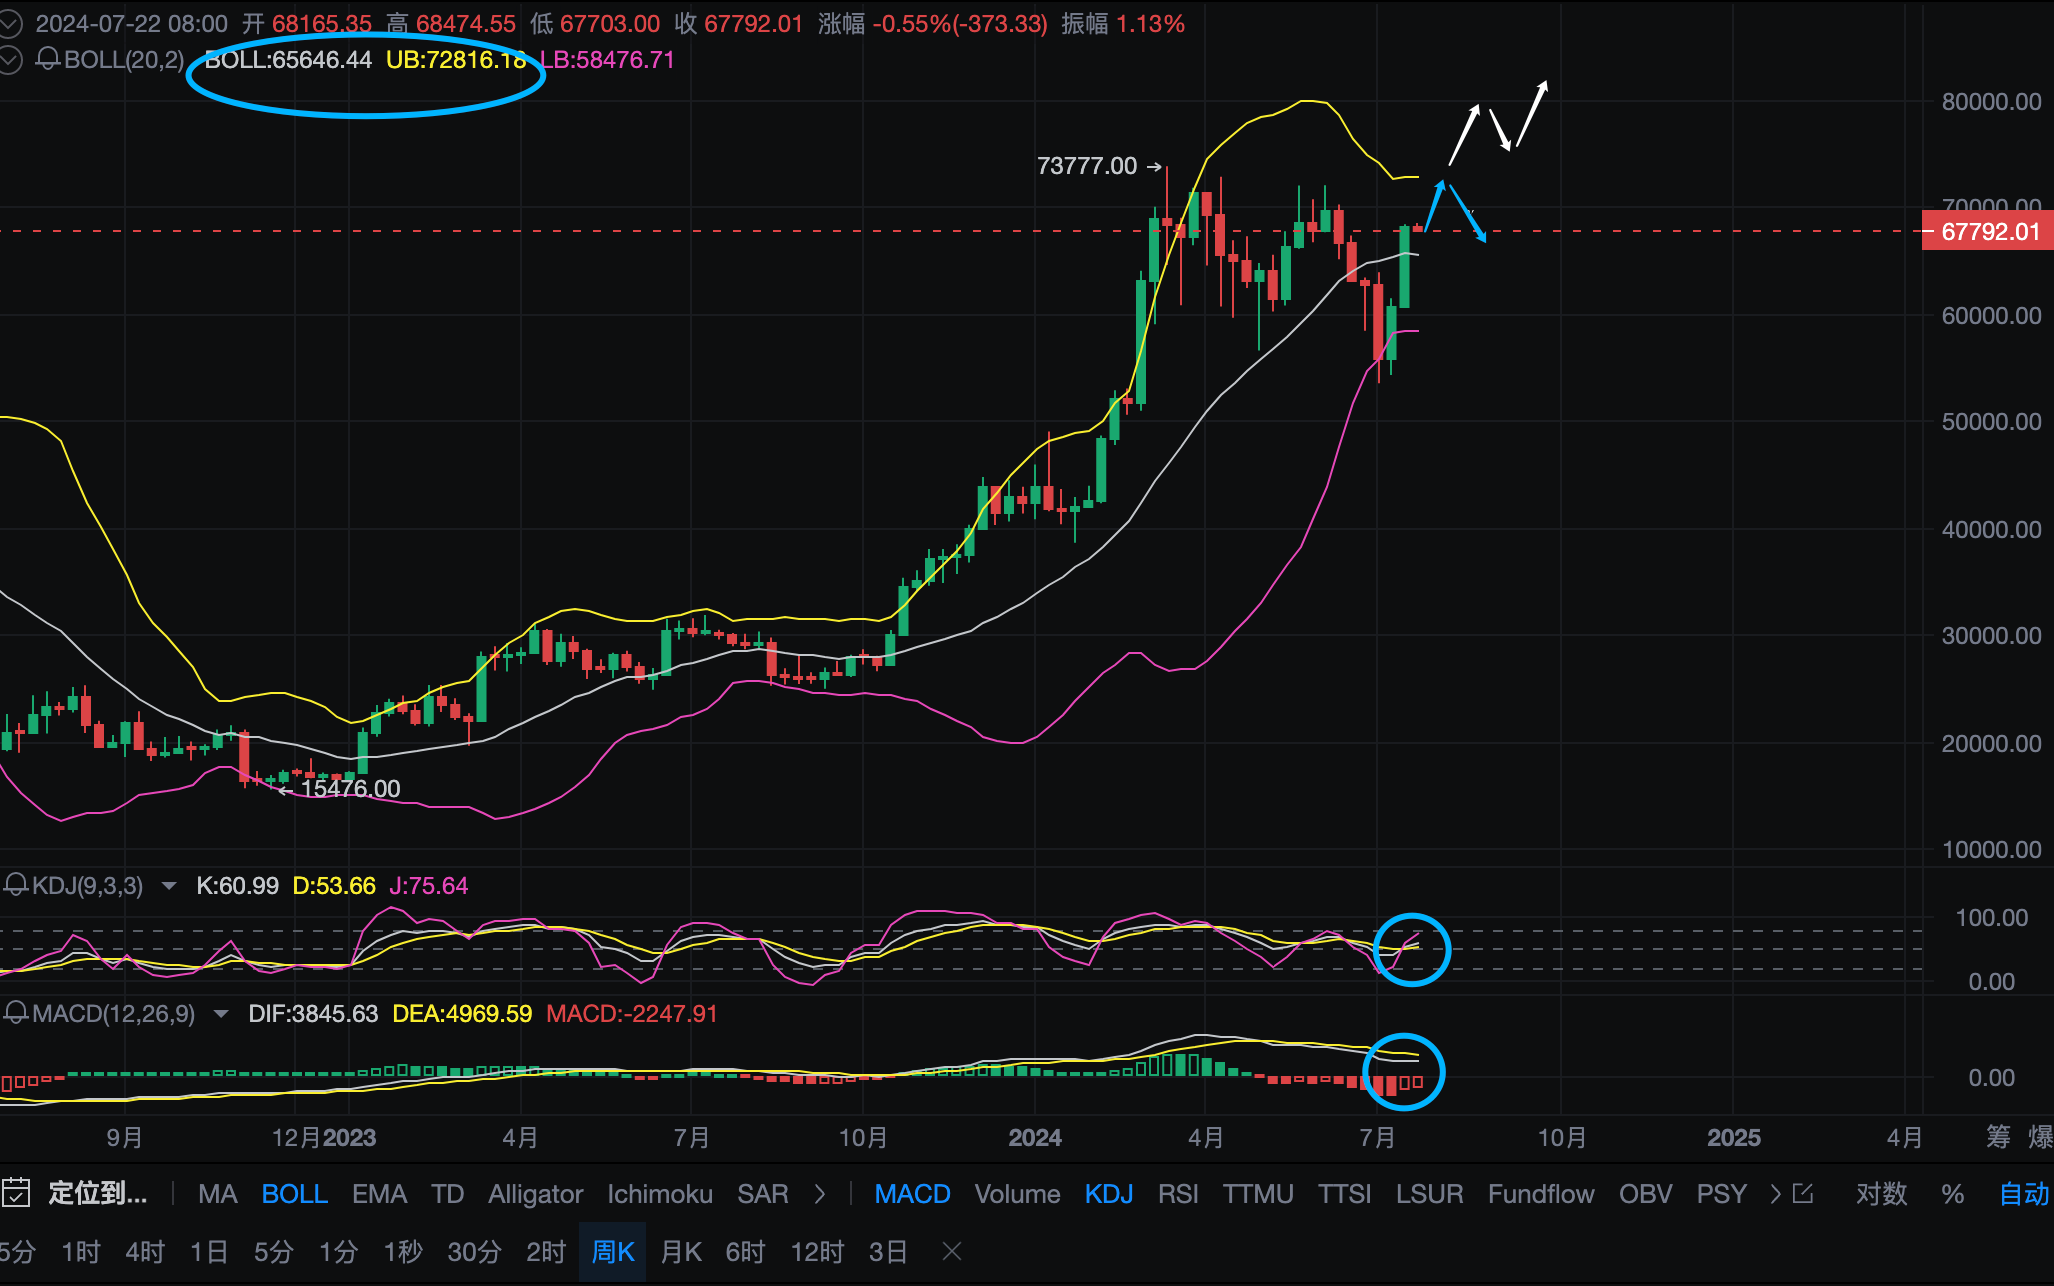
Last week, BTC showed strong bullish momentum, consecutively breaking through resistance levels at $64,500 and $66,000, reaching a high of nearly $68,500. The current upward momentum is strong, with the weekly K-line closing as a solid medium to long bullish candlestick. It is expected that there will be an initial rise followed by a pullback this week, which is the first possible trend of the market.
After the convergence of the weekly Bollinger Bands, the K-line has moved above the Bollinger midline at $65,650, weakening the resistance above, with the upper band currently near $72,830.
The upper boundary of the previous wide-ranging oscillation zone is around $72,000/$73,777, which can be considered as the upper resonant resistance. If there is pressure and a pullback above this resistance in the future, the important support levels to consider are around the retracement low points of this round of rise at $63,240 and $62,373, which are ideal buying points.
The KDJ indicator shows that the KD line is still in a strong zone overall, which is expected to continue in the early part of this week, but the J value is rapidly rising and is about to enter the overbought zone, so attention should also be paid to potential pullbacks in the future.
The weekly MACD indicator shows a contraction of the bearish momentum column, and the fast and slow lines are expected to form a golden cross later. If it can continue to maintain high-level oscillation in the future with the rising market sentiment, there is also a chance to break through the high points of nearly four to five months at $72,000/$73,777, which will open up further upward potential, representing the second possible trend of the market.
Daily Level:
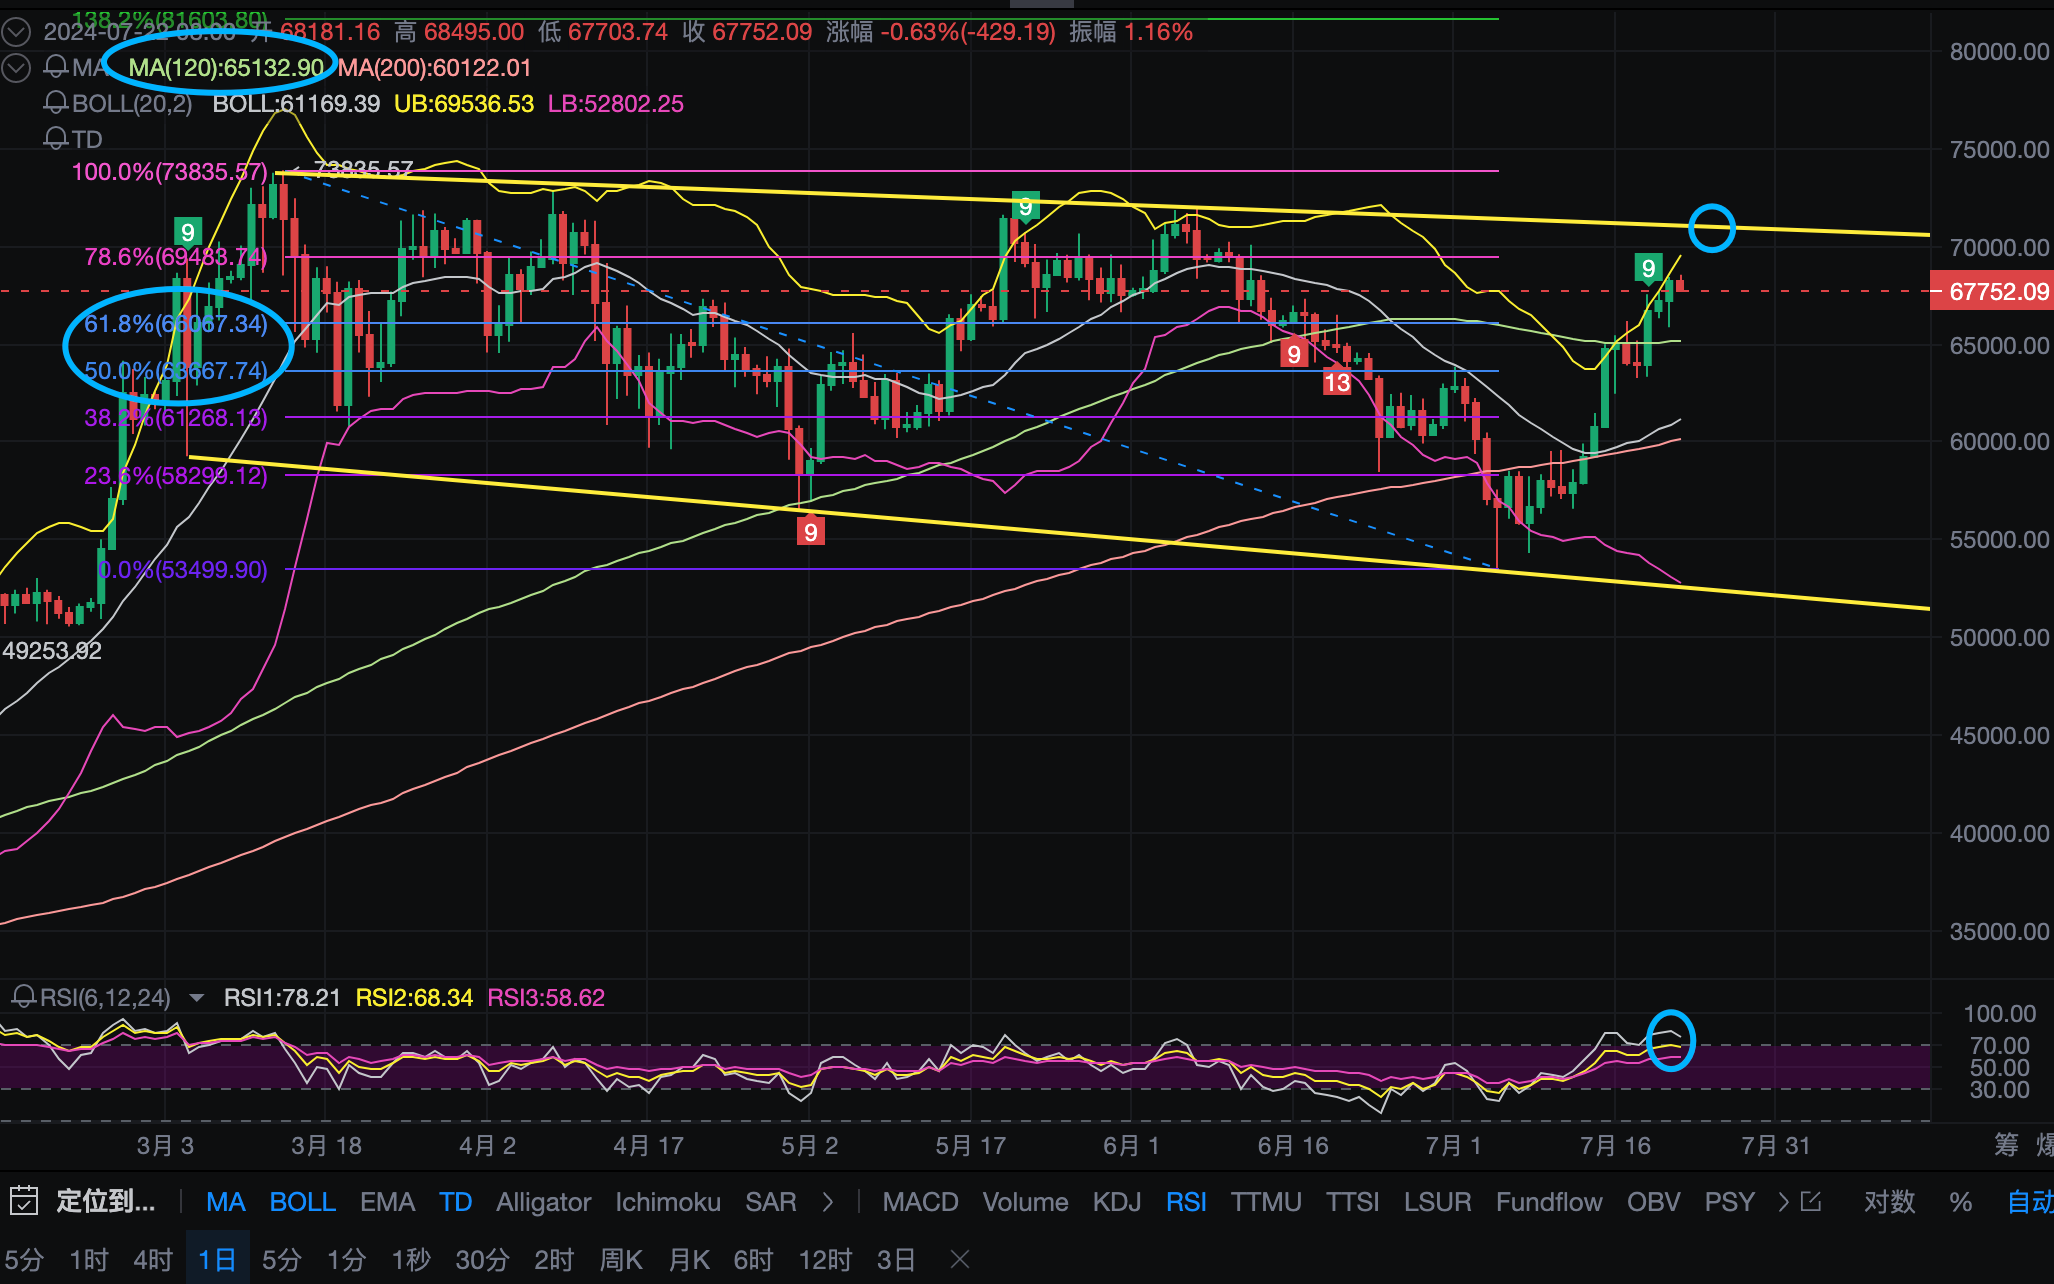
Both important moving averages, MA120 and MA200, are currently above, indicating a bullish trend. The daily MA120 is currently around $65,100, and the MA200 is gradually rising and is currently around $60,100, which will be important support levels in the future.
The daily Bollinger Bands have widened, with the K-line running continuously upwards near the upper band. There is a short-term need for a pullback, but the overall trend remains bullish.
The upper boundary of the wide-ranging oscillation channel on the daily chart is currently around $71,000, which is a potential future upward target and a possible pressure point.
The daily chart shows that after several days of strong upward movement, a TD sequential 9 signal has appeared at the daily level, indicating a possible pullback in the future.
The RSI indicator shows a smooth upward trend, indicating that the bullish trend is running in a relatively healthy state. However, the fast line has entered the overbought zone and turned, and with the three lines reaching a high, there may be a technical pullback.
The Fibonacci ratio shows that the first support level is around 61.8% at $66,025, and the further support level is around 50% at $63,630, which can be used as a reference for buying support.
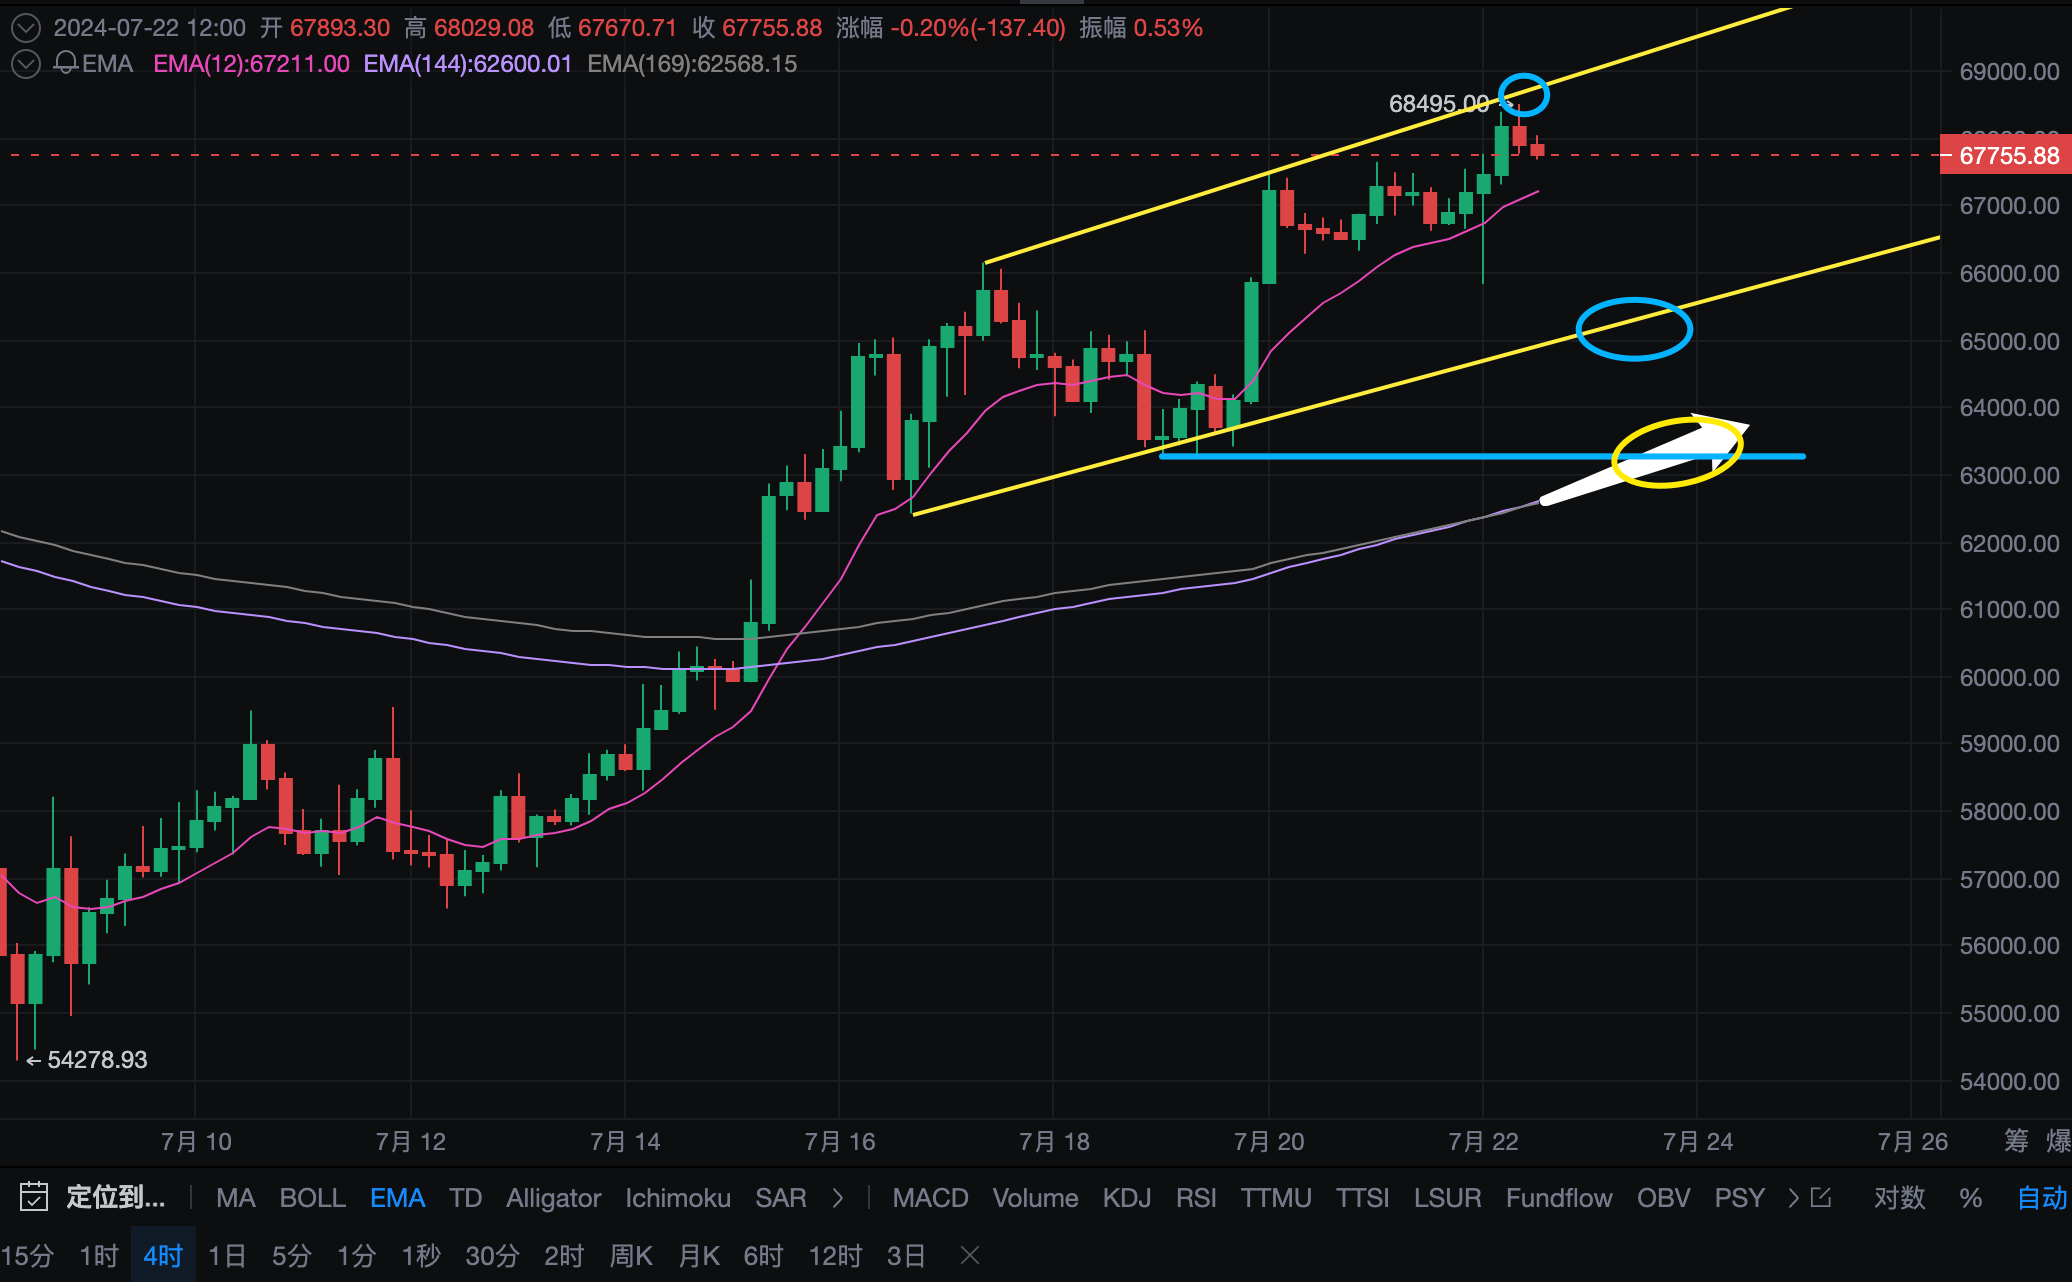
Four-Hour Level:
The four-hour chart shows that BTC is currently running within an upward channel, but has touched the upper resistance. There are signs of a short-term pullback, with the lower support around $64,700-$65,000.
Since breaking through the four-hour Vegas channel and moving above it on July 15, BTC is currently running upwards along the EMA12, with EMA144 and 169 gradually converging, and is expected to move to the resonant support near the recent retracement low point of $63,240.
The volume-price distribution chart at the four-hour level shows that the POC support is concentrated around $64,700, with the upper pressure reference near the chip peaks at $69,500 and $71,300.
Summary: BTC has shown strong upward movement, breaking through previous resistance levels. The weekly, daily, and four-hour levels all indicate a clear bullish trend. It is recommended to enter long positions in batches when there is a pullback to key support levels, while closely monitoring the gains and losses of important resistance levels above. Avoid chasing after excessive gains, and consider any technical pullback in the short term as an opportunity to buy on dips.
The above views are for reference only. Trading risks are at your own discretion. Pay attention to position management and risk control.
Follow us: AICoin
免责声明:本文章仅代表作者个人观点,不代表本平台的立场和观点。本文章仅供信息分享,不构成对任何人的任何投资建议。用户与作者之间的任何争议,与本平台无关。如网页中刊载的文章或图片涉及侵权,请提供相关的权利证明和身份证明发送邮件到support@aicoin.com,本平台相关工作人员将会进行核查。


