Hello everyone, I am your friend Lao Cui Shuobi, focusing on the analysis of digital currency market trends, striving to deliver the most valuable market information to the majority of currency friends. Welcome the attention and likes of the majority of currency friends, and reject any market smokescreens!

Just finished discussing the importance of news, and then came an explosive news in the middle of the night. Biden directly withdrew from the election. Although the odds were not high, it was unexpected. Looking at the public opinion and many currency friends are mostly engaged in foreign trade, I would like to remind everyone not to have any illusions. If Trump can take office, it would be a relatively positive news for the currency circle, but it is not good news for our domestic economy. Whether it's Trump or Biden, both of them are implementing the strategies left by Obama in the later period. The initiator of our trade war is still Trump, just not as extreme. Looking back at history, Biden definitely used it to the extreme. These two will not make our policies more lenient, this requires communication among politicians, and we don't need to worry too much about it. Let's talk about our currency market.

Many friends are asking about the meaning of RSI at the technical level. Let me talk about technical aspects first. The use of RSI is mostly seen in conjunction with the KDJ three lines, and the meanings represented by these two basically coincide. The value range of RSI is also 0-100. Usually, breaking through 50 indicates a bullish advantage, and vice versa. The overbought and oversold range of RSI is 80 and 20. When it exceeds 80, it means the market has exceeded the buyer's expectations, and the market is likely to reverse, meaning the manipulators are likely to sell off. When the market is below 20, it is in the oversold category, meaning the market has exceeded the seller's expectations, and the market may reach a turning point, meaning the manipulators are likely to recover some assets to raise prices. Both of these are auxiliary indicators for judging the arrival of a turning point in the market. When the RSI indicator fluctuates around 50 for a long time, it represents an unclear market trend, with bulls and bears continuously competing. Once it breaks through, it is very likely to show a major trend, either a rapid rise or a rapid fall. Generally, it is advisable for everyone to observe at this point.

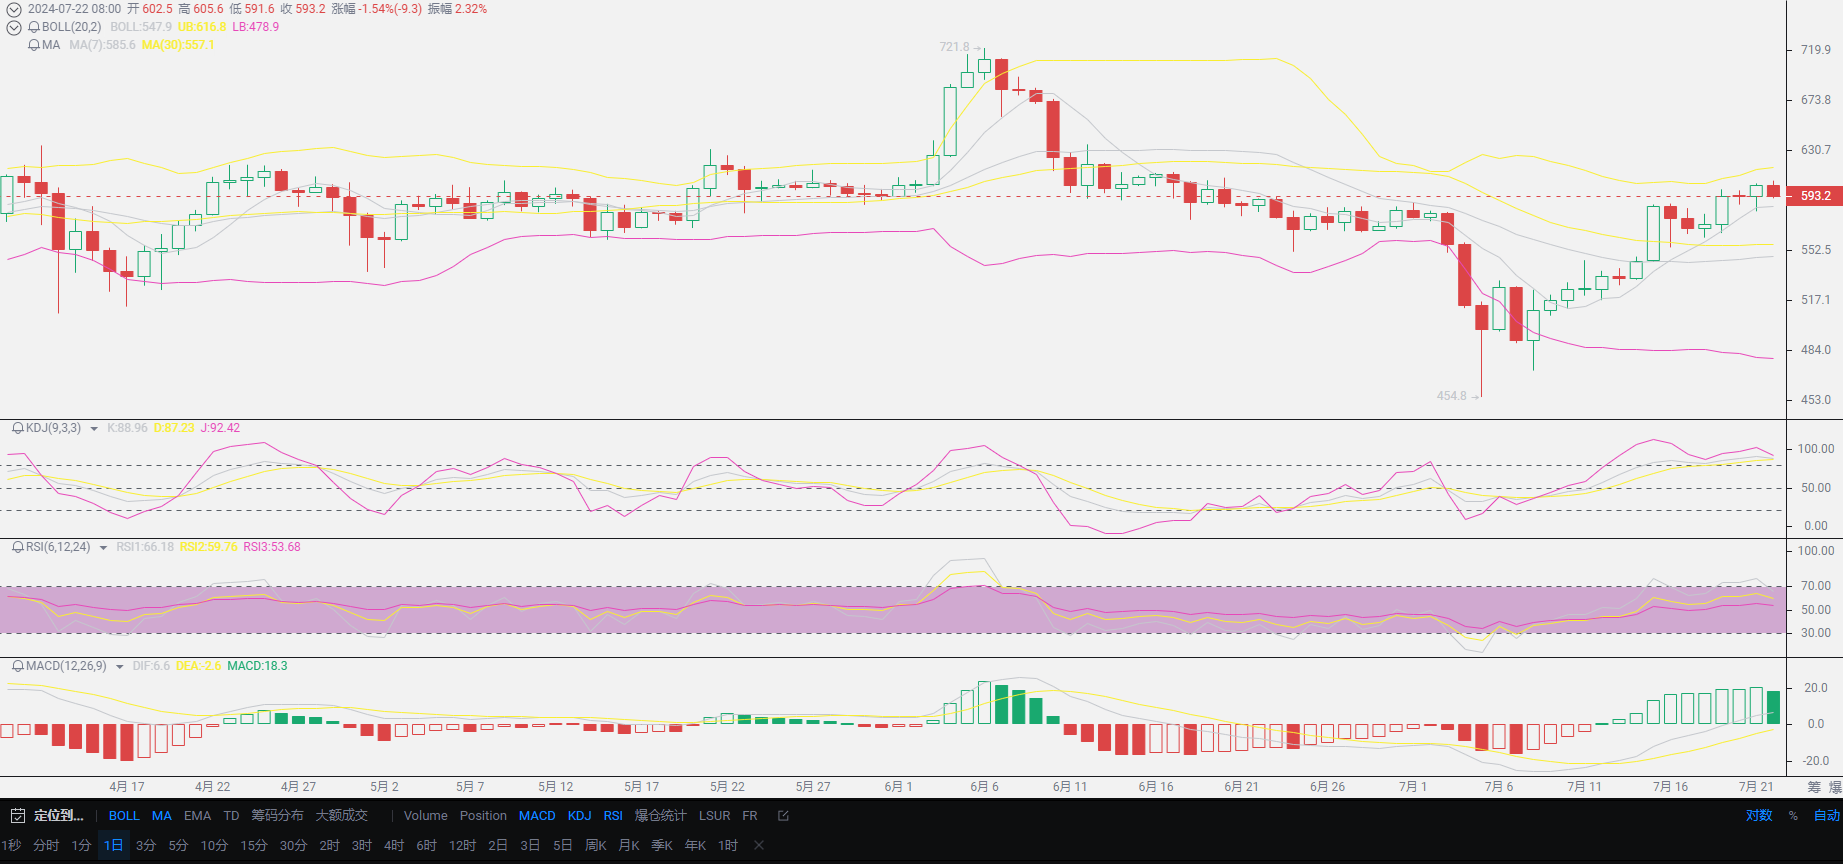
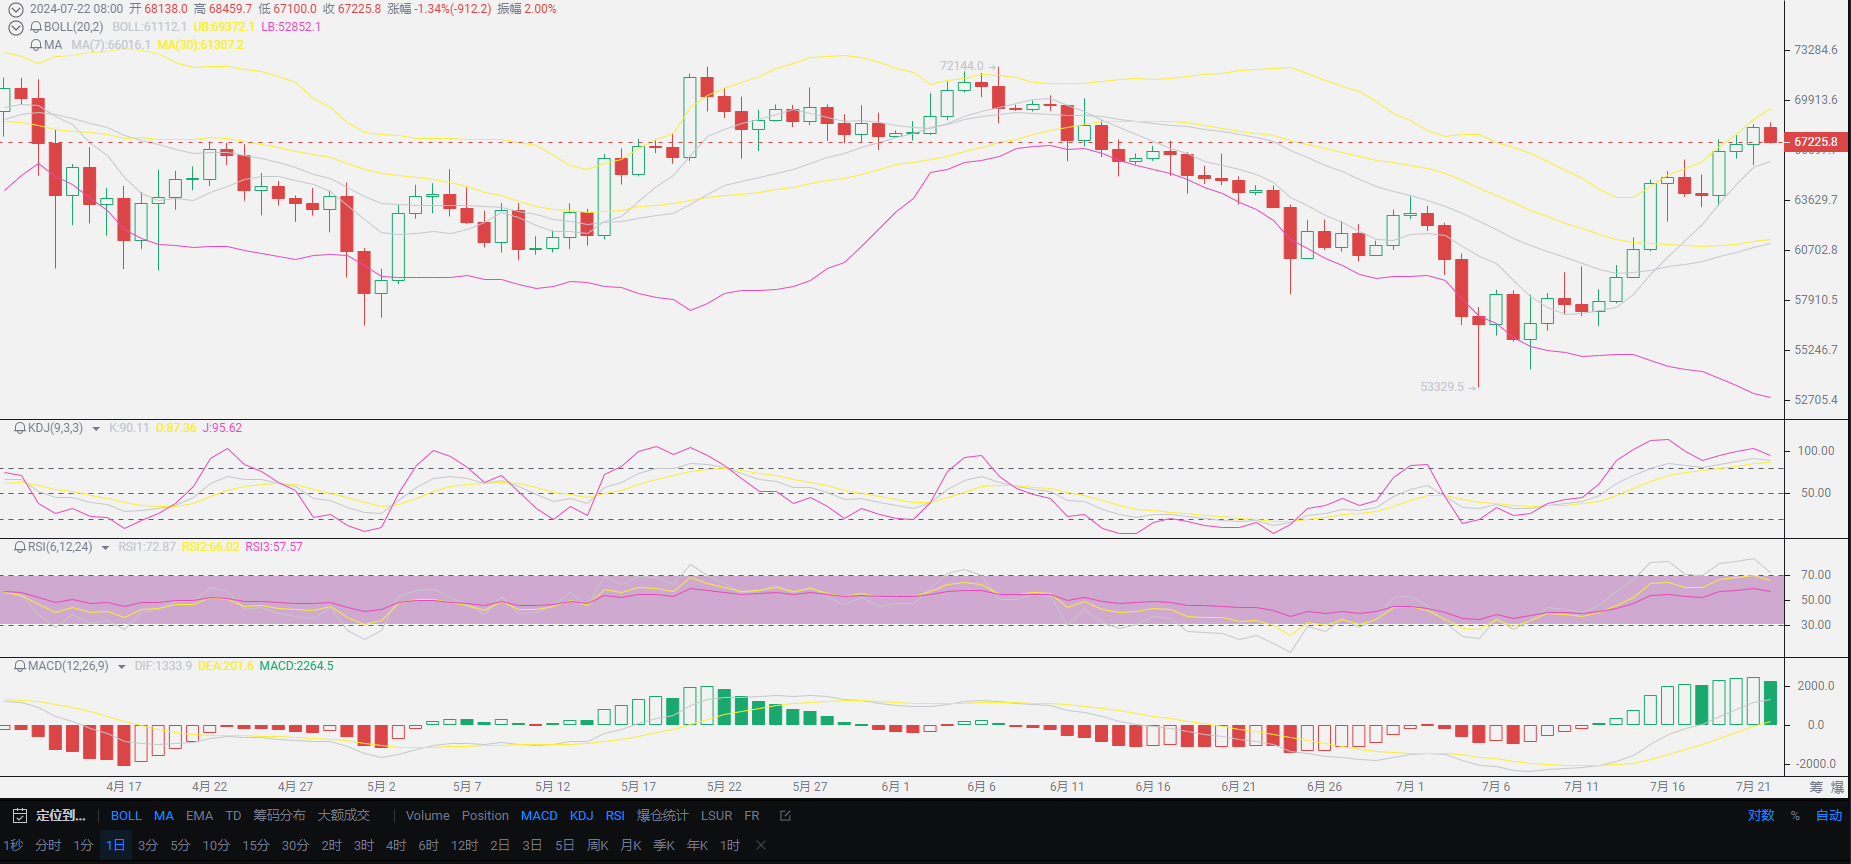
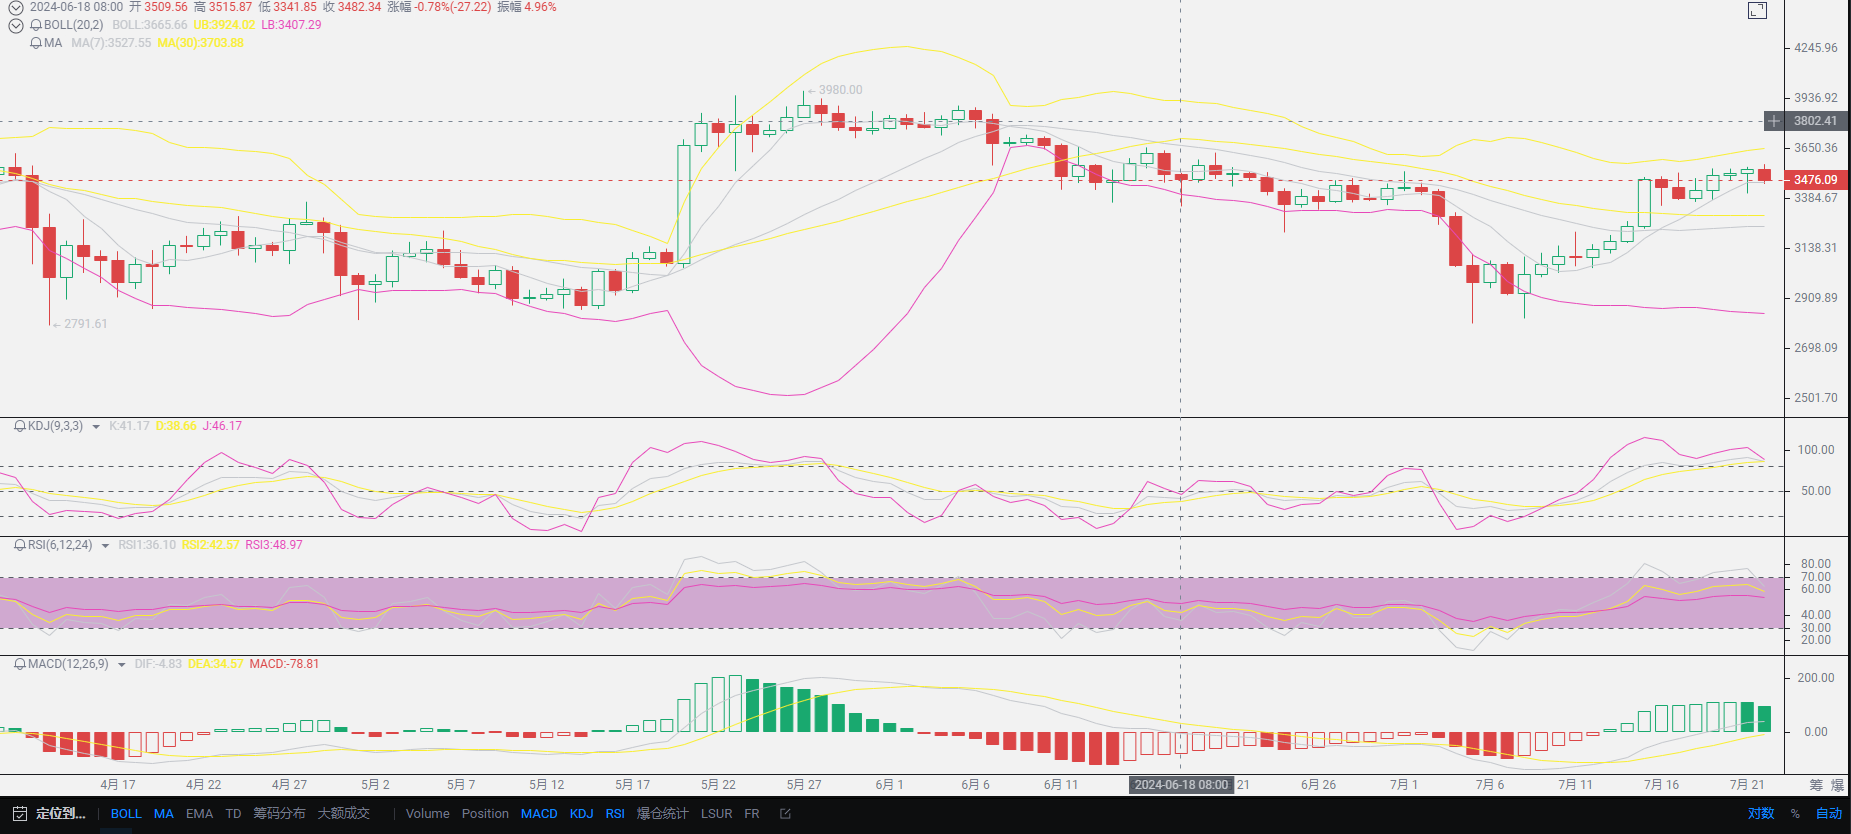
Now let's move on to today's market analysis, starting with the technical aspect. The long position mentioned in yesterday's article also brought significant profits, so congratulations to everyone. Looking at the daily chart of Ethereum, the Bollinger Bands still show an upward opening, with the upper and middle bands at the same open position, and the lower band trending downward, which we just learned is a clear upward trend. Looking at the moving averages, the 30-day moving average has a bottoming and rebounding trend, just starting to rise, but the 7-day moving average shows clear signs of pressure, ending the upward trend process, indicating a downward trend, suggesting that the 30-day overall trend is upward, and the short-term weekly trend may be slightly lower than last week, with little reference significance. The KDJ three values are all hovering around 90, and the lines all show signs of turning, especially the J line showing a clear reversal, seeming to be somewhat overbought, indicating a bearish trend.

At this point, I believe everyone is very confused. Basically, except for the Bollinger Bands, all other technical indicators show a trend of pressure and rebound. Why can the Bollinger Bands still sit steadily? Because the Bollinger Bands show a trend, and even the Bollinger Bands on the daily chart can show the shape of a week or even a month later (still an auxiliary tool), so the Bollinger Bands are more of a tool to look at the general direction, and not as swift as short-term indicators. The remaining short-term indicators are similar to what we usually talk about, showing a trend of retracement today after yesterday's rise, reflecting the short-term trend, which will be completed within 1-3 days. There is no need to talk about today, the profits from long positions in Ethereum and Bitcoin yesterday have reached over 50 points for Ethereum and around 1500 points for Bitcoin, and the depth of the technical retracement will not be too deep.

Returning to the macroeconomy, Trump's victory means a bullish trend for the currency circle. The listing of Ethereum tomorrow means an upward trend on the daily chart, and there is no doubt that this listing news will bring about a wave of growth. The volatility tomorrow will definitely be very intense, but there will definitely be a retracement before tomorrow, and the depth still exists. For Bitcoin, fluctuations of several thousand are normal. I need to remind everyone that listing does not mean completely bullish. There will definitely be a depth of retracement in the middle, and the volatility will be intense both up and down, so entering the market still requires caution. For those who are not good at grasping the timing of entry, try to chat with Lao Cui before determining the entry position, and do not be blindly confident.

Lao Cui's summary: The technical indicators at the linear level are generally clear. The technical indicators before the listing are mostly bearish, indicating that we are currently in a stage of rising and then retracing. From a long-term perspective, the Bollinger Bands are still opening upwards, which, combined with the macroeconomic level, coincides with the listing news, so there is a great possibility of growth after the listing, and there is also room for growth. However, the short-term indicators are mostly bearish, so the recent trend can be basically confirmed, that is, there will be a retracement before the listing, and then there will be a breakthrough. Today's trend also coincides with our analysis, the current trend is in a retracement stage. The volatility today will definitely not be as intense as tomorrow's. For those who want to enter the market, you can lower your position and leverage, and Bitcoin can hold a profit space of thousands of points or even more, while Ethereum should be kept at over 300 points. The article does not provide specific entry points. If you have any questions, please consult before making a decision.

Lao Cui's message: Investment is like playing chess. Masters can see five steps, seven steps, or even a dozen steps ahead, while those with lower skills can only see two or three steps. The high-level players consider the overall situation and plan for the general trend, not focusing on each move, but aiming to win the game in the end. The lower-level players fight for every inch, frequently switching between long and short positions, only fighting for short-term gains, and frequently end up in trouble.
This material is for learning and reference only and does not constitute investment advice. Buying and selling based on this material is at your own risk!
免责声明:本文章仅代表作者个人观点,不代表本平台的立场和观点。本文章仅供信息分享,不构成对任何人的任何投资建议。用户与作者之间的任何争议,与本平台无关。如网页中刊载的文章或图片涉及侵权,请提供相关的权利证明和身份证明发送邮件到support@aicoin.com,本平台相关工作人员将会进行核查。


