Hello everyone, I am your friend Lao Cui Shuo Bi, focusing on the analysis of digital currency market trends, striving to convey the most valuable market information to the majority of coin friends. Welcome to the attention and likes of the majority of coin friends, and refuse any market smoke bombs!
This chapter will explain the technical aspects, also known as the linear aspect commonly referred to by everyone. Before explaining, Lao Cui needs to make a statement. The technical indicators of the currency circle and stock market can only assist in judging the later trend, and cannot determine the later trend. The technical aspect can only stay at the understanding stage. First is the commonly seen moving average, such as the five-day moving average, ten-day moving average, and even the monthly moving average, which generally refers to the average price of the stock in the last 5 days or the index. Usually corresponding to the stock's 5-day moving average and the index's 5-day moving average (5MA). The role of the moving average is to reflect the recent transaction price and indirectly reflect the trading intentions of the buyer and seller. The meaning of the upward or downward trend of the moving average does not have reference significance.
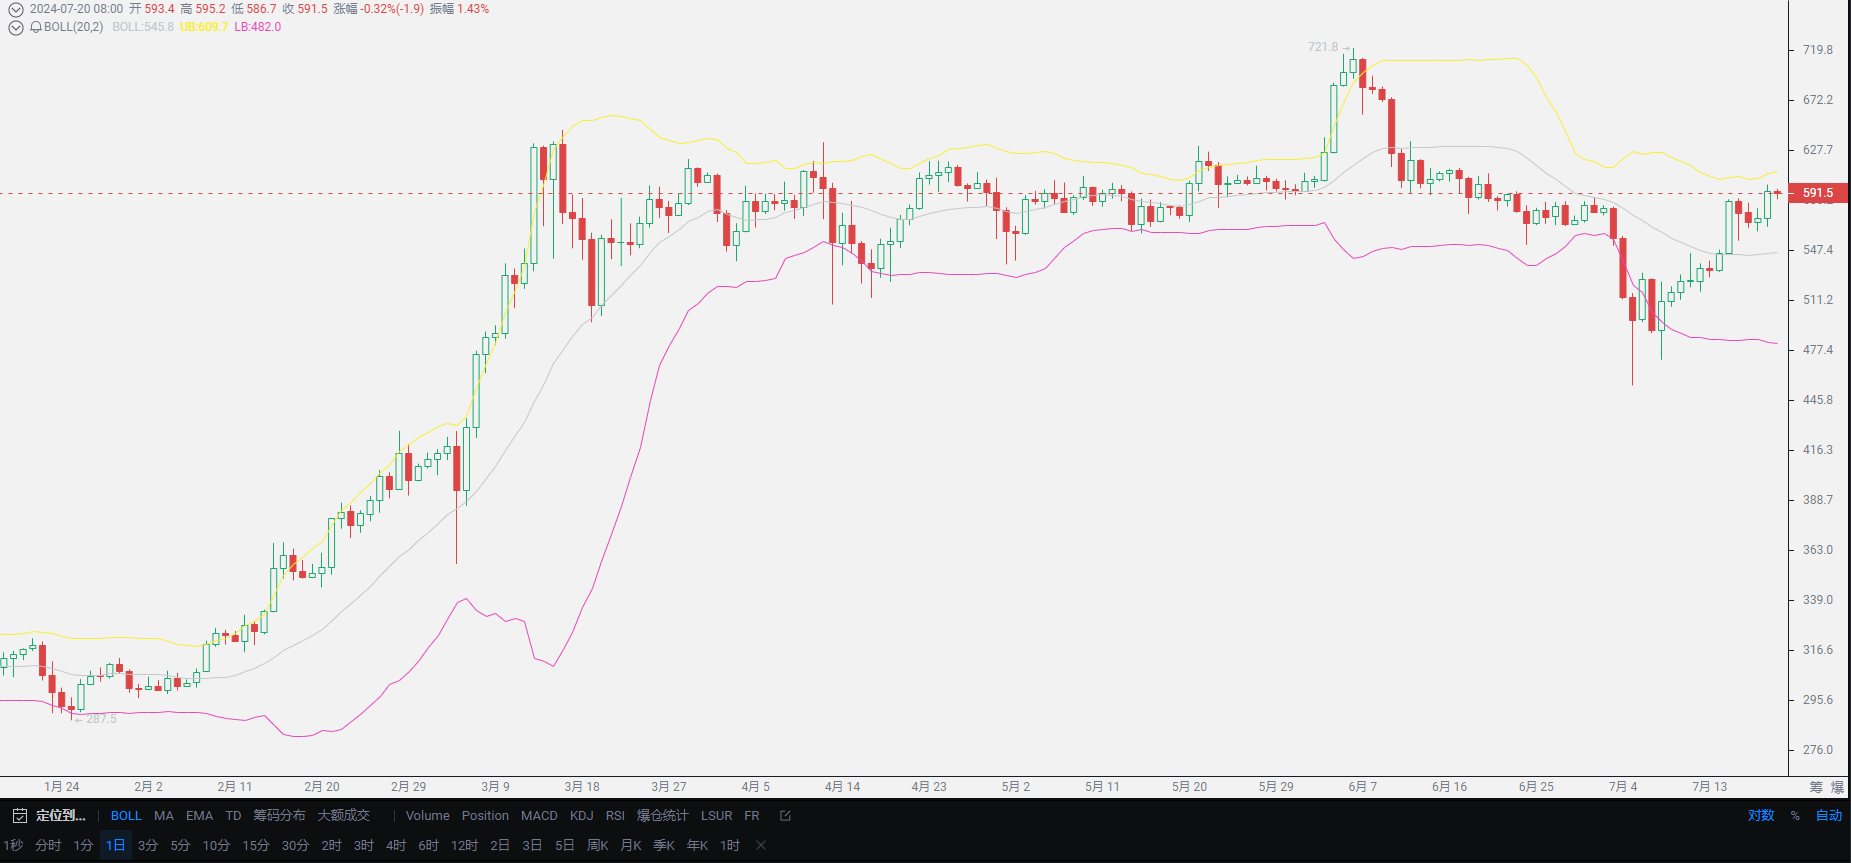
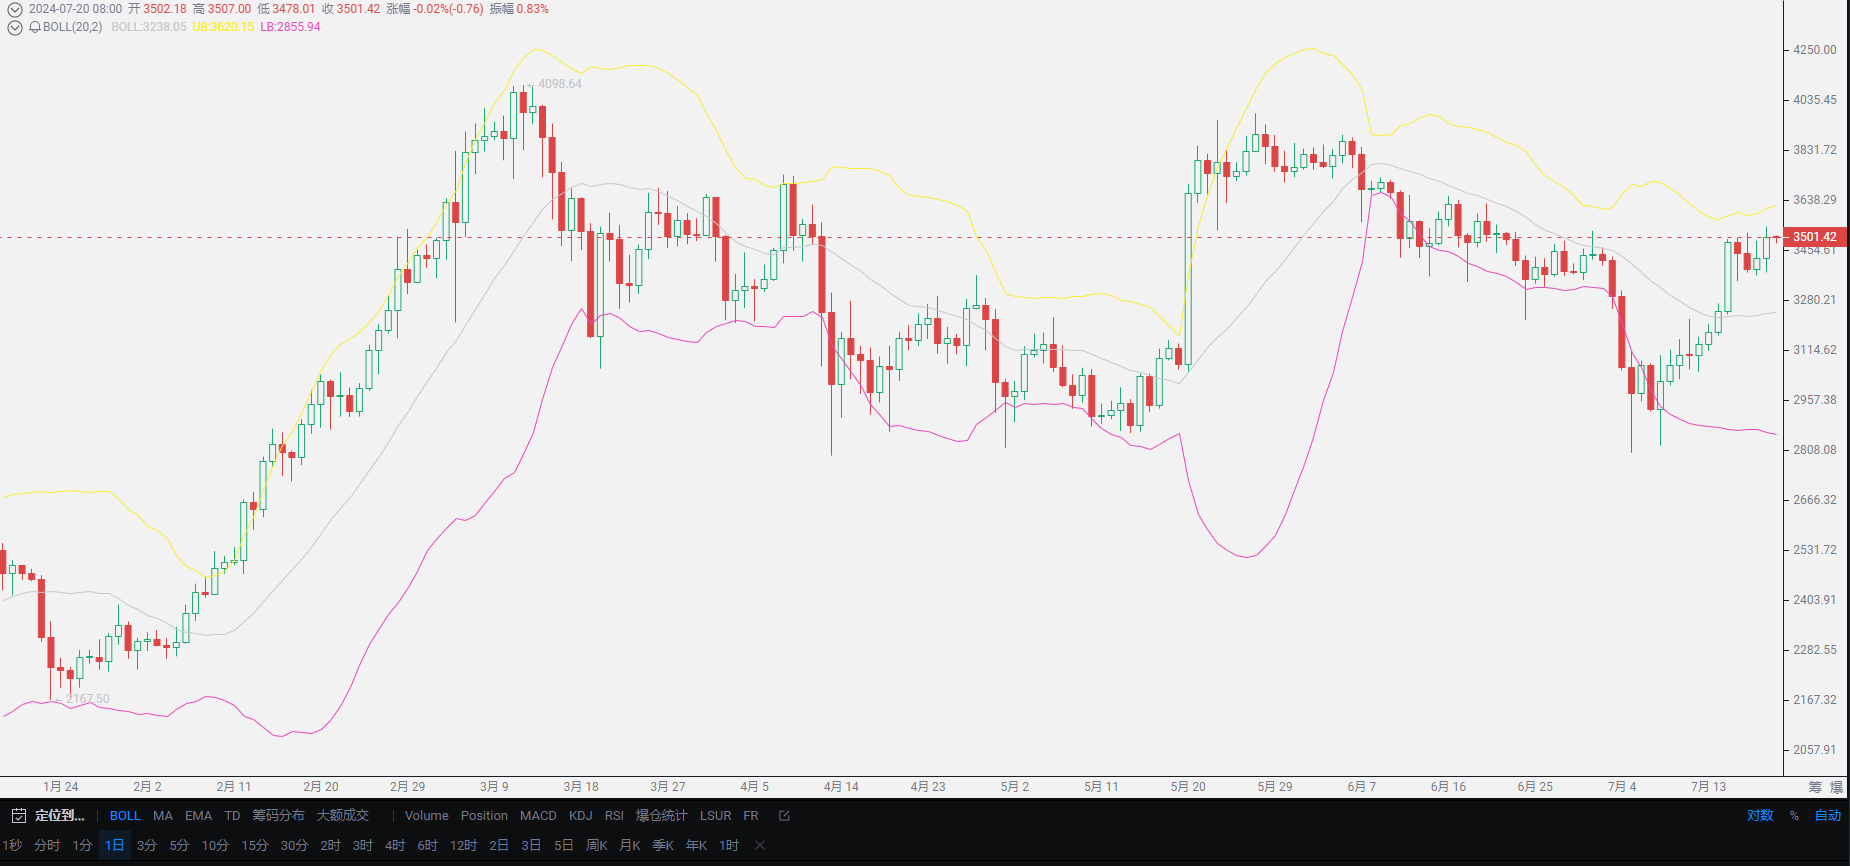
Usually, the occurrence that accompanies the moving average is the Bollinger Bands. The opening of the Bollinger Bands refers to the situation where the upper and lower lines of the stock Bollinger Bands indicator show completely opposite directions with great strength, indicating that the bullish strength is gradually increasing while the bearish strength is gradually weakening, and the stock price will be in a short-term significant upward trend. Short-term investors can consider opening positions at this time. The situation of the Bollinger Bands closing is when the upper and lower lines of the Bollinger Bands are continuously approaching. When the stock price narrows after a long period of decline, it indicates that the strengths of both the long and short sides are gradually balanced, and the stock price will be in a long-term sideways consolidation trend, so investors should mainly adopt a wait-and-see attitude. The middle and lower lines of the Bollinger Bands usually coincide, resulting in different opening methods, which means that the market tends to be unstable. For example, on July 17th, the upper band reached around 3500, but the closing price was around 3300, the upper and lower bands showed different trends, but ultimately led to a wave of growth in the market, which is a typical situation where the bullish strength is gradually increasing while the bearish strength is gradually weakening.
However, the difficult judgment lies in the appearance of the "hanging man" phenomenon between these two, which must be mentioned separately. The appearance of the "hanging man" is completely the presence of the manipulator testing the pressure, that is, the upper shadow is long, and the lower shadow is almost non-existent, presenting a solid state. Generally, the appearance of the "hanging man" is difficult to judge and is mostly formed after the later trend is completed. But once formed, the market will generally rise. To judge the form of the "hanging man," detailed analysis must be done in combination with the moving average, Bollinger Bands, and the trend of funds. Usually, the most commonly used in the currency circle are the combination of the moving average and Bollinger Bands, plus the short-term trend of funds, to give everyone an analysis result, and of course, there is no reasonable explanation at the technical level.

At this point, I believe everyone has a rough understanding of the technical aspects. The most core issue at the technical level is that data can only be formed after the market trend has passed. How to make everyone understand this thing? It must be explained in a way that our Chinese people can understand, that all analysis is actually based on historical lessons. That is, if this situation has occurred in history, all results may be such. In general, analysts who excel at the technical level are mostly at a loss, blindly believing in linear technical things, and will only end up losing money. With the same single line, Lao Cui can find a trend opposite to what everyone thinks. The essence of trading still needs to return to the agreement between the buyer and the seller, that is, the matching trading commonly mentioned in the currency circle. It still depends on the intentions of both parties.

However, this does not mean that the technical aspect has no reference significance. The technical aspect can reflect the intentions of the manipulator. However, most of the time, everyone is only aware of it after the market trend has passed. To speculate on the intentions of the manipulator, it is necessary to combine the overall market economic trend, fund movements, policy orientation, and future development prospects. Only then is it possible to find a clue. No one can completely guess the intentions of the manipulator. Just like going back to the 2000s and telling them about the future development, which will be dominated by the Internet, everyone will only think you are crazy, and even if you guess correctly, it is useless. Even if you are lucky enough to guess correctly once, the manipulator only needs everyone to guess wrong once to harvest.

All linear aspects do not have a clear rule that the formation of a line will definitely rise or fall in the future. Users who have been following Lao Cui for a long time will definitely understand that the most reliable indicator for now is the exchange rate, that is, the higher the price of USDT, the lower the currency circle will go, and conversely, the lower the price, the currency circle will go up. This theory has been mentioned many times, so I won't go into it here. Contract users must refer to this indicator, and I believe that after comparing, everyone will find it somewhat reasonable. In future articles, Lao Cui will provide everyone with an analysis based on linear aspects combined with market economics. At the end of the article, as always, the exchange rate is gradually starting to decline, and if it holds around 7.2, it will usher in an upward trend. On the contrary, if it surges to 7.3, this trend will be completely wiped out. This round of growth will only end when the price reaches 7.3 or above. As long as it does not reach this level, the trend will continue to choose to go up. But do not hold the idea of creating historical highs, as breaking historical highs is very limited.

Lao Cui's message: Investment is like playing chess. Masters can see five steps, seven steps, or even a dozen steps ahead, while those with lower skills can only see two or three steps. The high-level players consider the overall situation, plan for the general trend, and do not focus on individual moves or territories, with the goal of ultimately winning the game. On the other hand, the lower-level players fight for every inch, frequently switching between long and short positions, only focusing on short-term gains, and as a result, frequently get trapped.
This material is for learning and reference only and does not constitute investment advice. Buying and selling based on this material is at your own risk!
免责声明:本文章仅代表作者个人观点,不代表本平台的立场和观点。本文章仅供信息分享,不构成对任何人的任何投资建议。用户与作者之间的任何争议,与本平台无关。如网页中刊载的文章或图片涉及侵权,请提供相关的权利证明和身份证明发送邮件到support@aicoin.com,本平台相关工作人员将会进行核查。


