Trend Analysis by Master Chen:
BTC Daily Chart:
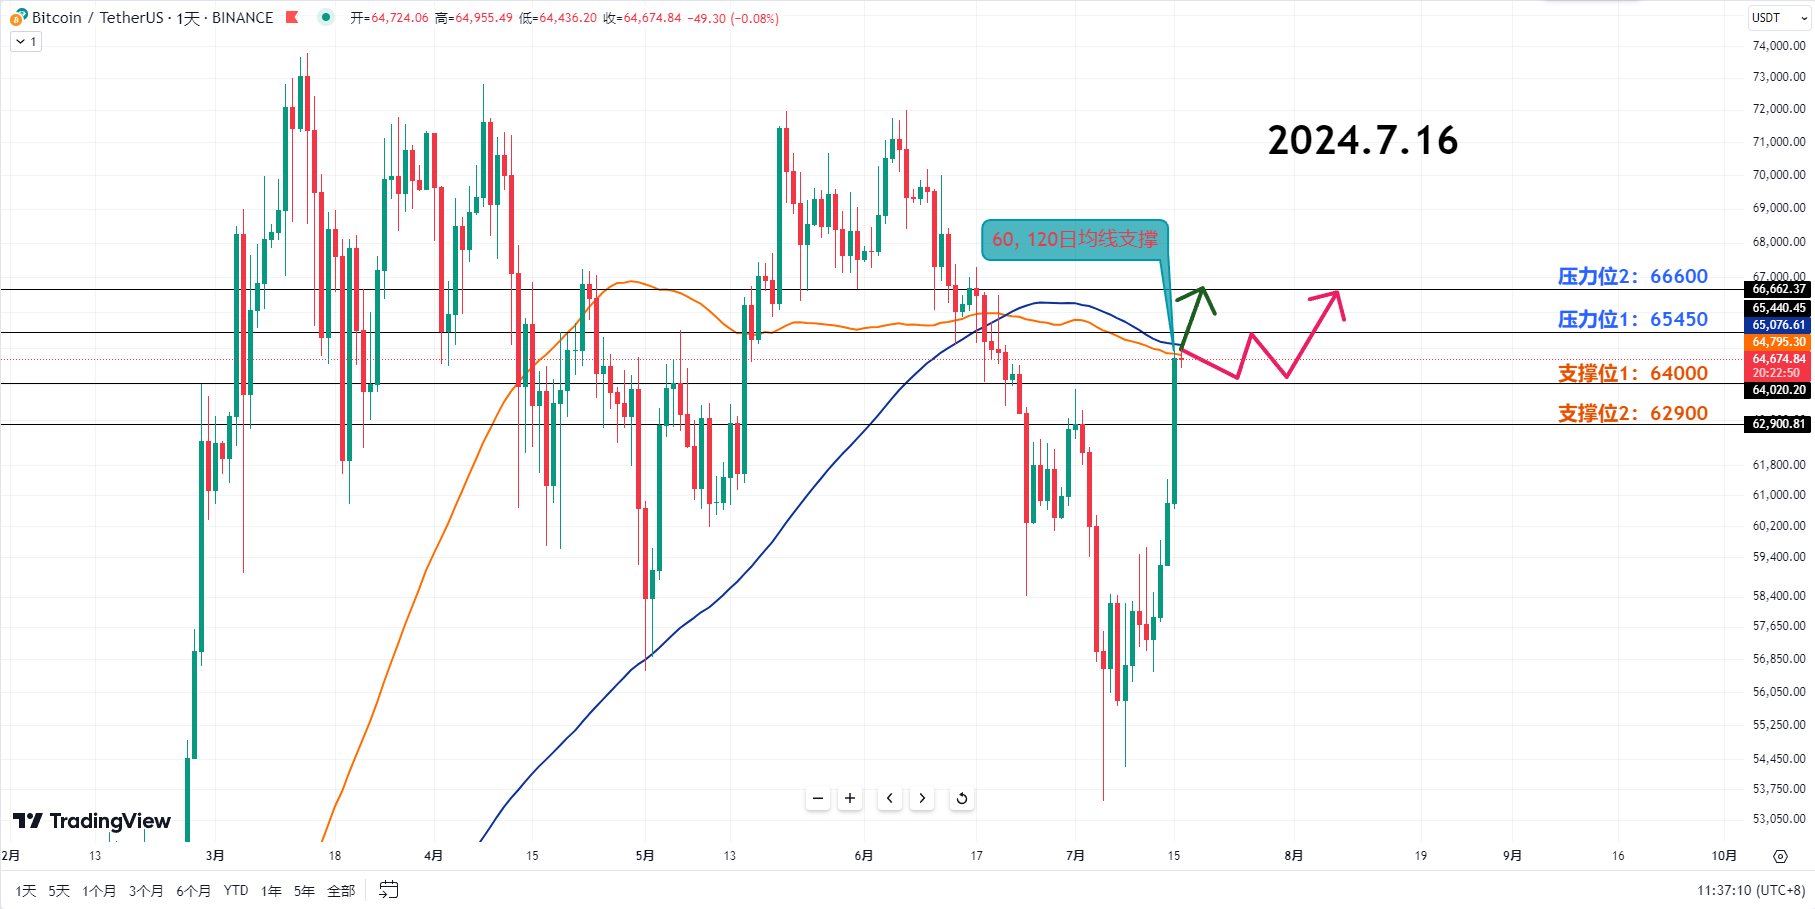
Based on the Bitcoin daily chart, it has broken through the upper boundary of the box and formed a large bullish candle, returning to the upward trend.
Currently, the ETF market continues to see net inflows, and Bitcoin is seen as a means to hedge against currency devaluation. With the increased possibility of Trump's election, it is judged that a rebound has occurred.
Given the significant rebound, the bullish view can be maintained. Short-term operations can be conducted within a sufficient pullback range. Due to increased volatility, profits can be taken in a timely manner in short-term trading.
After the large bullish candle, attention can be paid to the lower shadow formed by the next candle, and operations can be carried out after confirming the short-term trend in lower time frame charts.
Resistance Levels:
First Resistance Level: 65450
Second Resistance Level: 66600
If the price breaks through the first resistance level, further bullishness can be expected, and a significant rebound may occur.
At the current stage, the 60-day and 120-day moving averages can be set as phased resistance levels. Breakout trades can be conducted within the breakout range, and the backtesting after the moving average breakout can be observed.
Due to the possibility of consolidation after the large bullish candle, it is more prudent to wait and observe before taking action.
Support Levels:
First Support Level: 64000
Second Support Level: 62900
If the price adjusts to the first support level, it can be seen as a short-term entry opportunity, and a rebound can be observed after a decrease in trading volume.
Master Chen has reserved the maximum downside space to around 63000 today, but it is expected that a rebound will occur after maintaining support at 64000.
Today's Trading Suggestions:
In today's trading, the bullish view can be maintained. Attention can be paid to whether a higher low is formed in the lower time frame charts, and operations can be conducted with a rebound view.
Although the risk-reward ratio for short positions is better due to the presence of the 60-day and 120-day moving average resistance levels, the strong buying interest makes a bullish position during pullbacks more advantageous than a bearish position.
Please refer to these suggestions when trading.
Master Chen's Short-term Pending Orders on 7.16:
Long Entry Reference: 62900-63300 range, gradually enter long positions, with a 500-point stop loss, and a target of 64000-65450
Short Entry Reference: 66600-67000 range, gradually enter short positions, with a 500-point stop loss, and a target of 65450-64000
This article is exclusively planned and published by Master Chen (WeChat Official Account: 币神师爷陈). If you need to learn more about real-time investment strategies, how to get out of a predicament, spot contract trading techniques, operational skills, and candlestick knowledge, you can add Master Chen for learning and communication. I hope to help you find what you want in the cryptocurrency circle. Focusing on BTC, ETH, and altcoin spot contracts for many years, there is no 100% method, only 100% going with the trend; daily updates on macro analysis articles across the web, technical analysis of mainstream coins and altcoins, and spot mid- to long-term replay price prediction videos.

Friendly reminder: Only the official WeChat account column (as shown in the image above) is written by Master Chen. The end of the article and other advertisements in the comments section are not related to the author. Please discern carefully between true and false. Thank you for reading.
免责声明:本文章仅代表作者个人观点,不代表本平台的立场和观点。本文章仅供信息分享,不构成对任何人的任何投资建议。用户与作者之间的任何争议,与本平台无关。如网页中刊载的文章或图片涉及侵权,请提供相关的权利证明和身份证明发送邮件到support@aicoin.com,本平台相关工作人员将会进行核查。


