Title: AICoin
Macro News Analysis: ① Last night, Federal Reserve Chairman Powell officially began a two-day "Capitol Hill Tour." Powell stated that inflation has significantly slowed but remains above the 2% target. He mentioned that until there is confidence that inflation is consistently moving towards 2%, a rate cut policy is not appropriate. He also pointed out that high inflation is not the only risk and that premature or excessive policy easing could harm inflation progress. He also warned of the risks of maintaining high interest rates in the long term.
② Based on Powell's remarks, mentioning that a rate cut is inappropriate is hawkish, while mentioning the risks of high interest rates is dovish. Other aspects are considered to be a balancing act. As a result, the BTC market experienced a small rapid decline from around $58,130 to near $56,900 before rebounding around the time of his speech.
③ Tonight, Chairman Powell will continue to speak, and it remains to be seen if any new signals will be released. Expectations about future monetary policy will continue to affect market fluctuations. Hawkish comments may be bearish for the crypto market, while dovish comments may be bullish.
Data Analysis: The Secret of Bull and Bear Division: 200-Day SMA Helps You Judge Market Long and Short Watershed.

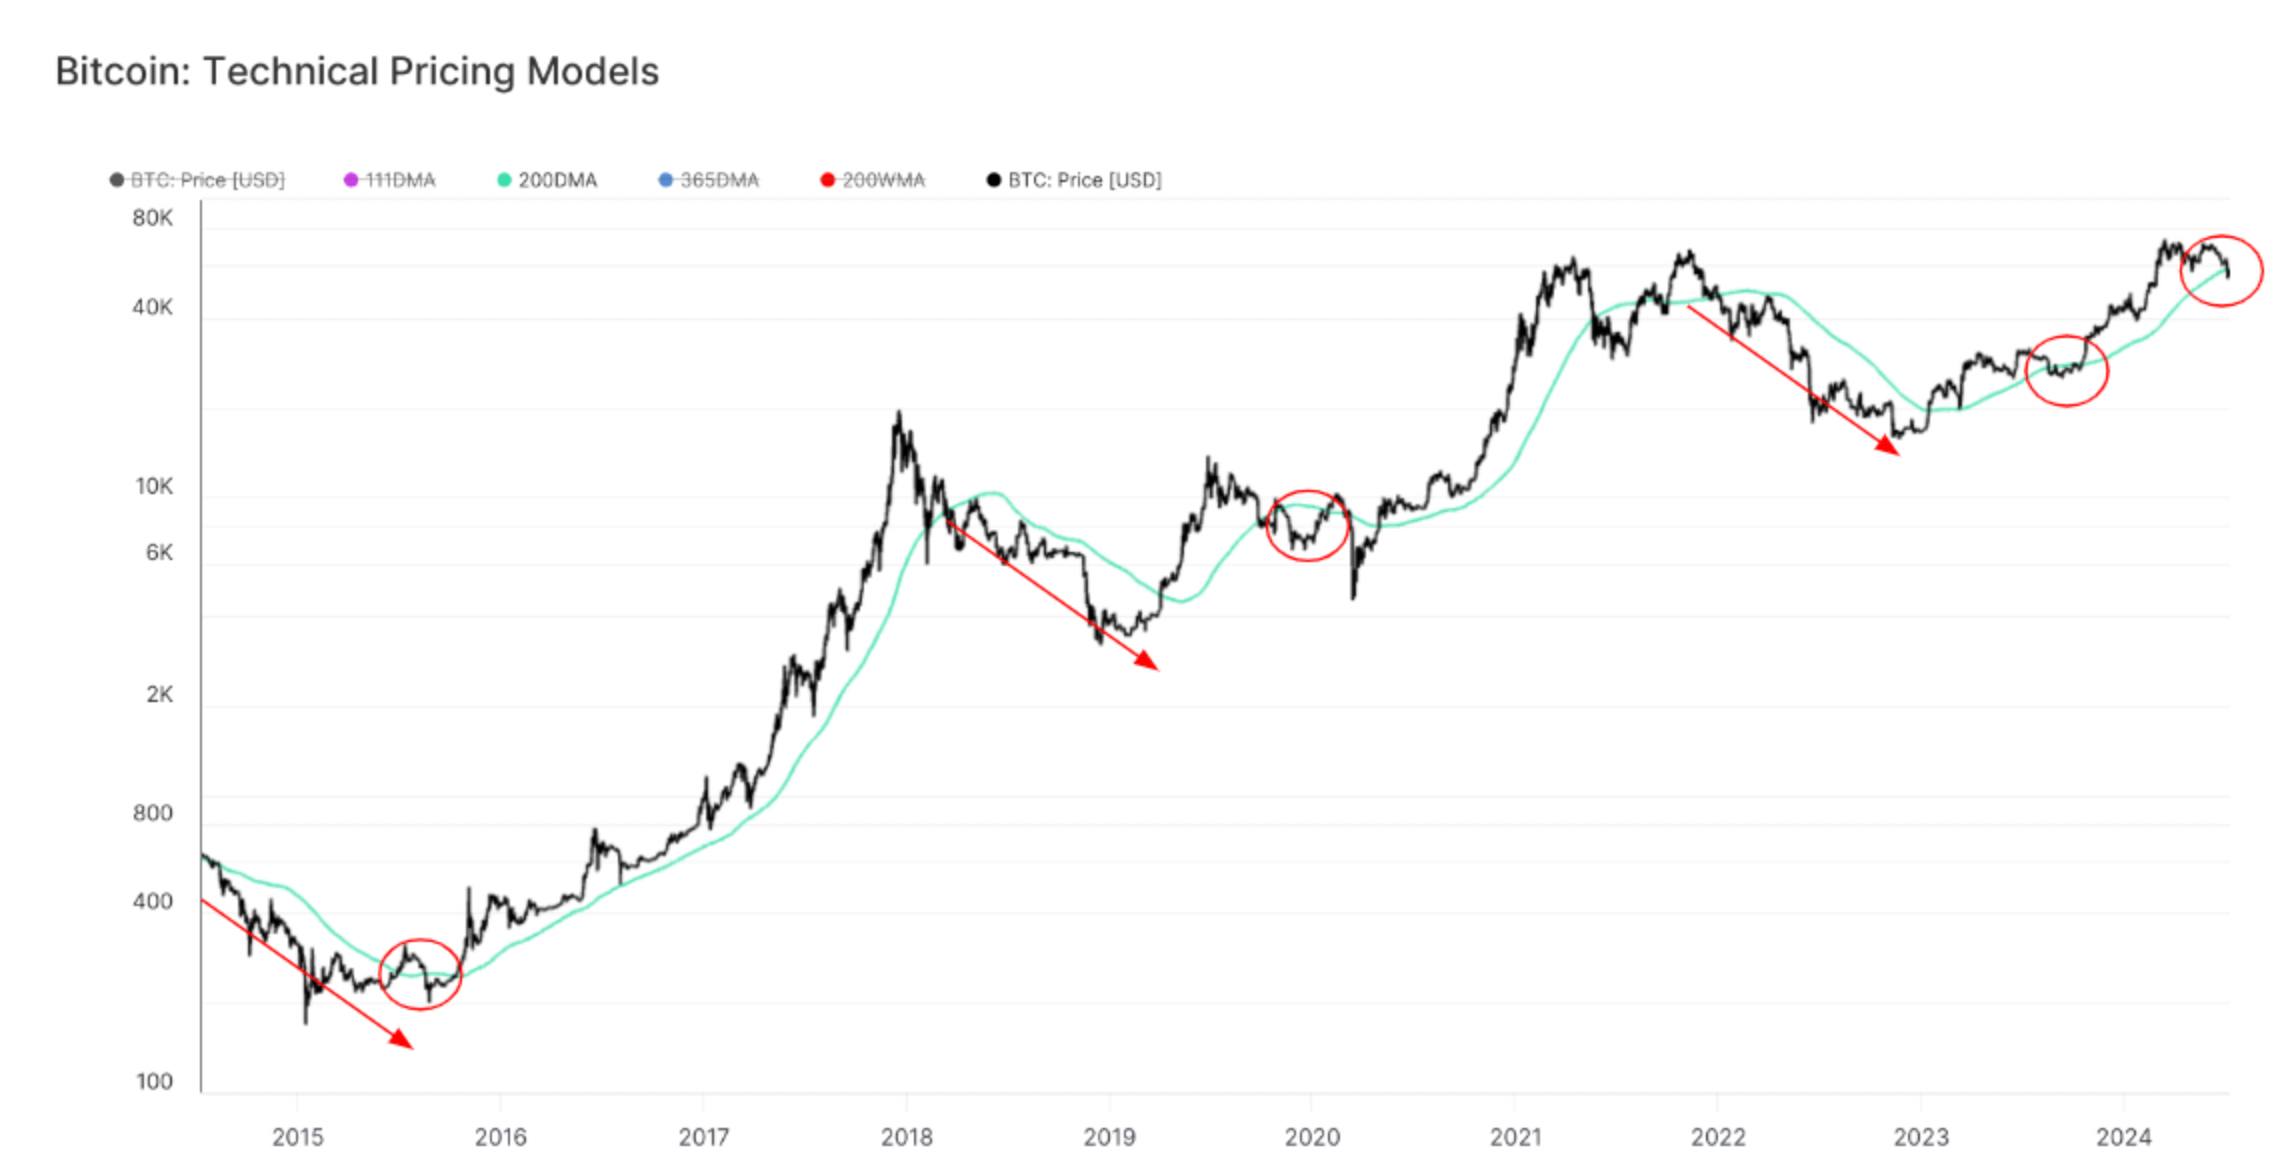
① The 200-day Simple Moving Average (SMA) is a key technical analysis indicator and a well-known bull and bear division line in our circle. Last week, on July 4th, BTC fell below this critical value for the first time since August of last year. Currently, the 200-day SMA is near $58,800 for BTC, and it has been temporarily resisted three times, leading to downward pressure and short-term oscillation.
② Looking back at the past three historical instances, there is a certain regularity that can serve as a reference for our trading: when BTC falls below the 200-day SMA during a bull market, if it later recovers, it will continue to maintain an upward trend. From the chart, this pattern was observed before the bull market of 2016-2017, when BTC oscillated below the 200-day SMA for three months before soaring and entering a bull market.
③ Similarly, during the bear market of 2018-2019, BTC rose above the 200-day SMA in the middle of 2019, was resisted, and then rose again. Later, the trend was briefly disrupted by the COVID-19 pandemic. Without the pandemic, BTC might have continued to operate above the 200-day SMA.
④ In the bear market of 2022, BTC reclaimed the 200-day SMA at the beginning of 2023 and remained sluggish from August of last year until October, oscillating for two months before entering a bull market.
⑤ Therefore, we are now facing a critical period: if BTC can reclaim the 200-day SMA in the future, it may signal the beginning of a new bullish phase (as indicated by the red circle and the subsequent trend). However, it is also important to note that if it continues to be resisted, it may mark the beginning of a bear market phase (as indicated by the red arrow in the trend).

Data Analysis: Over the past 30 days, the correlation between BTC and gold has been weakening, approaching historical lows.
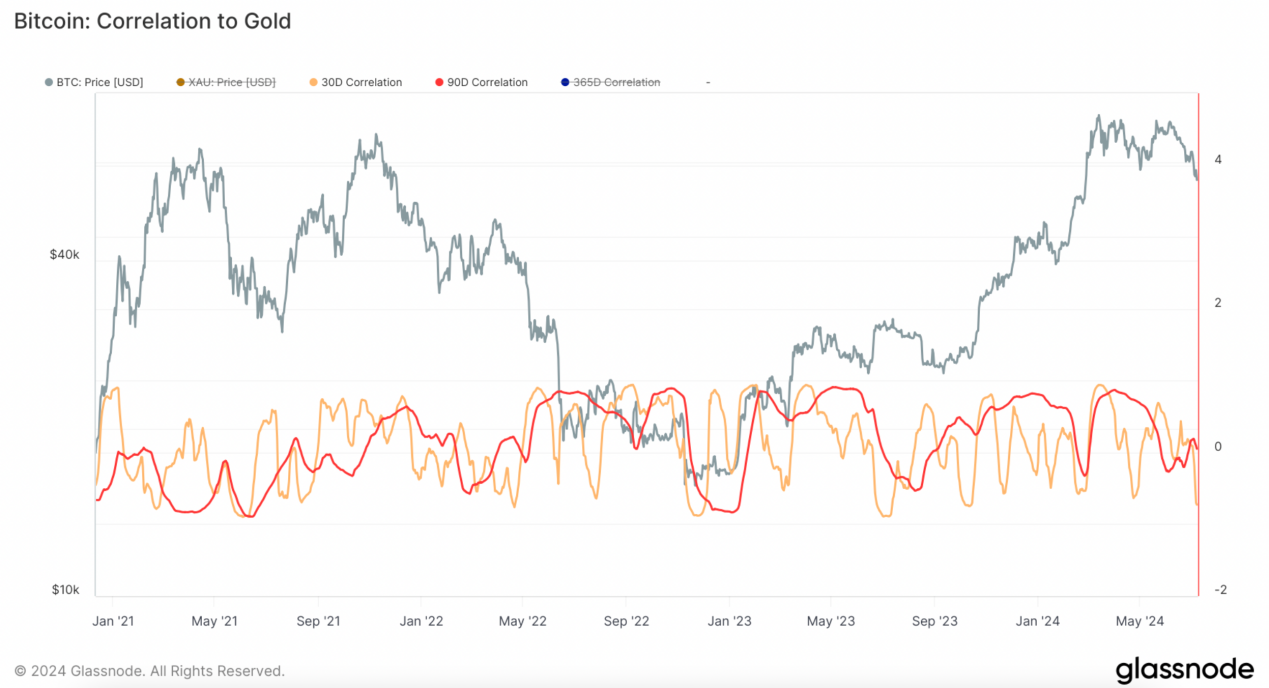
① The correlation between BTC and gold over the past three years, as shown in the chart, indicates intermittent peaks and valleys in the 30-day and 90-day correlation indicators, demonstrating a certain degree of difference in the correlation between BTC and gold prices.
② Around the end of March this year, the correlation between BTC and gold showed an upward trend, with both the 30-day and 90-day correlations approaching 1, indicating a positive correlation. This coincided with BTC setting a historical high in mid-March 2024, followed by gold also reaching a new high.
③ This is similar to what we discussed earlier about the correlation between BTC and the S&P 500 index approaching the 0 axis (after historically appearing negative four times, often indicating a bottom for BTC), which may provide us with some new insights for trading and analysis. Over the past 30 days, the correlation between BTC and gold has been weakening, with the current correlation coefficient approaching -0.8, close to a historical low.
④ The main reason for this phenomenon is the impact of current crypto market narratives, such as the compensation in Mentougou and the German government's sell-off, shrinking ETF trading volume, and nearly 50 days of continuous outflow in spot trading, all of which have influenced the market.
⑤ However, based on historical patterns, the correlation coefficient between BTC and gold often rebounds near the trough, so in the future, the correlation between the two may gradually return as the factors affecting the crypto industry decrease, macroeconomic data and the impact of monetary policy increase. In terms of trends, they may gradually synchronize in the future.
Follow us: AICoin
免责声明:本文章仅代表作者个人观点,不代表本平台的立场和观点。本文章仅供信息分享,不构成对任何人的任何投资建议。用户与作者之间的任何争议,与本平台无关。如网页中刊载的文章或图片涉及侵权,请提供相关的权利证明和身份证明发送邮件到support@aicoin.com,本平台相关工作人员将会进行核查。


