Good evening, brothers!
The ignorance and fearlessness of youth,
The wisdom and resourcefulness of middle age,
In front of nature, all I want is to be happily foolish!
The days in the air-conditioned room have been a bit long,
Thinking about patting the water, listening to the cicadas and the clear breeze in the mountains and fields,
Thinking about scooping up a basin of snails,
Thinking about the youth of that year.
That summer,
The weather didn't seem as hot as it is now,
I led my younger brother, sister, and a few friends to the fields to pick and sell snails,
Then we used the money from selling snails to buy ice popsicles,
In the alley in front of our house,
That refreshing and carefree feeling,
The youth at that time was always so carefree…
…
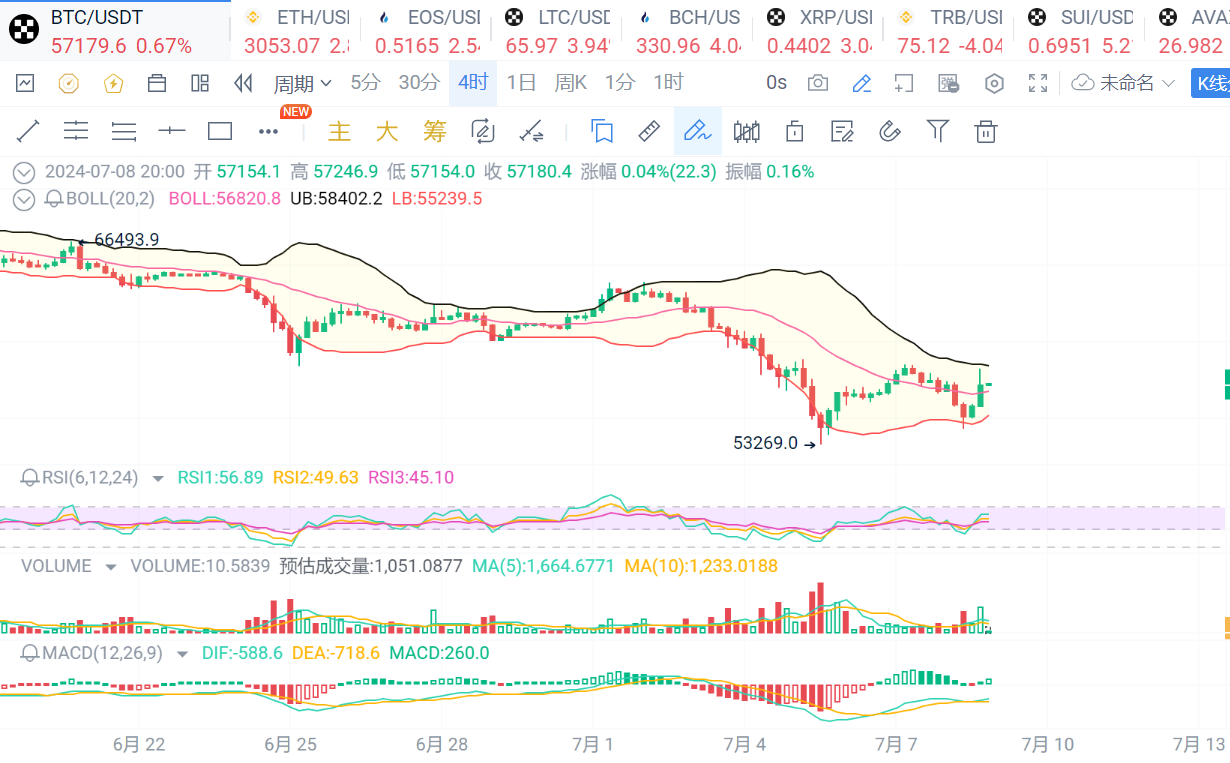
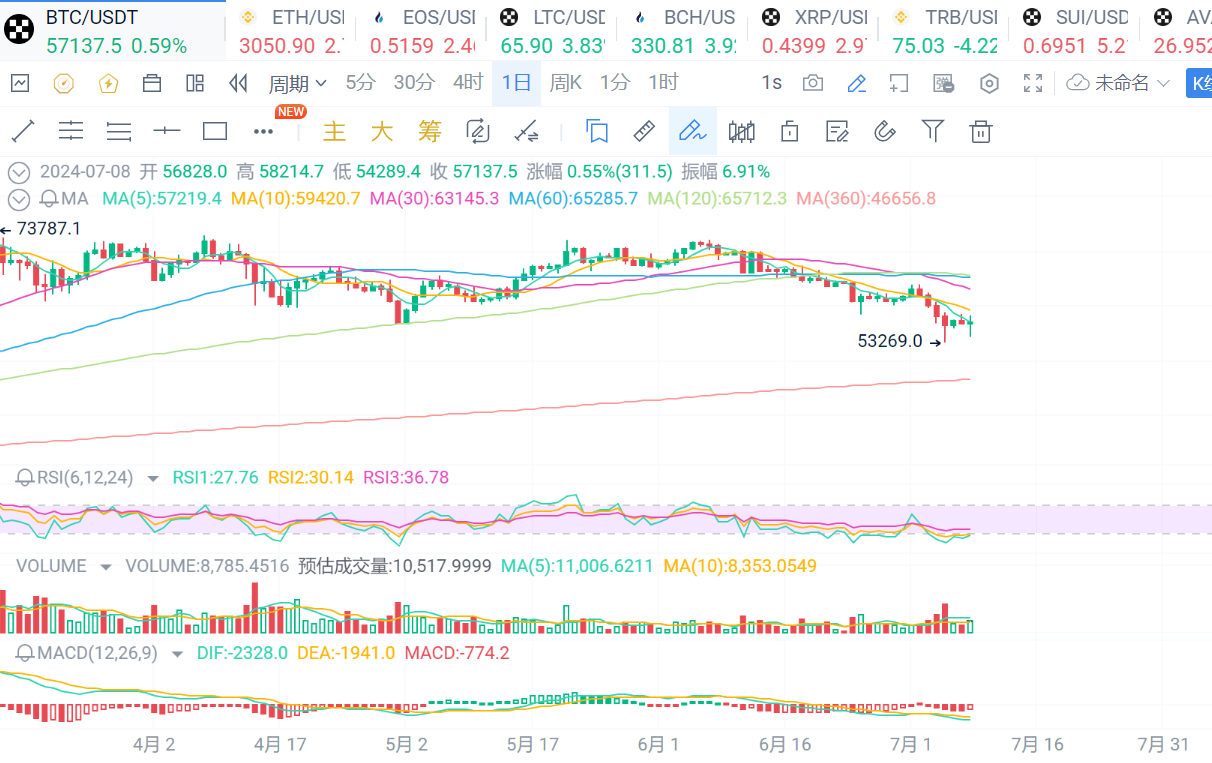
Despite the fluctuation in the price of Bitcoin and its drop to a five-month low, several key indicators suggest that the bulls may still have the upper hand, indicating a possible recovery in the price of Bitcoin. Bitcoin's start of the month was turbulent, with a drop of over 10.50% as of July 7, hovering around $57,000. The lowest point of Bitcoin touched $53,550, and its decline was mainly due to market concerns about Mt. Gox continuously repaying over 140,000 bitcoins to its customers and the German government liquidating bitcoins, leading to market sell-offs. The latest decline in Bitcoin prices is accompanied by a growing gap between the price decline and the rising Relative Strength Index (RSI). This gap usually indicates a weakening of selling pressure, despite the continued price decline. From a technical analysis perspective, this situation usually means that the current downtrend may be reversing or slowing down, suggesting that as market sentiment turns bullish again, Bitcoin may soon rebound. The bullish hammer line and oversold RSI are two classic technical indicators supporting a bullish reversal scenario. First, Bitcoin formed a bullish hammer candlestick pattern on July 5, characterized by a small body at the top of the daily candlestick chart, a long lower shadow, and a small upper shadow. A similar situation also occurred in May. Second, Bitcoin's daily RSI reading hovers near the oversold threshold of 30, which usually indicates consolidation or a recovery period. Analyst Jacob Canfield predicts that this indicator may signal a rebound, and BTC may return to the previous high point of over $70,000.
BTC: Looking at the 4-hour chart, the price is above the Bollinger Band's midline, and short-term trading volume is moderate, with continued predominance of oscillation.
Looking at the daily chart, the price continues to oscillate near the moving average.
In summary, the support level is at 57,000, and the resistance level is at 57,400.
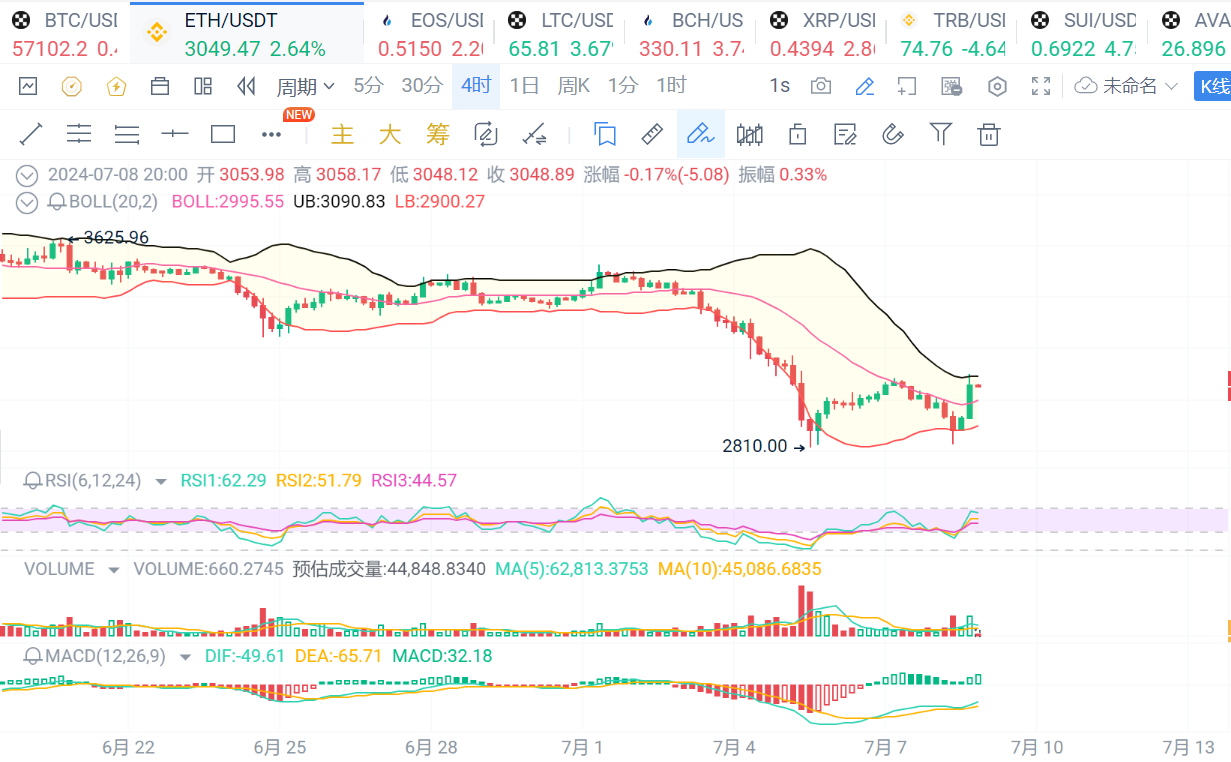
ETH: Looking at the 4-hour chart, the price rebounded to near the upper Bollinger Band and then retraced, with short-term trading still dominated by oscillation, with support at 3030 and resistance at 3060.
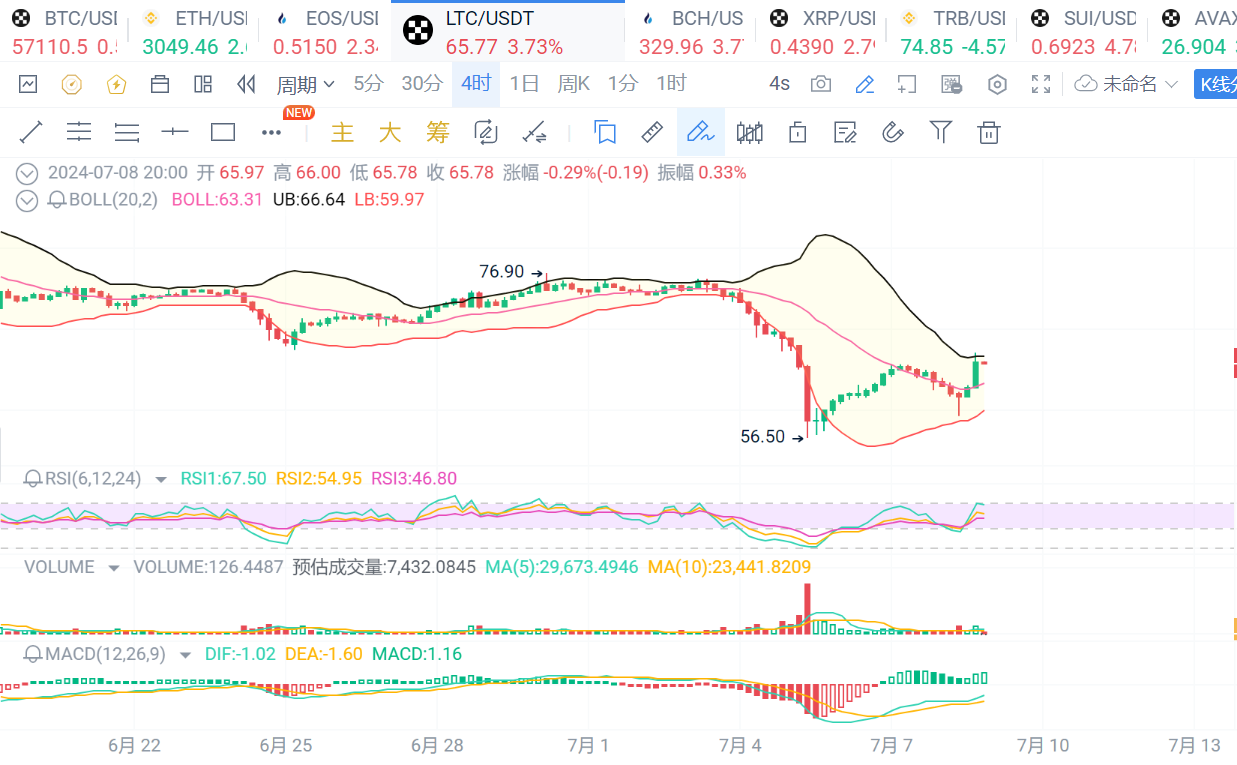
LTC: The price rebounded to near the upper Bollinger Band and then retraced, with short-term trading still dominated by oscillation, with support at 64 and resistance at 67.
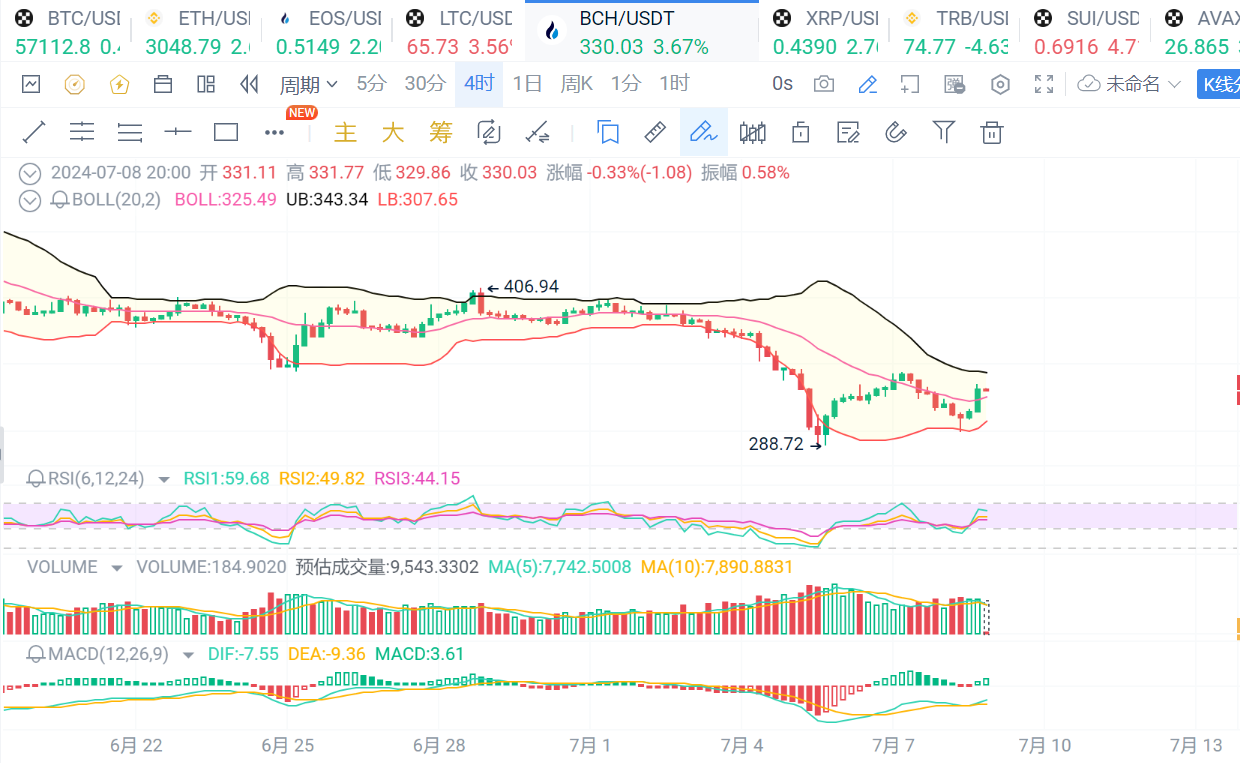
BCH: The price continues to oscillate above the midline of the Bollinger Band, with short-term trading dominated by oscillation, with support at 320 and resistance at 340.
That's all for now, good night!

免责声明:本文章仅代表作者个人观点,不代表本平台的立场和观点。本文章仅供信息分享,不构成对任何人的任何投资建议。用户与作者之间的任何争议,与本平台无关。如网页中刊载的文章或图片涉及侵权,请提供相关的权利证明和身份证明发送邮件到support@aicoin.com,本平台相关工作人员将会进行核查。


