Despite Bitcoin briefly falling below $54,000 on Friday, the net inflow of the U.S. Bitcoin spot ETF on the 5th was $143 million, reversing the outflow trend at the beginning of the week and setting a new high in the past month.
After the bankrupt Bitcoin exchange Mt.Gox initiated repayments, it was considered the main culprit dragging down the recent trend of Bitcoin. The selling pressure has not ended, and the repayment phase may continue until October. In addition, the recent large transfers of Bitcoin to exchanges by the governments of Germany and the United States, suspected of selling coins for cash, are also considered one of the main culprits dragging down the trend of Bitcoin.
Bitcoin 4-hour chart
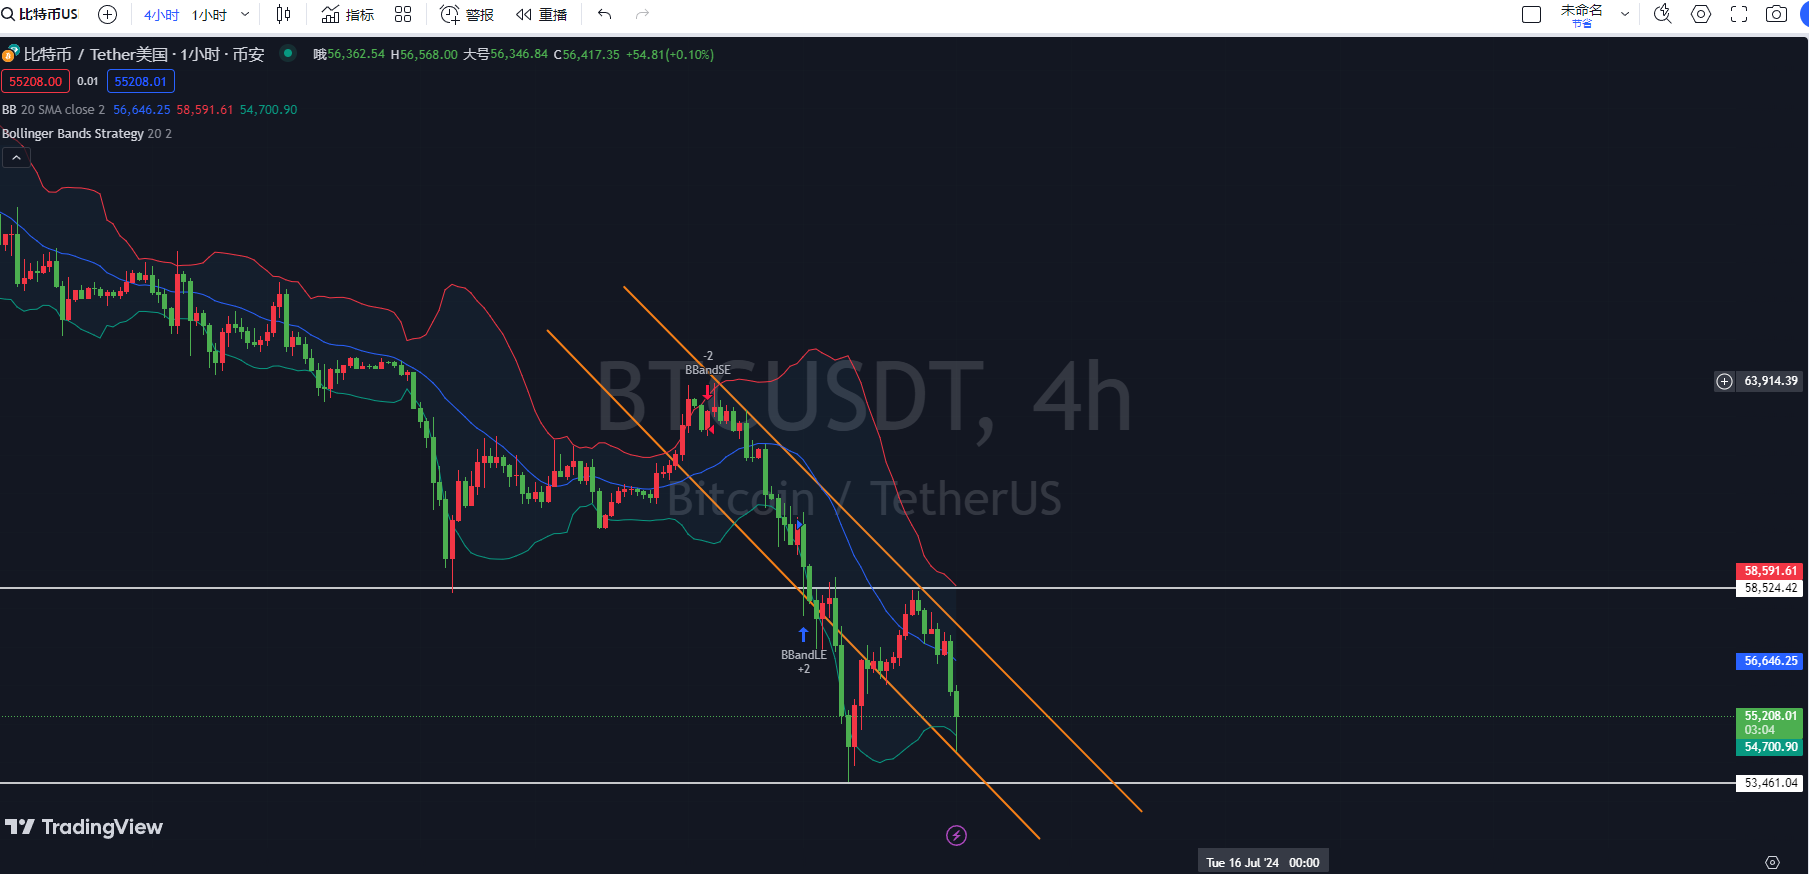
First, according to the Bollinger Bands indicator on the 4-hour chart of Bitcoin, the current price of Bitcoin is close to the lower band, indicating a low position. It may find support near the lower band, and the large gap between the upper and lower bands indicates relatively high market volatility in the future.
Second, according to the KDJ indicator on the 4-hour chart of Bitcoin, all three KDJ lines are currently at low levels, and the J line is in oversold territory. However, there is no clear sign of a turning point, indicating that the price may further decline in the future.
Finally, according to the MACD indicator on the 4-hour chart of Bitcoin, both the DIF line and the DEA line are below the zero axis, and the DIF line is approaching the DEA line from above, showing signs of a bearish crossover. Once the bearish crossover occurs, the price will further decline, and the gradually increasing green bars on the MACD indicate stronger downward momentum.
Bitcoin 1-hour chart
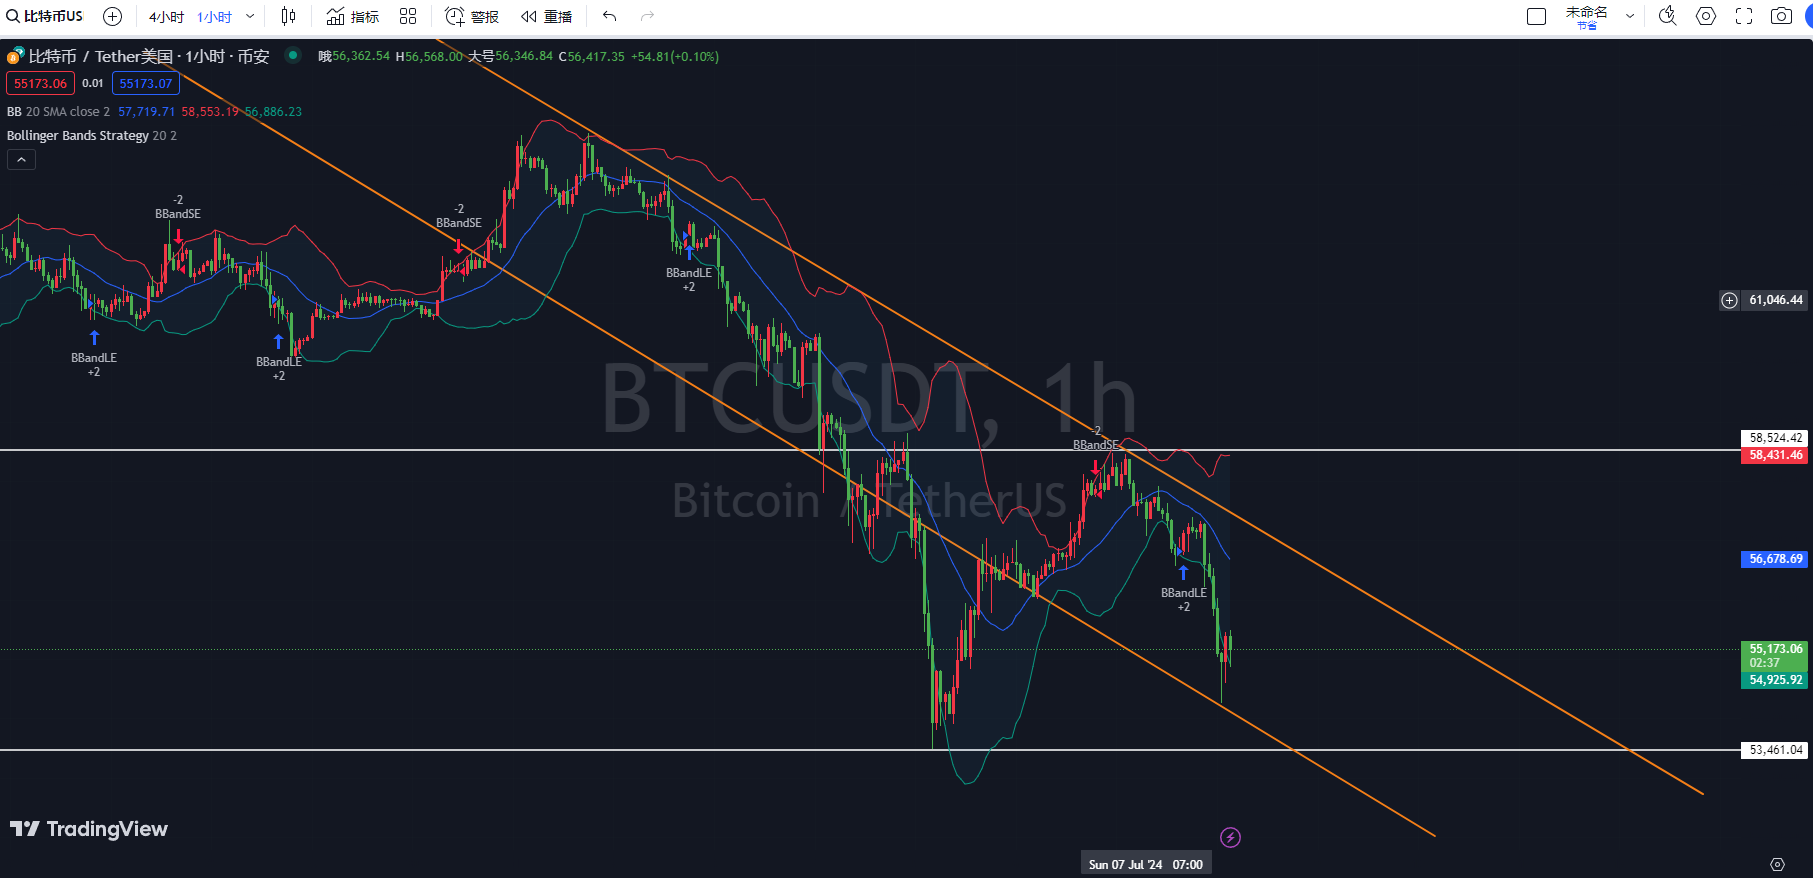
First, according to the Bollinger Bands indicator on the 1-hour chart of Bitcoin, the middle band is currently trending downward, indicating an overall downward trend in the market. The price fluctuates between the lower band and the middle band, with rebounds near the lower band, indicating some demand for rebounds during this period. However, overall, the market remains bearish.
Second, according to the KDJ indicator on the 1-hour chart of Bitcoin, the KDJ shows an upward trend at low levels, and the J line is starting to rise, indicating some demand for rebounds in the oversold zone. However, the overall market momentum is not strong. A clear signal of a short-term rebound will be shown if the K line crosses above the D line to form a golden cross.
Finally, according to the MACD indicator on the 1-hour chart of Bitcoin, both the DIF line and the DEA line are below the zero axis, and there are signs of the DIF line approaching the DEA line from above. If the DIF line can cross below the DEA line to form a bearish crossover, the price will further decline. However, a clear bearish crossover signal has not yet formed, indicating that the market will continue to trade sideways or experience a slight rebound in the short term.
Comprehensive analysis: According to the 4-hour chart of Bitcoin, the KDJ indicator is in oversold territory, and Bitcoin may experience a brief rebound. The price is running between the middle band and the lower band of the Bollinger Bands, indicating an overall bearish trend. If the rebound is weak, it may continue to decline. According to the 1-hour chart of Bitcoin, the support of the lower band of the Bollinger Bands and the rebound signal of the oversold KDJ support a short-term rebound. However, the MACD has not yet formed a clear signal of an uptrend or downtrend, so the momentum of the rebound may not be strong.
In conclusion, the following advice is given for reference:
Short Bitcoin rebound to around 55,500, with a target near 54,000 and a defensive position at 56,000.
Instead of giving you a 100% accurate advice, it's better to give you the correct mindset and trend, after all, teaching someone to fish is better than giving them a fish. The suggestion is to focus on the mindset, grasp the trend, and plan the layout and position of the market. What I can do is to use my practical experience to help everyone make investment decisions and manage operations in the right direction.
Drafting time: (2024-07-08, 11:25)

(Written by Master Coin) Disclaimer: The advice published on the internet is subject to delay and is for reference only. The author is dedicated to research and analysis in the investment fields of Bitcoin, Ethereum, altcoins, foreign exchange, stocks, and has been involved in the financial market for many years, with rich experience in actual trading operations. Investment involves risks, and entry into the market should be cautious. For more real-time market analysis, please follow Master Coin for discussion and exchange.
免责声明:本文章仅代表作者个人观点,不代表本平台的立场和观点。本文章仅供信息分享,不构成对任何人的任何投资建议。用户与作者之间的任何争议,与本平台无关。如网页中刊载的文章或图片涉及侵权,请提供相关的权利证明和身份证明发送邮件到support@aicoin.com,本平台相关工作人员将会进行核查。


