
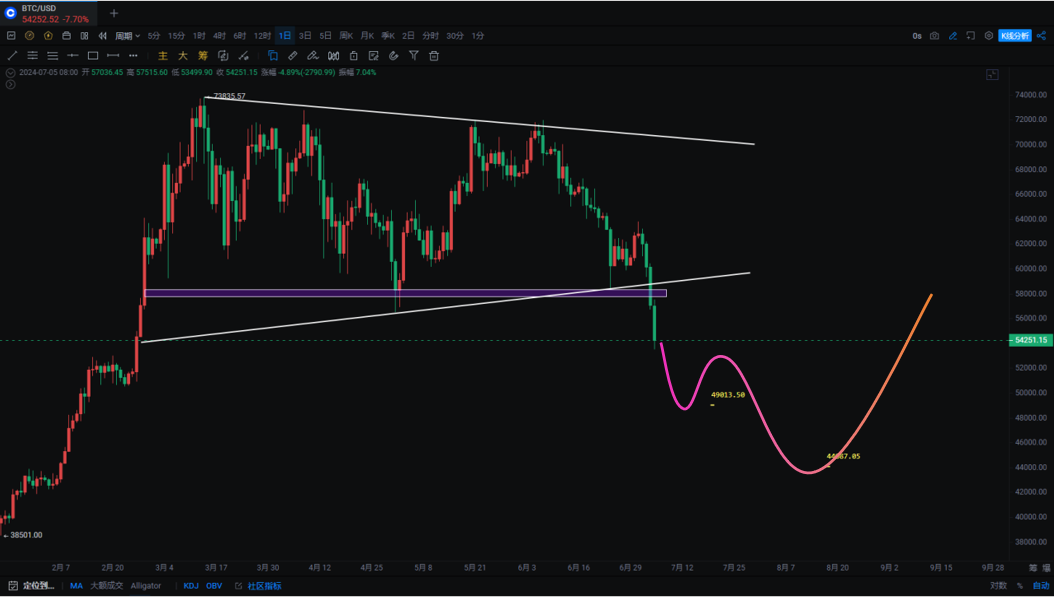
The weekly closing continued to fall below 56552, and will continue to test the support at 53500. After oscillating at a high level for 4 months, it chose to break downwards. We have previously mentioned that the platform's peak is not the peak, and there is a probability of a breakthrough after the subsequent pullback. It rebounded to a high of 58475 over the weekend and then fell.
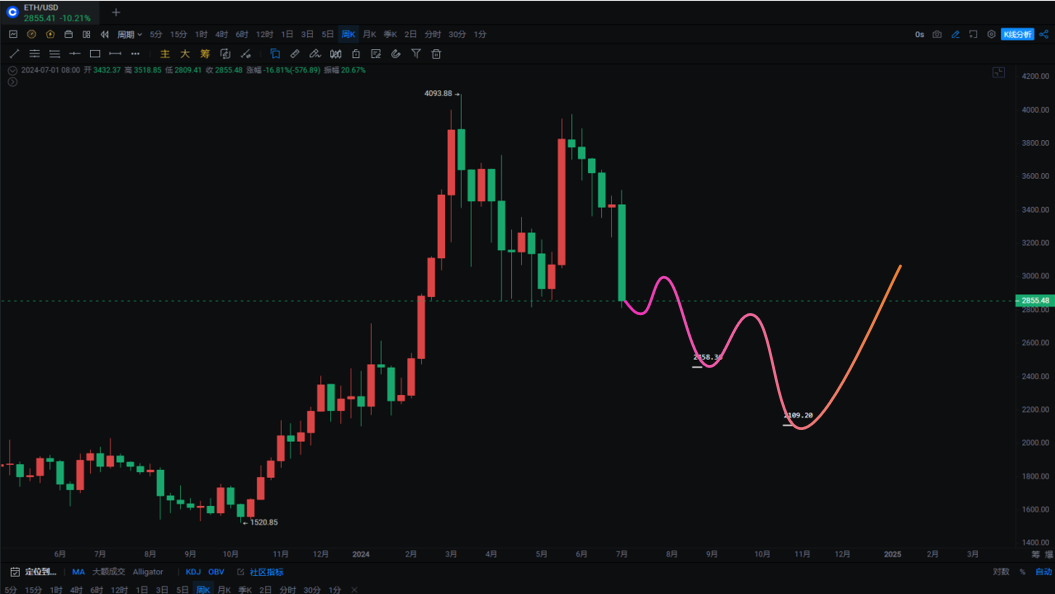
After rebounding to a high of 3081, Ethereum also fell. We previously mentioned that the Ethereum market was hanging on the expectation of ETF, and the longer it dragged on, the more dangerous the market became. From early July to mid-July, the SEC did not clearly indicate a specific time, it was just market speculation. Do you think these institutional applications and the SEC will be a game-changer or just an added bonus?
Institutions led by BlackRock have an average ETF price of 55000, and they are basically at a small loss. If they cannot drive the market up, can the market, which relies on retail investors to buy the dip, rise? Many people have been continuously buying the dip along the way. If it's for short-term trading, it's okay, but if they keep adding positions, it might be uncomfortable for a while.
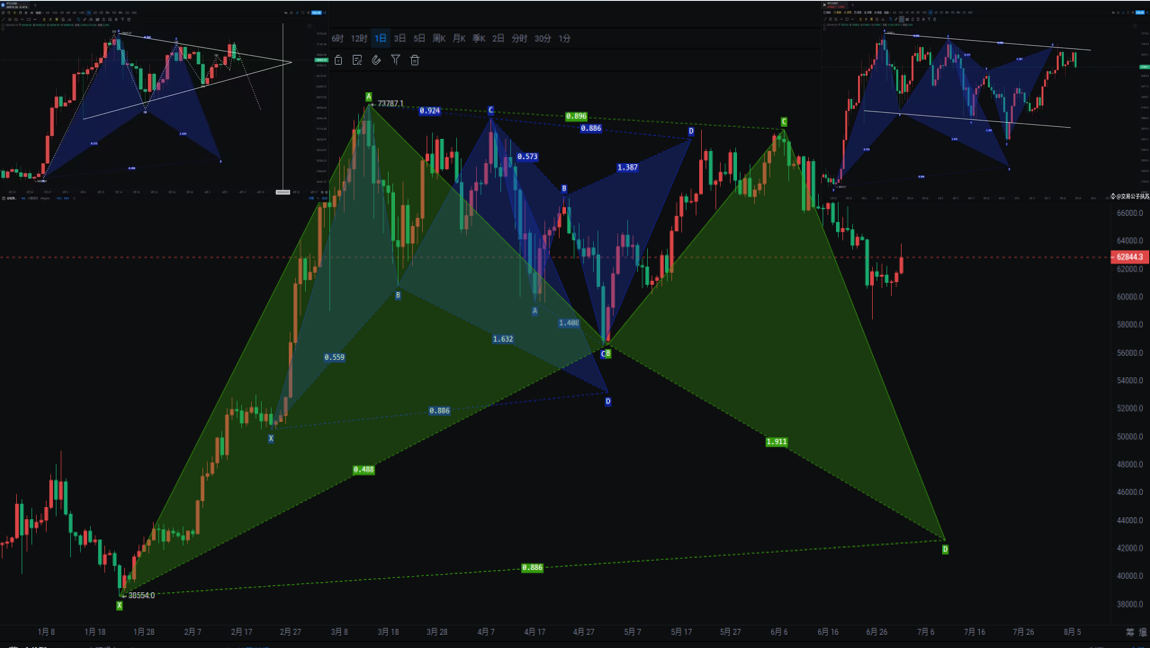
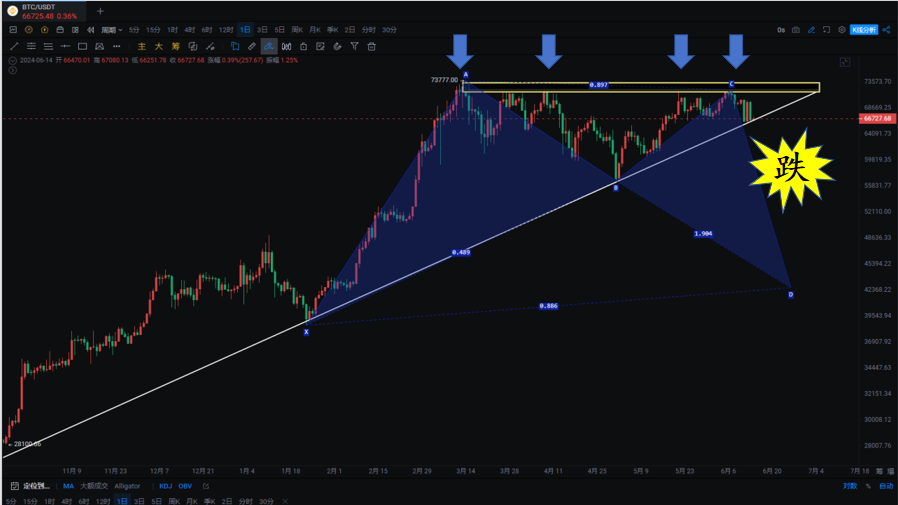
We warned about the current situation and compared it to the market on May 25, and on June 12, we warned about the potential "M" pattern at the weekly level, suggesting reducing holdings on rallies in spot markets, and being cautious about a repeat of the market crash on May 19! This includes the reasons for the bearish view. On June 14, we warned that under strong pressure, the market was rejected, with a daily double negative sandwiching a positive candle, indicating an imminent crash. If interested, you can take a look!

Bitcoin
The weekly chart has seen 4 consecutive declines, and last week's closing did not hold above 56552, failing to recover the "M" pattern. The recent rebound failed to break through 72000, and the weekly MACD has been on a downward trend. Now the monthly KDJ has shown a death cross, and the weekly MACD is still on a downward trend with a death cross in KDJ. The longer timeframes do not support the dominance of the bear market. The daily chart has not stopped falling. Remember our advice to buy the dip at 44000-46000.
The 4-hour chart shows a step-by-step decline from 72000, rebounding to 70400 and then continuing to fall, breaking below 66000 without recovering the rebound, and rebounding to 58400 before continuing to fall. The rebound to 53485 a few days ago will continue to fall to 58500. Every rebound has been suppressed by the bears. We'll have to wait and see when this bearish trend will end.
Support:
Resistance:
Ethereum
After rebounding to 3081, it continued to test the lowest point of 2824 to test the neckline support of the "M" pattern. Breaking below it is only a matter of time. Once the entire trend falls below 3081, it will reverse. As for the altcoins, once Ethereum accelerates downwards, the altcoins will be equally hard to escape!!! Buying the dip is a short-term and risky behavior, and it's easy to get trapped. Let's wait for medium to long-term trading opportunities!
Support:
Resistance:
If you like my views, please like, comment, and share. Let's go through the bull and bear markets together!!!
The article is time-sensitive and is for reference only, with real-time updates.
Focusing on candlestick technical research, winning global investment opportunities. WeChat public account: 交易公子扶苏

免责声明:本文章仅代表作者个人观点,不代表本平台的立场和观点。本文章仅供信息分享,不构成对任何人的任何投资建议。用户与作者之间的任何争议,与本平台无关。如网页中刊载的文章或图片涉及侵权,请提供相关的权利证明和身份证明发送邮件到support@aicoin.com,本平台相关工作人员将会进行核查。


