Daily Sharing
Yesterday we mentioned that the rebound target for the 1-hour chart of Bitcoin was around 57500 or 58000. The rebound has now successfully reached the target, meeting our expectations. Next, we need to wait for Bitcoin to successfully initiate the third downward movement on the 1-hour chart to see if it can retest around 53000. If it can form a suitable structure, the downward movement on the 4-hour chart is expected to end.
Overall, it will take some time for the market to reverse its trend. It's not realistic to expect a direct surge to near the historical high points. There will still be repeated fluctuations. Yesterday, we mentioned that the current situation presents the biggest opportunity in this bull market, but this does not mean that a new round of uptrend will start immediately. It still requires some time.
PS: My WeChat account with a large following has been restricted by Tencent and will be restored at the end of the month. During this period, you can add my alternate account for communication. The contact information for the alternate account is available at the bottom of my public account.
BTC
Due to the rapid changes in the market, this article can only make predictions based on the market conditions at the time of publication. Short-term traders should pay attention to the latest market changes and use this information as a reference only.
1H:
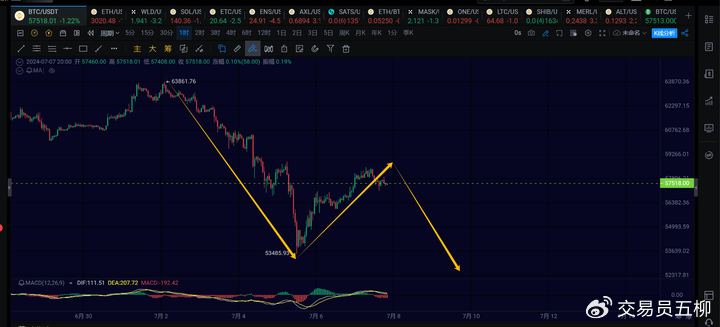
On the 1-hour chart, it is uncertain whether the current second rebound on the 1-hour chart has ended. It may retest 58500 or directly pull back. Overall, it is expected that there may be a 1-hour chart pullback tomorrow. If the third 1-hour chart pullback can break below 53485, the 4-hour chart pullback may end.
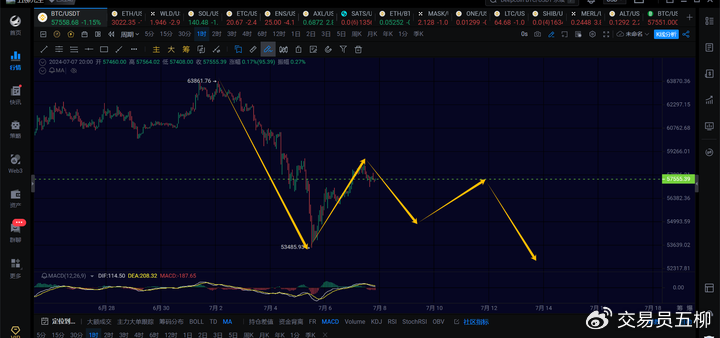
Of course, if the movement is more complex, Bitcoin may form a 1-hour chart consolidation above 55000 and then retest 53000. Specific market conditions should be followed based on the actual situation.
15M:
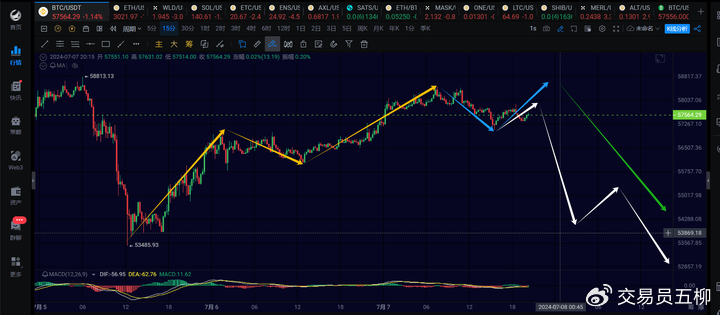
On the 15-minute chart, judging by the current strength of the rebound, there is a certain probability of retesting 58500 and then starting a 1-hour chart pullback, as indicated by the blue and green arrows. If the rebound on the 15-minute chart cannot break above 58100, there may be a third 15-minute chart downward movement, as indicated by the white arrow, leading to a direct 1-hour chart pullback.
ETH
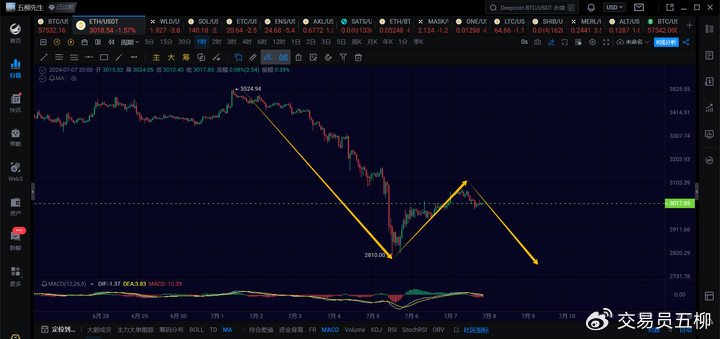
The situation is similar for Ethereum. The current second 1-hour chart rebound may be coming to an end, and it may initiate the third 1-hour chart downward movement towards around 2750. Overall, there is still at least one more pullback to around 2800 on the 4-hour chart. Patience is required.
Trend Direction
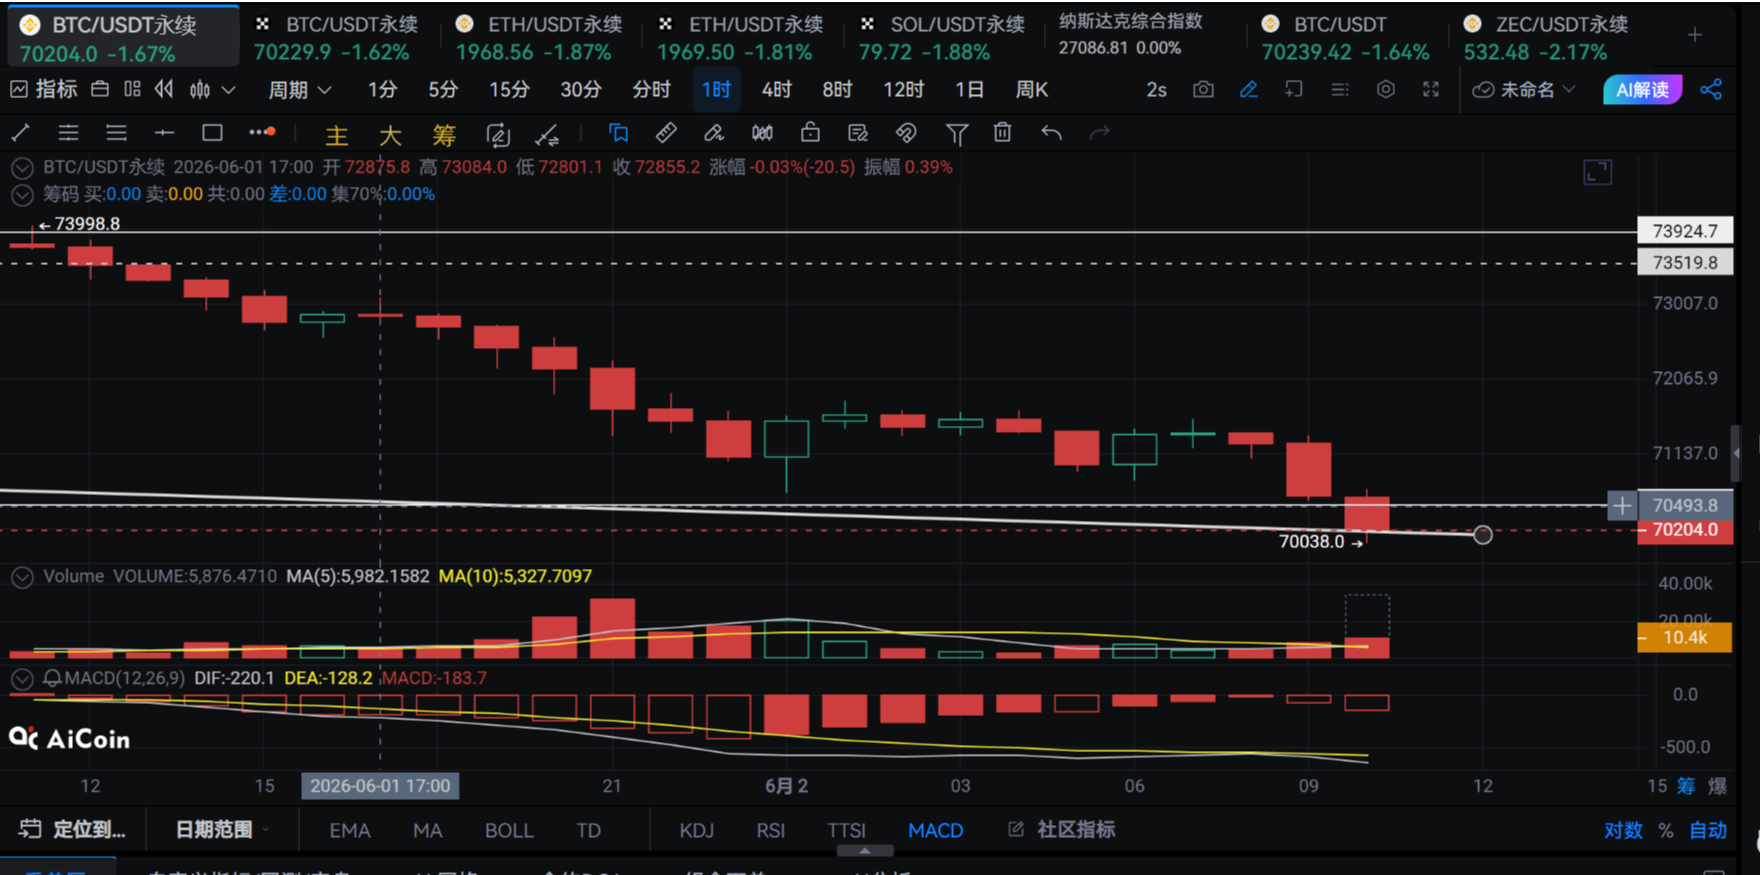
Weekly Chart: Downward trend, currently undergoing a downward movement on the weekly chart. A new uptrend towards 100,000+ will only occur after this downward movement is completed.
Daily Chart: Downward trend, currently undergoing a pullback from around 72000 on the daily chart. Support around 50000 below.
4-hour Chart: Downward trend, currently undergoing the third 4-hour chart downward movement, looking to see if it can stop around 51500-52000.
1-hour Chart: Downward trend, the current second 1-hour chart rebound is likely coming to an end. Subsequently, the strength of the third 1-hour chart downward movement will be observed.
15-minute Chart: Downward trend, breaking below 56500 confirms a 1-hour chart pullback.
Feel free to join my public account for discussions and exchanges:

This article is time-sensitive. Please be aware of the risks. The above are personal suggestions and are for reference only!
免责声明:本文章仅代表作者个人观点,不代表本平台的立场和观点。本文章仅供信息分享,不构成对任何人的任何投资建议。用户与作者之间的任何争议,与本平台无关。如网页中刊载的文章或图片涉及侵权,请提供相关的权利证明和身份证明发送邮件到support@aicoin.com,本平台相关工作人员将会进行核查。